| Param | Original file | Final file |
|---|---|---|
| Filename | modeM0/AS1C07_001T01_9000006450_50886cztM0_level2.fits | modeM0/AS1C07_001T01_9000006450_50886cztM0_level2_quad_clean.evt |
| Size (bytes) | 481,887,360 | 85,132,800 |
| Size | 459.6 MB | 81.2 MB |
| Events in quadrant A | 5,051,716 | 547,756 |
| Events in quadrant B | 3,382,071 | 611,993 |
| Events in quadrant C | 3,829,569 | 527,130 |
| Events in quadrant D | 5,121,385 | 483,087 |
| Mode SS | |||
|---|---|---|---|
| Quadrant | BADHDUFLAG | Total packets | Discarded packets |
| A | 0 | 118 | 0 |
| B | 0 | 118 | 0 |
| C | 0 | 118 | 0 |
| D | 0 | 118 | 0 |
| Mode M0 | |||
|---|---|---|---|
| Quadrant | BADHDUFLAG | Total packets | Discarded packets |
| A | 0 | 18982 | 1 |
| B | 0 | 14116 | 1 |
| C | 0 | 15213 | 1 |
| D | 0 | 19228 | 1 |
| Mode M9 | |||
|---|---|---|---|
| Quadrant | BADHDUFLAG | Total packets | Discarded packets |
| A | 0 | 11 | 0 |
| B | 0 | 11 | 0 |
| C | 0 | 11 | 0 |
| D | 0 | 11 | 0 |
| Quadrant | Total seconds | Saturated seconds | Saturation percentage |
|---|---|---|---|
| A | 5836 | 486 | 8.327622% |
| B | 5837 | 215 | 3.683399% |
| C | 5837 | 318 | 5.448004% |
| D | 5837 | 527 | 9.028611% |
Noise dominated data is calculated using 1-second bins in cleaned event files. If a bin has >2000 counts, and if more than 50% of those come from <1% of pixels, then it is considered to be noise-dominated and hence unusable.
| Quadrant | # 1 sec bins | Bins with >0 counts | Bins with >2000 counts | High rate bins dominated by noise | Noise dominated (total time) | Noise dominated (detector-on time) | Marked lightcurve |
|---|---|---|---|---|---|---|---|
| A | 6936 | 5838 | 273 | 273 | 3.94% | 4.68% | 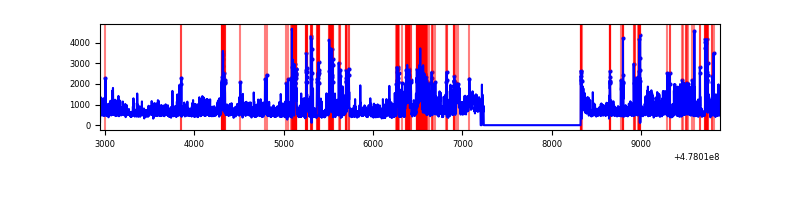 |
| B | 6937 | 5839 | 79 | 79 | 1.14% | 1.35% | 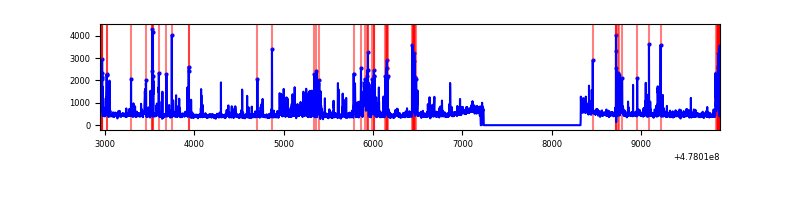 |
| C | 6937 | 5839 | 160 | 160 | 2.31% | 2.74% | 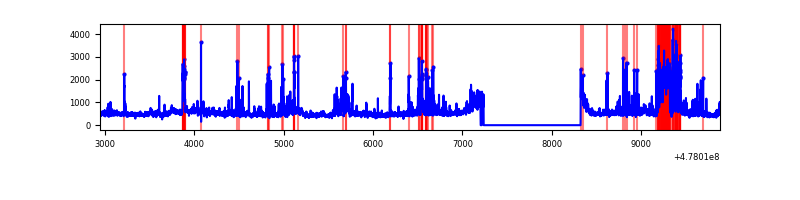 |
| D | 6937 | 5839 | 294 | 294 | 4.24% | 5.04% | 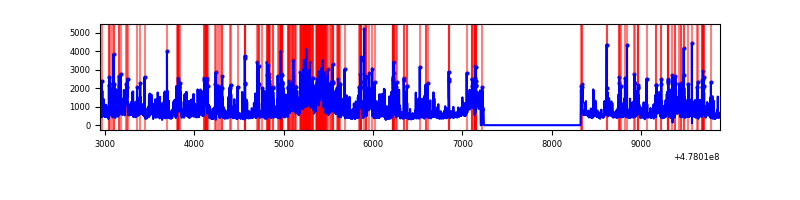 |
Top three noisy pixels from each quadrant. If the there are fewer than three noisy pixels in the level2.evt file, extra rows are filled as -1
| Pixel properties | Quadrant properties | ||||||
|---|---|---|---|---|---|---|---|
| Quadrant | DetID | PixID | Counts | Sigma | Mean | Median | Sigma |
| A | 4 | 4 | 1406156 | 9154.79 | 620 | 603 | 153.5 |
| A | 7 | 206 | 326332 | 2121.57 | 620 | 603 | 153.5 |
| A | 3 | 130 | 147038 | 953.77 | 620 | 603 | 153.5 |
| B | 4 | 206 | 315124 | 2373.12 | 627 | 605 | 132.5 |
| B | 8 | 128 | 155102 | 1165.71 | 627 | 605 | 132.5 |
| B | 10 | 247 | 100651 | 754.87 | 627 | 605 | 132.5 |
| C | 1 | 29 | 509044 | 3047.15 | 611 | 604 | 166.9 |
| C | 5 | 10 | 160606 | 958.91 | 611 | 604 | 166.9 |
| C | 13 | 3 | 124228 | 740.9 | 611 | 604 | 166.9 |
| D | 7 | 45 | 826928 | 4928.97 | 598 | 577 | 167.7 |
| D | 10 | 181 | 507918 | 3026.15 | 598 | 577 | 167.7 |
| D | 2 | 249 | 293737 | 1748.62 | 598 | 577 | 167.7 |
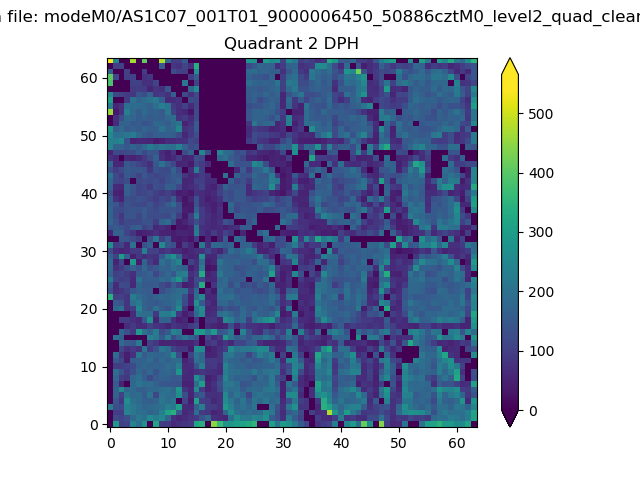
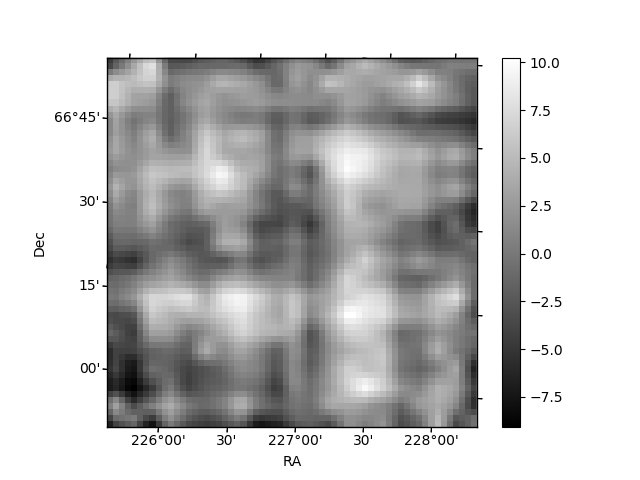
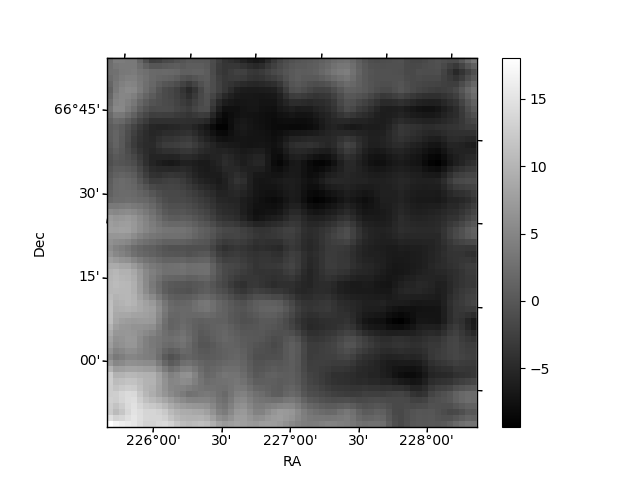
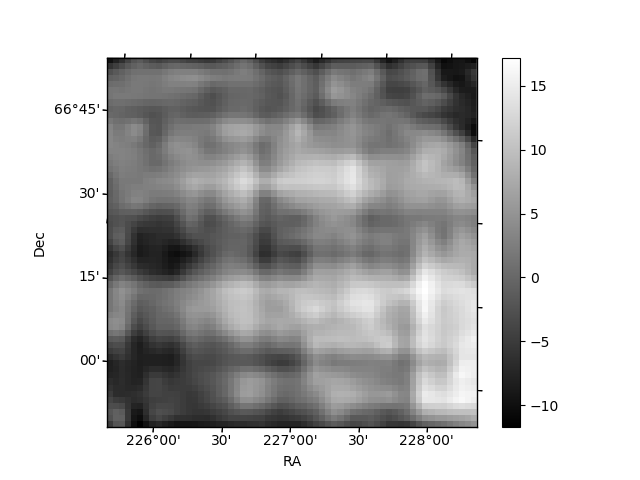
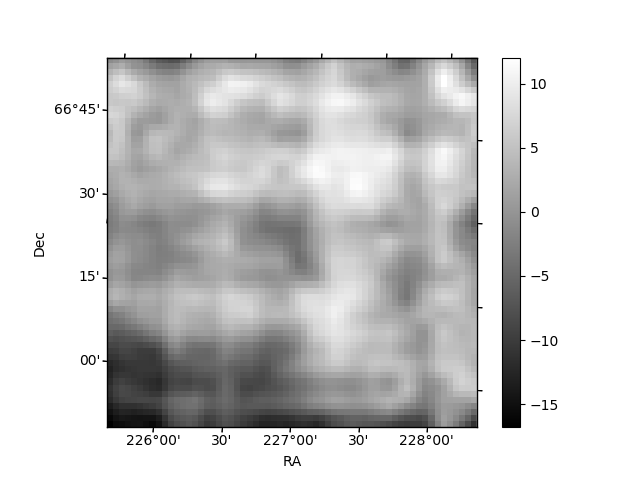
Histogram calculated using DETX and DETY for each event in the final _common_clean file
| Quadrant A | 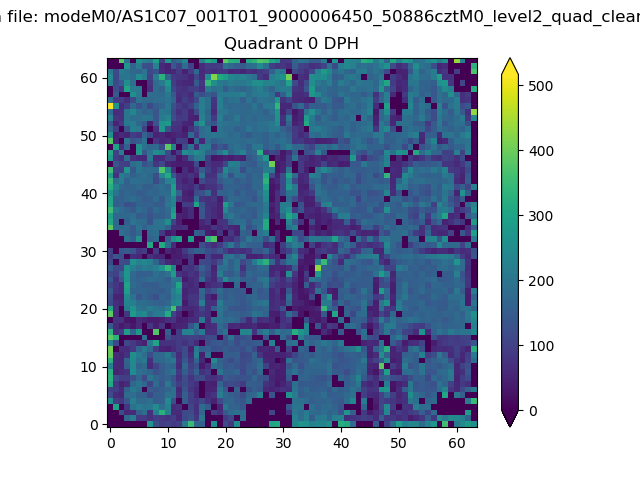 |
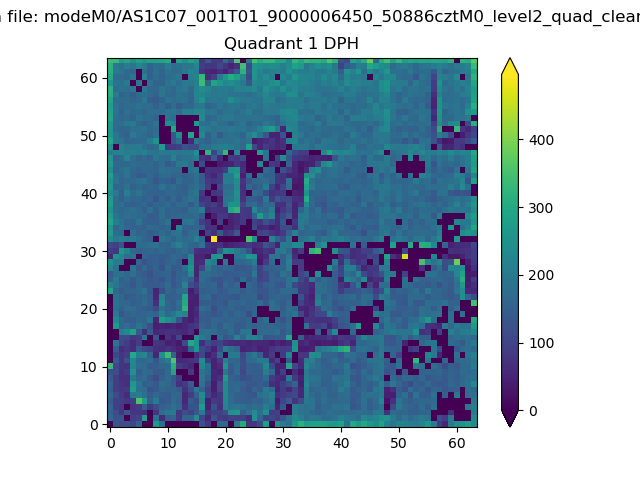 |
Quadrant B |
|---|---|---|---|
| Quadrant D | 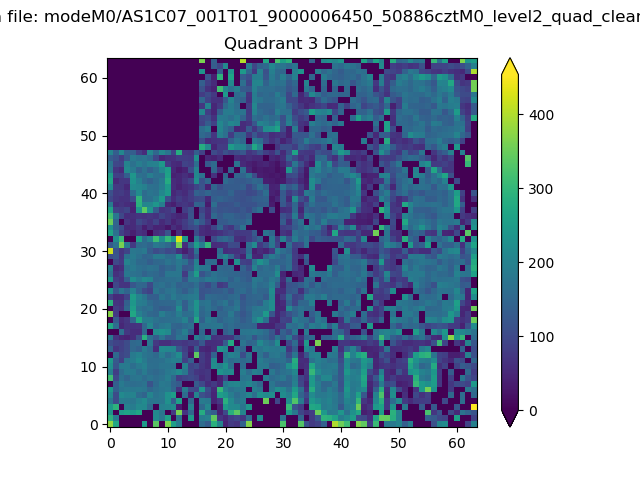 |
 |
Quadrant C |
| Plot type | Count rate plots | Images |
|---|---|---|
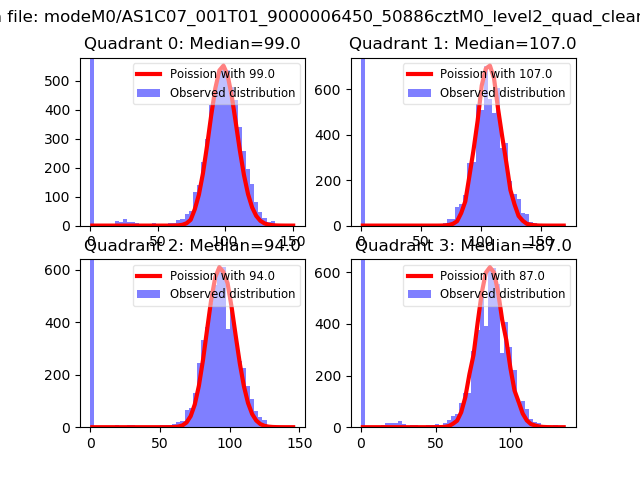
| Comparison with Poisson distribution Blue bars denote a histogram of data divided into 1 sec bins. Red curve is a Poisson curve with rate = median count rate of data. |
 |
 |
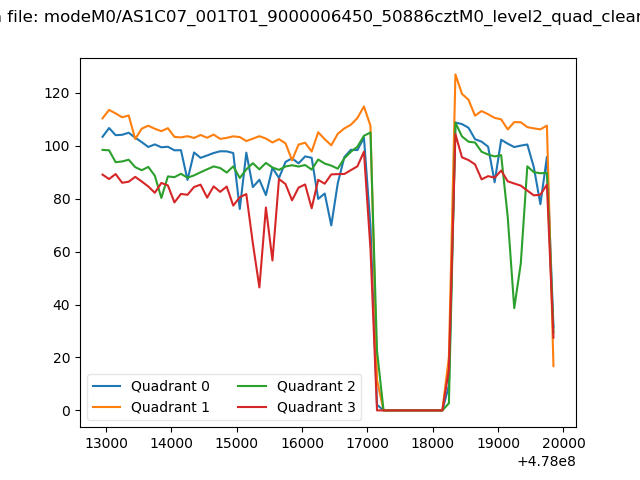
| Quadrant-wise count rates Data is divided into 100 sec bins |
 |
|
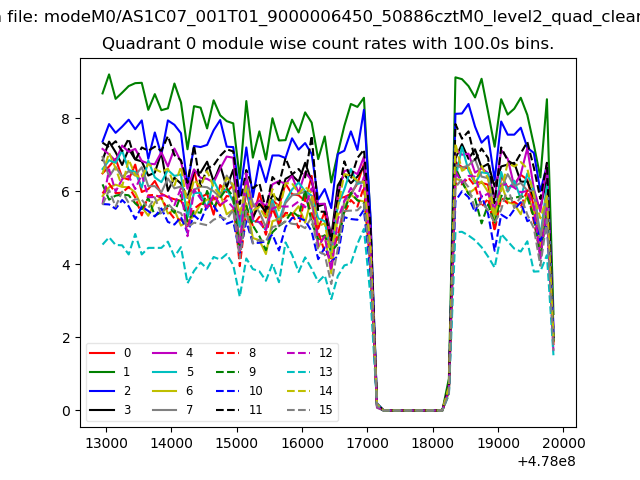
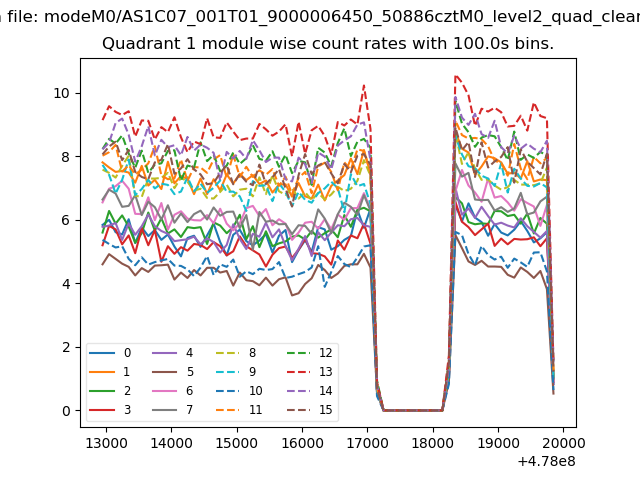
| Module-wise count rates for Quadrant A Data is divided into 100 sec bins |
 |
 |
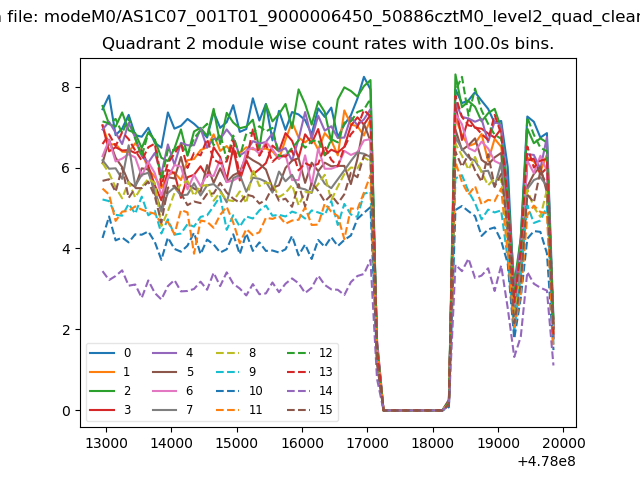
| Module-wise count rates for Quadrant B Data is divided into 100 sec bins |
 |
 |
| Module-wise count rates for Quadrant C Data is divided into 100 sec bins |
 |
 |
| Module-wise count rates for Quadrant D Data is divided into 100 sec bins |
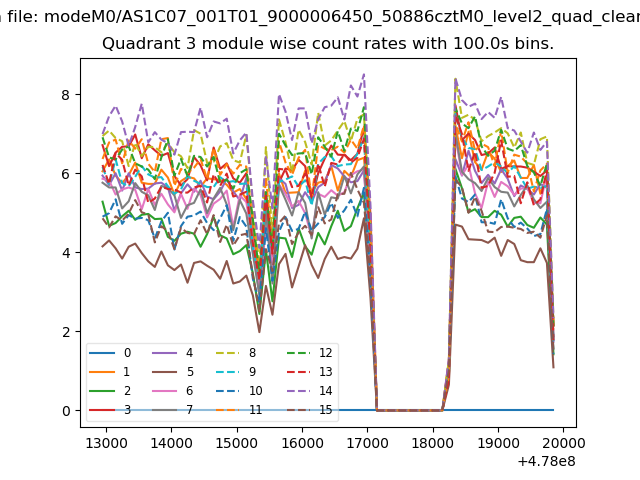 |
 |
| Parameter | Plot |
|---|---|
| CZT HV Monitor | 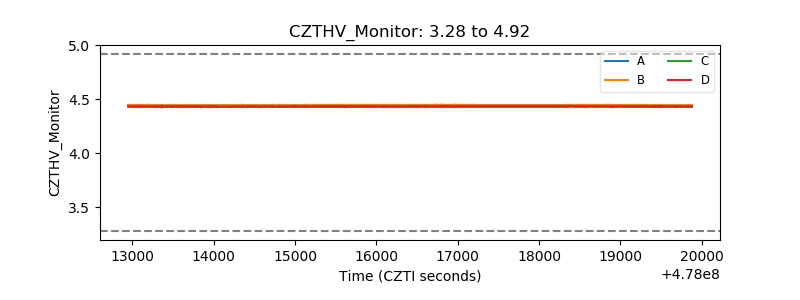 |
| D_VDD | 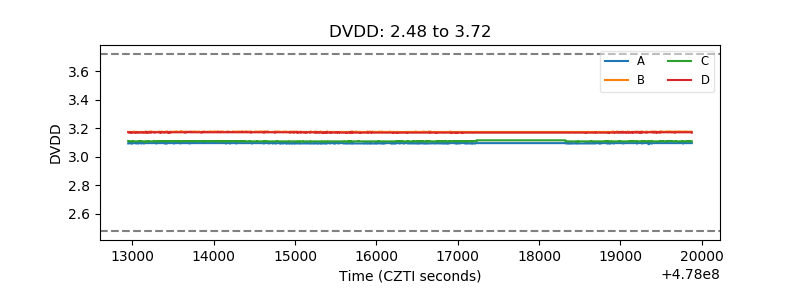 |
| Temperature 1 | 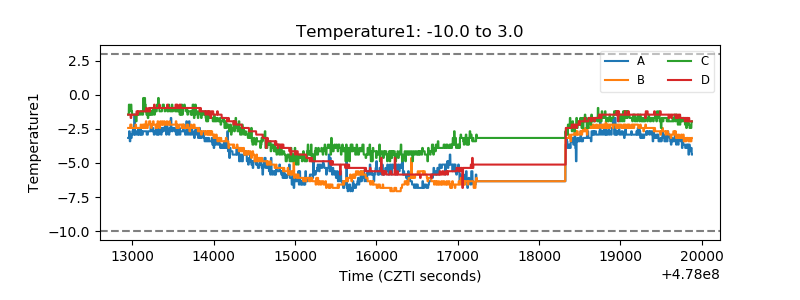 |
| Veto HV Monitor | 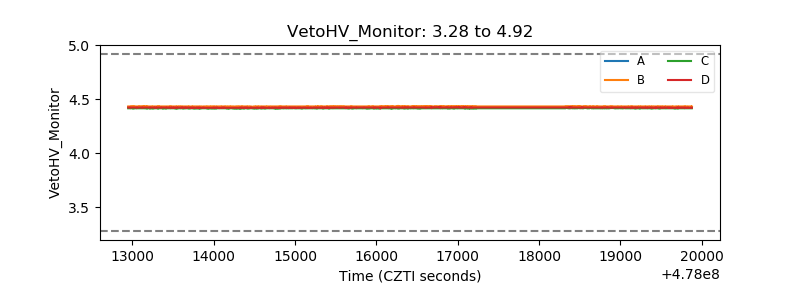 |
| Veto LLD | 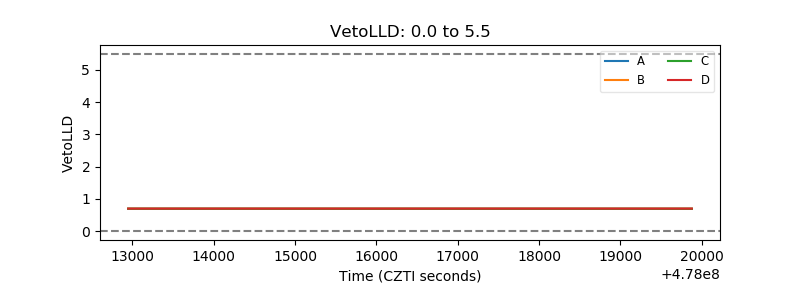 |
| Alpha Counter | 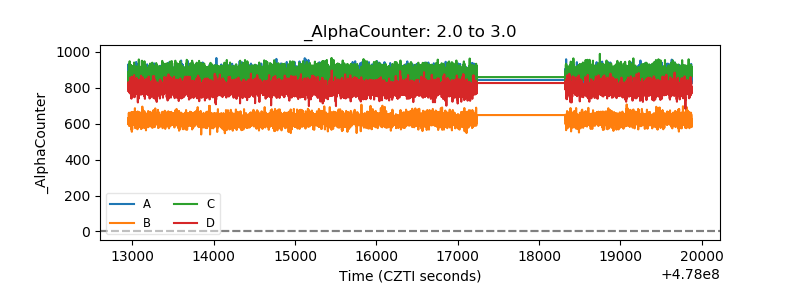 |
| _CPM_Rate | 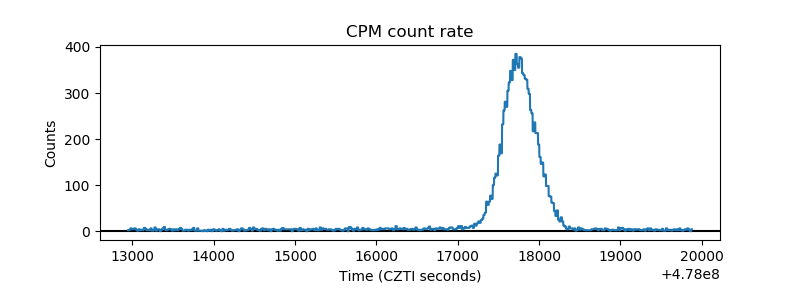 |
| CZT Counter | 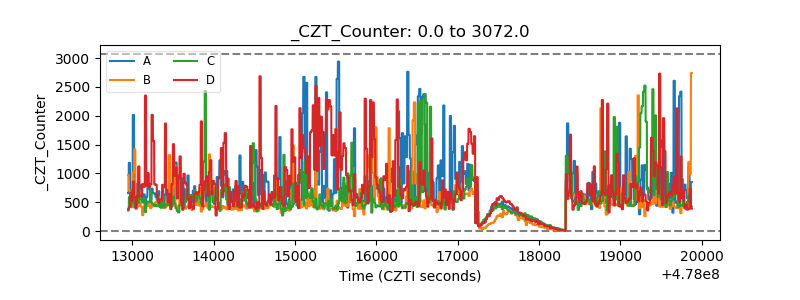 |
| +2.5 Volts monitor | 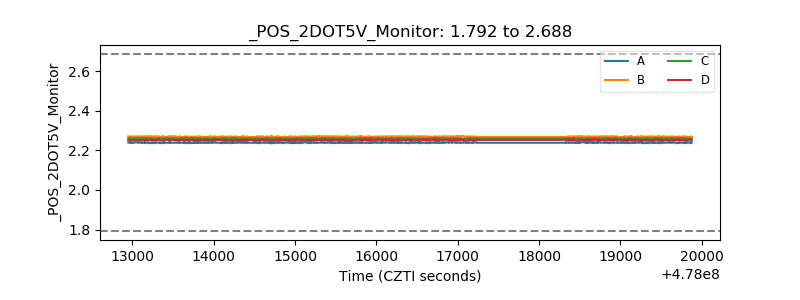 |
| +5 Volts monitor | 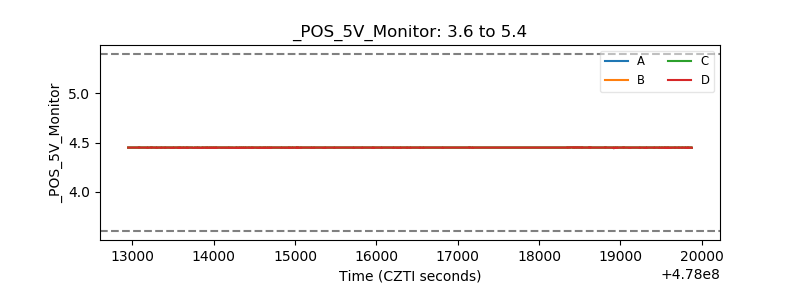 |
| _ROLL_ROT | 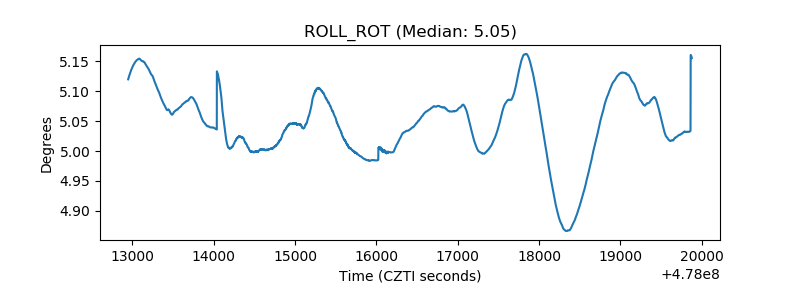 |
| _Roll_DEC | 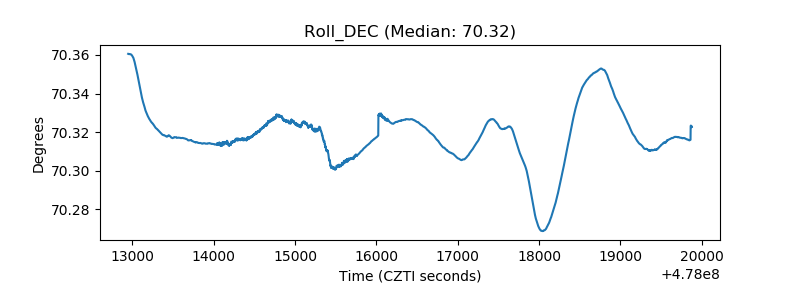 |
| _Roll_RA | 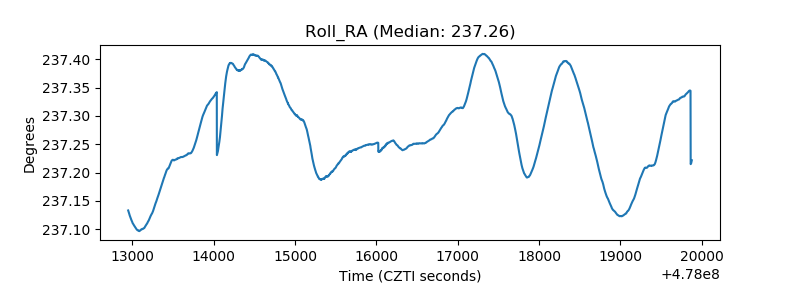 |
| Veto Counter | 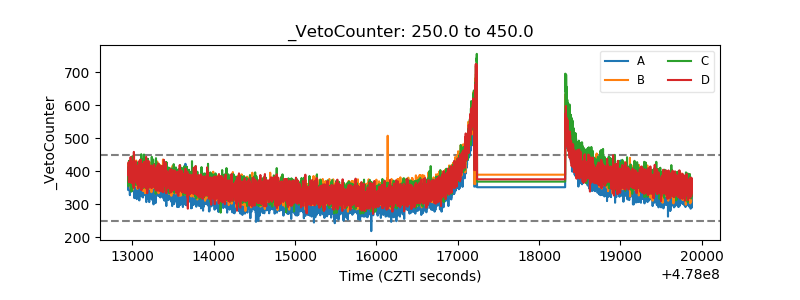 |