| Param | Original file | Final file |
|---|---|---|
| Filename | modeM0/AS1C07_001T01_9000006450_50887cztM0_level2.fits | modeM0/AS1C07_001T01_9000006450_50887cztM0_level2_quad_clean.evt |
| Size (bytes) | 682,490,880 | 92,681,280 |
| Size | 650.9 MB | 88.4 MB |
| Events in quadrant A | 9,483,406 | 504,323 |
| Events in quadrant B | 4,176,769 | 679,701 |
| Events in quadrant C | 4,747,253 | 599,870 |
| Events in quadrant D | 6,333,828 | 551,713 |
| Mode SS | |||
|---|---|---|---|
| Quadrant | BADHDUFLAG | Total packets | Discarded packets |
| A | 0 | 138 | 0 |
| B | 0 | 138 | 0 |
| C | 0 | 138 | 0 |
| D | 0 | 138 | 0 |
| Mode M0 | |||
|---|---|---|---|
| Quadrant | BADHDUFLAG | Total packets | Discarded packets |
| A | 0 | 32779 | 2 |
| B | 0 | 17070 | 1 |
| C | 0 | 18698 | 1 |
| D | 0 | 23414 | 1 |
| Mode M9 | |||
|---|---|---|---|
| Quadrant | BADHDUFLAG | Total packets | Discarded packets |
| A | 0 | 9 | 0 |
| B | 0 | 9 | 0 |
| C | 0 | 9 | 0 |
| D | 0 | 9 | 0 |
| Quadrant | Total seconds | Saturated seconds | Saturation percentage |
|---|---|---|---|
| A | 6746 | 1965 | 29.128372% |
| B | 6747 | 415 | 6.150882% |
| C | 6747 | 401 | 5.943382% |
| D | 6747 | 606 | 8.981770% |
Noise dominated data is calculated using 1-second bins in cleaned event files. If a bin has >2000 counts, and if more than 50% of those come from <1% of pixels, then it is considered to be noise-dominated and hence unusable.
| Quadrant | # 1 sec bins | Bins with >0 counts | Bins with >2000 counts | High rate bins dominated by noise | Noise dominated (total time) | Noise dominated (detector-on time) | Marked lightcurve |
|---|---|---|---|---|---|---|---|
| A | 7691 | 6747 | 1714 | 1714 | 22.29% | 25.40% | 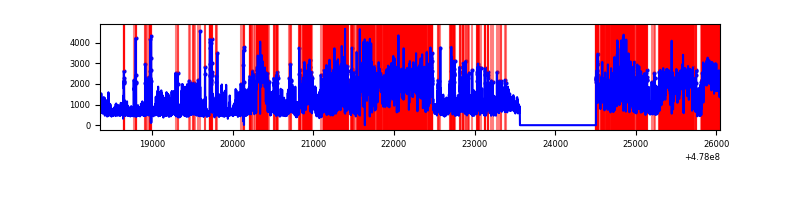 |
| B | 7692 | 6748 | 206 | 206 | 2.68% | 3.05% | 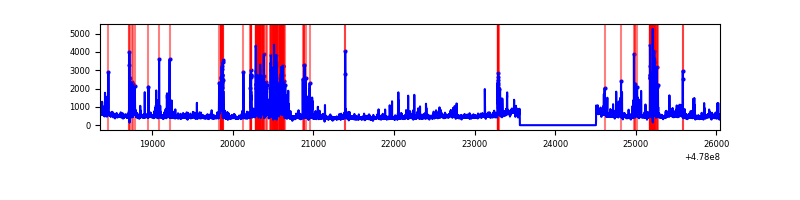 |
| C | 7692 | 6748 | 225 | 225 | 2.93% | 3.33% |  |
| D | 7692 | 6748 | 531 | 531 | 6.90% | 7.87% | 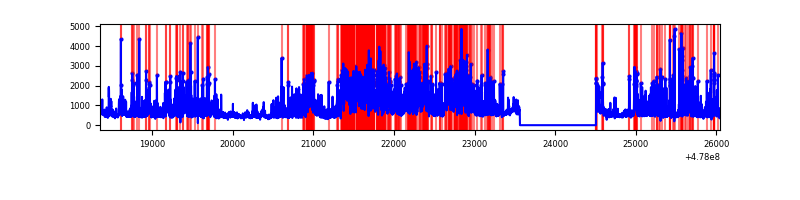 |
Top three noisy pixels from each quadrant. If the there are fewer than three noisy pixels in the level2.evt file, extra rows are filled as -1
| Pixel properties | Quadrant properties | ||||||
|---|---|---|---|---|---|---|---|
| Quadrant | DetID | PixID | Counts | Sigma | Mean | Median | Sigma |
| A | 4 | 4 | 2598210 | 15916.7 | 668 | 652 | 163.2 |
| A | 12 | 80 | 1527917 | 9358.41 | 668 | 652 | 163.2 |
| A | 3 | 63 | 930505 | 5697.73 | 668 | 652 | 163.2 |
| B | 4 | 206 | 414688 | 2718.37 | 716 | 690 | 152.3 |
| B | 8 | 128 | 411694 | 2698.71 | 716 | 690 | 152.3 |
| B | 4 | 170 | 168396 | 1101.18 | 716 | 690 | 152.3 |
| C | 1 | 29 | 698369 | 3643.75 | 705 | 698 | 191.5 |
| C | 13 | 3 | 464208 | 2420.79 | 705 | 698 | 191.5 |
| C | 12 | 247 | 199638 | 1039.01 | 705 | 698 | 191.5 |
| D | 7 | 45 | 1614601 | 8415.71 | 696 | 671 | 191.8 |
| D | 2 | 216 | 615318 | 3205.03 | 696 | 671 | 191.8 |
| D | 2 | 249 | 321876 | 1674.9 | 696 | 671 | 191.8 |
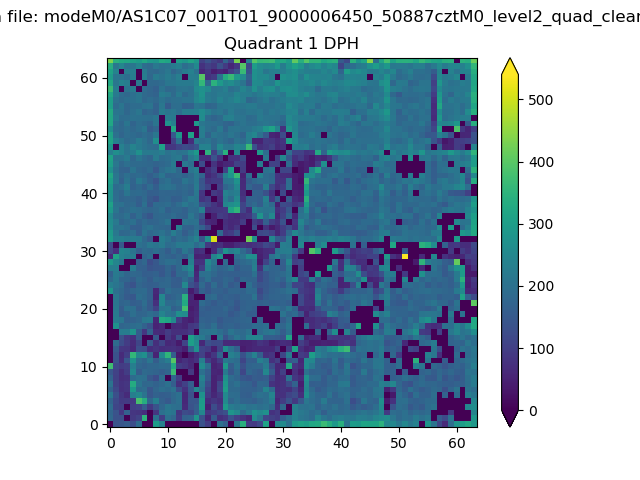
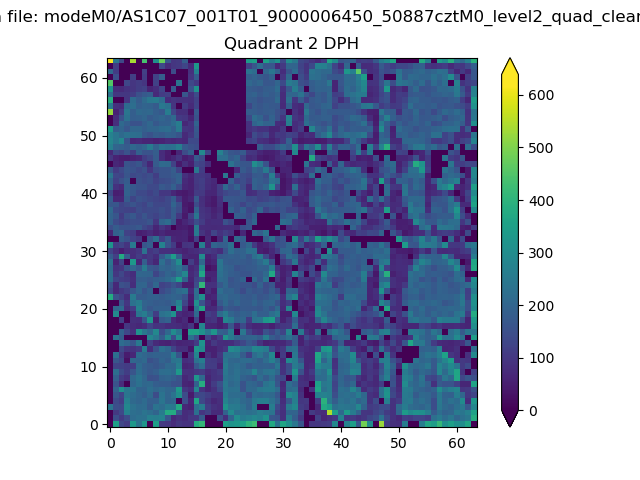
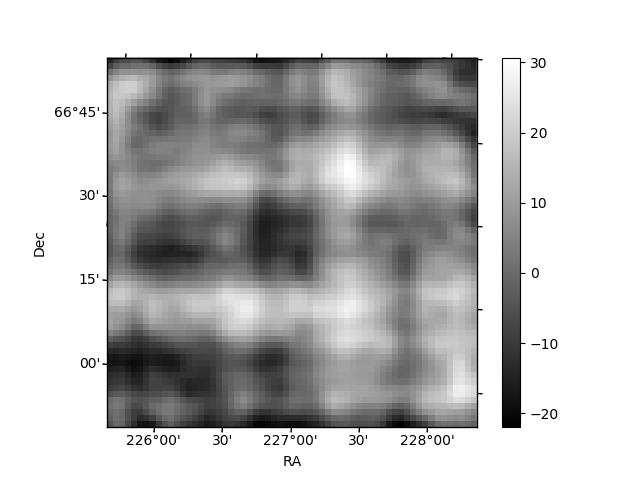
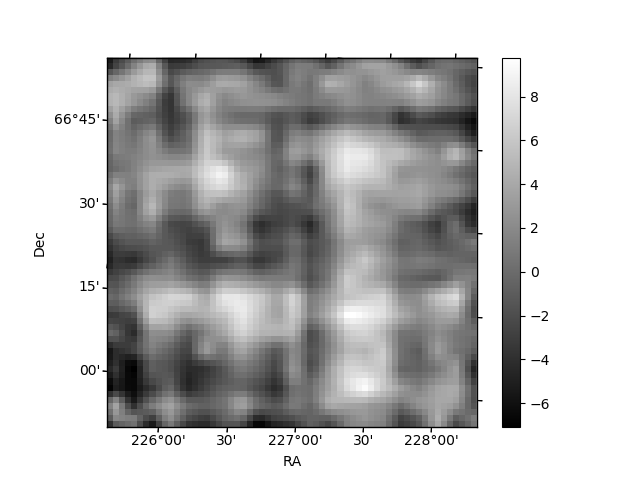
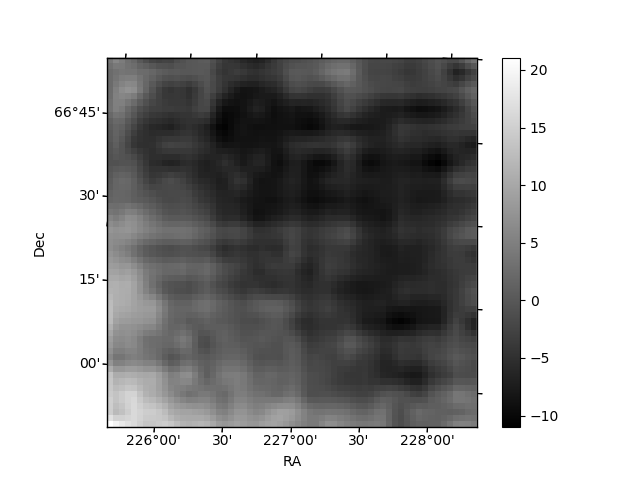
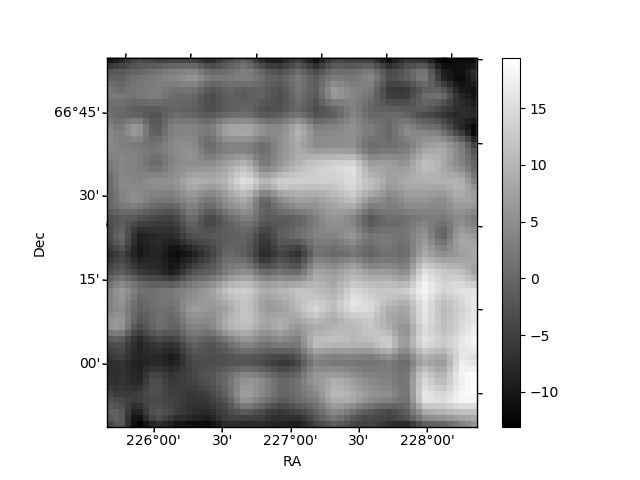
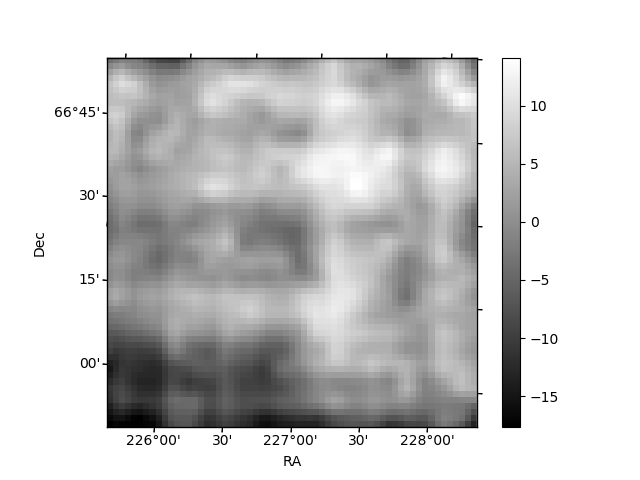
Histogram calculated using DETX and DETY for each event in the final _common_clean file
| Quadrant A | 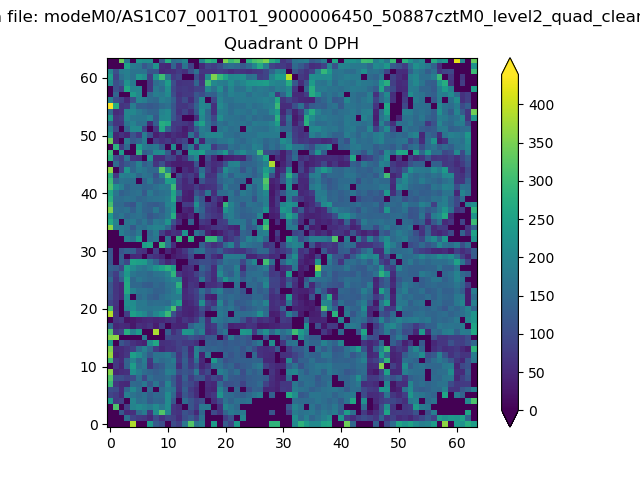 |
 |
Quadrant B |
|---|---|---|---|
| Quadrant D | 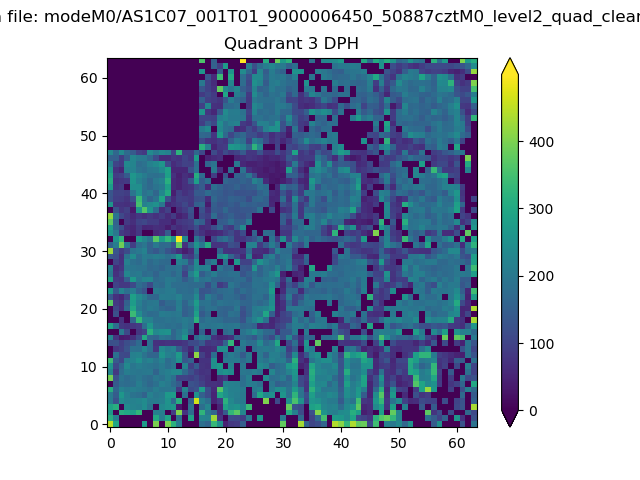 |
 |
Quadrant C |
| Plot type | Count rate plots | Images |
|---|---|---|
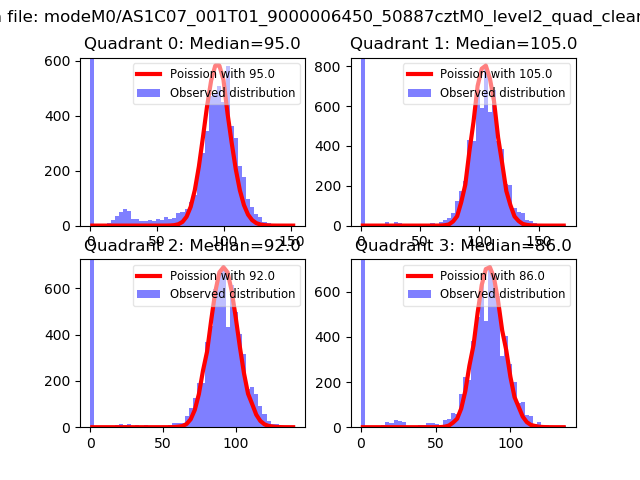
| Comparison with Poisson distribution Blue bars denote a histogram of data divided into 1 sec bins. Red curve is a Poisson curve with rate = median count rate of data. |
 |
 |
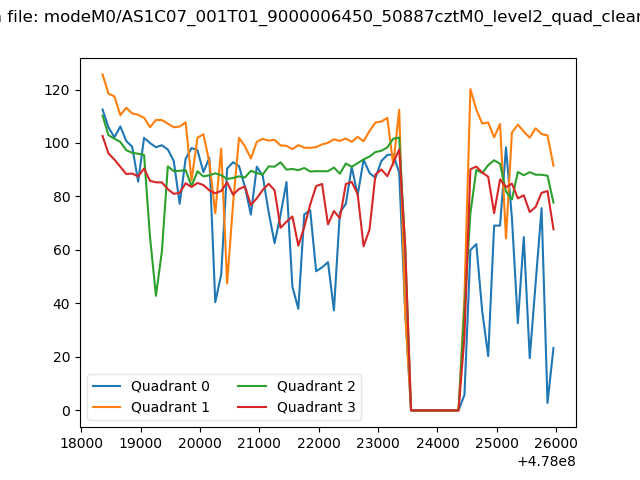
| Quadrant-wise count rates Data is divided into 100 sec bins |
 |
|
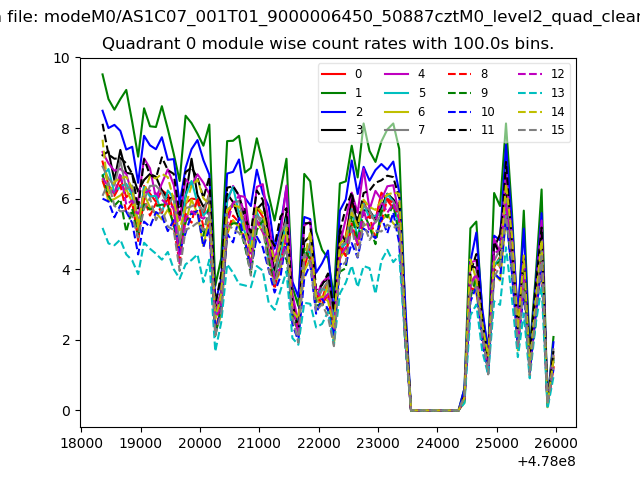
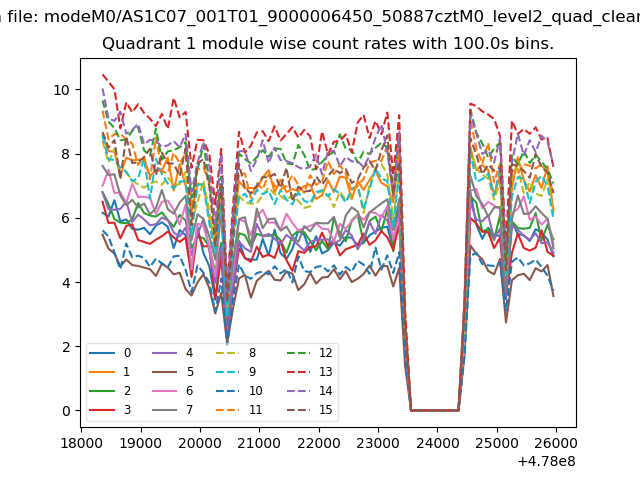
| Module-wise count rates for Quadrant A Data is divided into 100 sec bins |
 |
 |
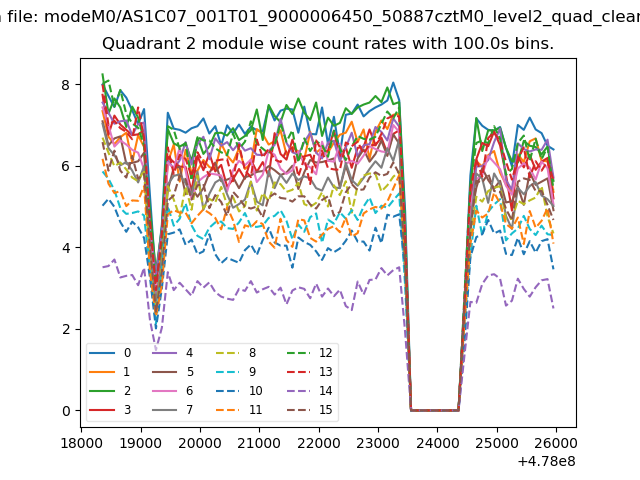
| Module-wise count rates for Quadrant B Data is divided into 100 sec bins |
 |
 |
| Module-wise count rates for Quadrant C Data is divided into 100 sec bins |
 |
 |
| Module-wise count rates for Quadrant D Data is divided into 100 sec bins |
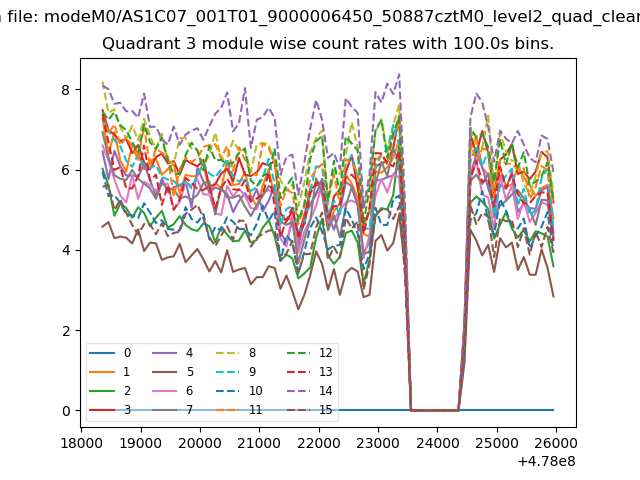 |
 |
| Parameter | Plot |
|---|---|
| CZT HV Monitor | 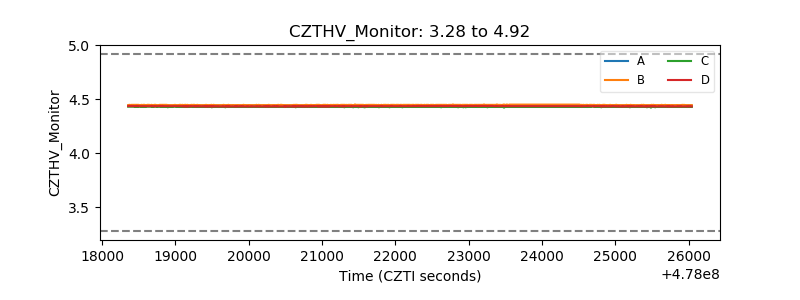 |
| D_VDD | 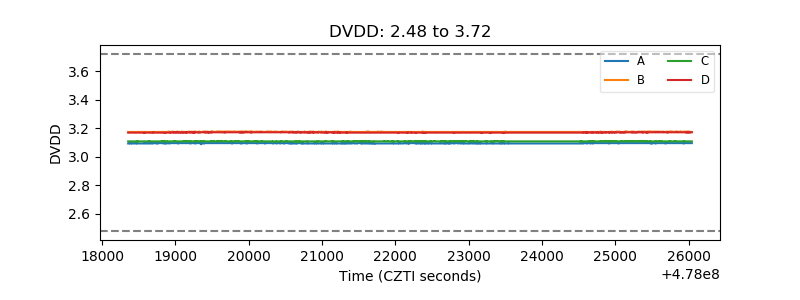 |
| Temperature 1 | 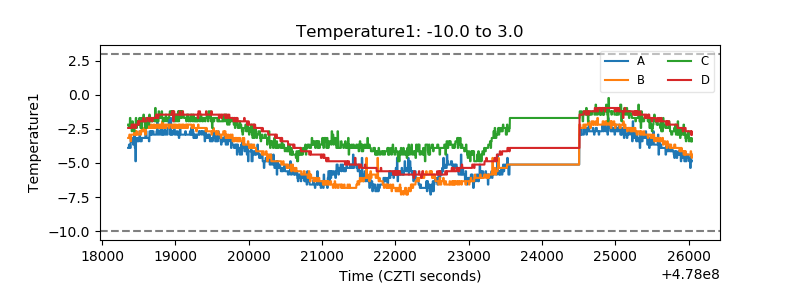 |
| Veto HV Monitor | 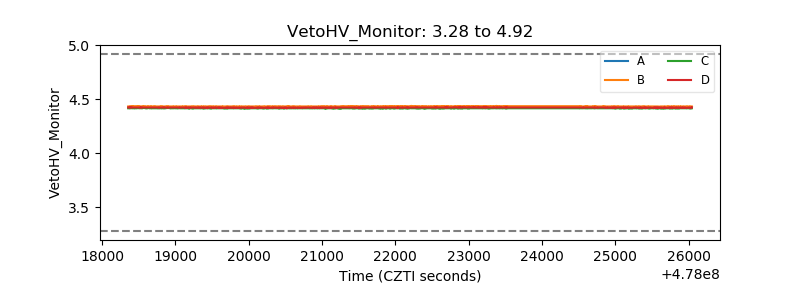 |
| Veto LLD | 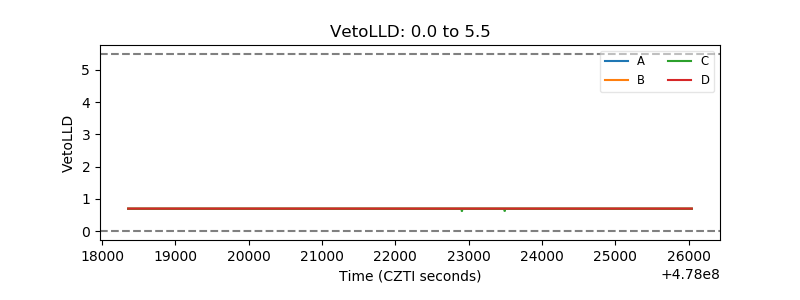 |
| Alpha Counter | 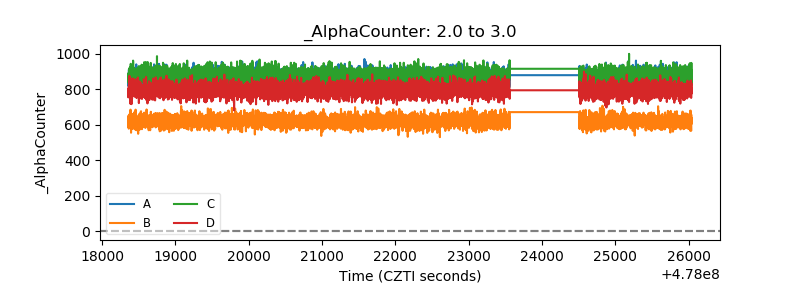 |
| _CPM_Rate | 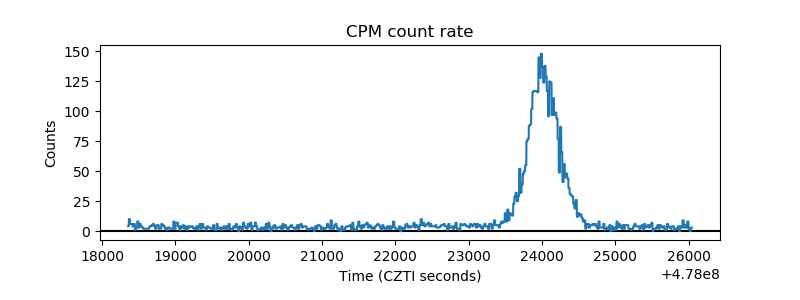 |
| CZT Counter | 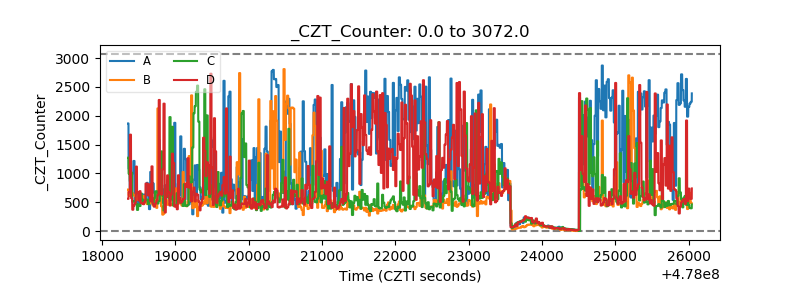 |
| +2.5 Volts monitor | 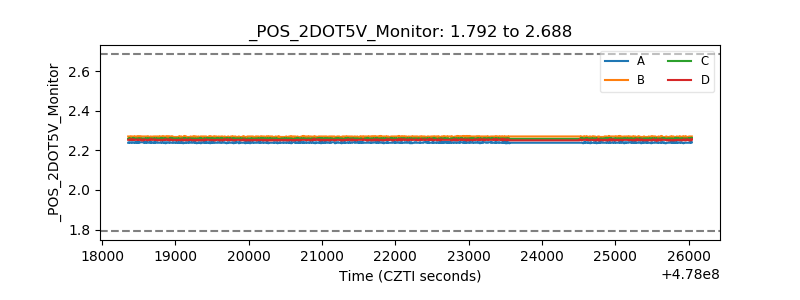 |
| +5 Volts monitor | 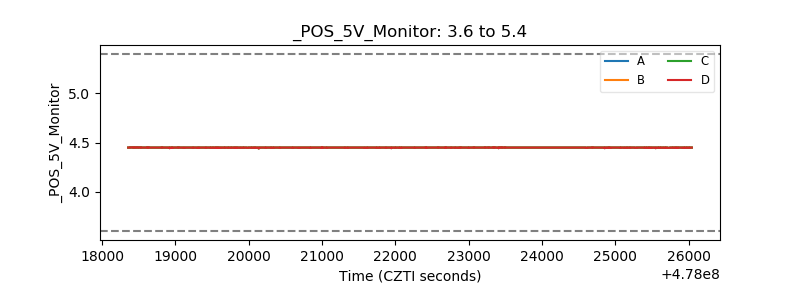 |
| _ROLL_ROT | 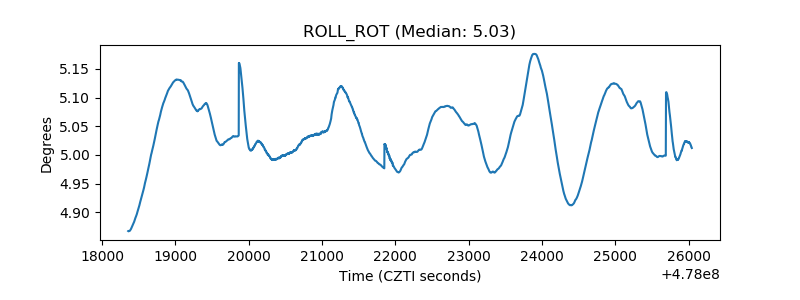 |
| _Roll_DEC | 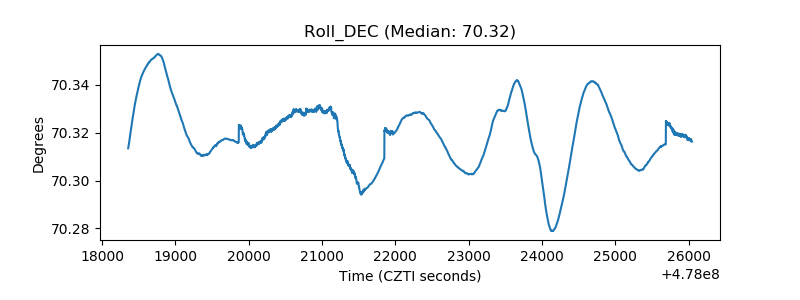 |
| _Roll_RA | 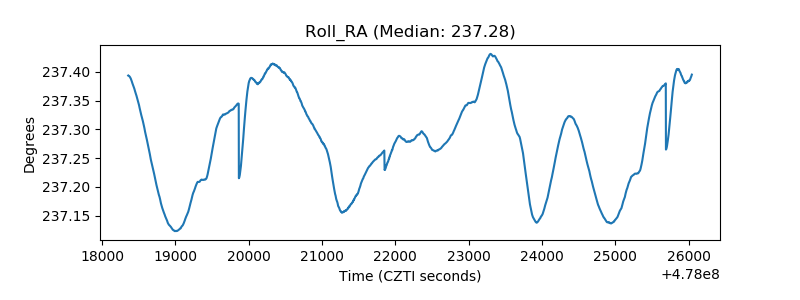 |
| Veto Counter | 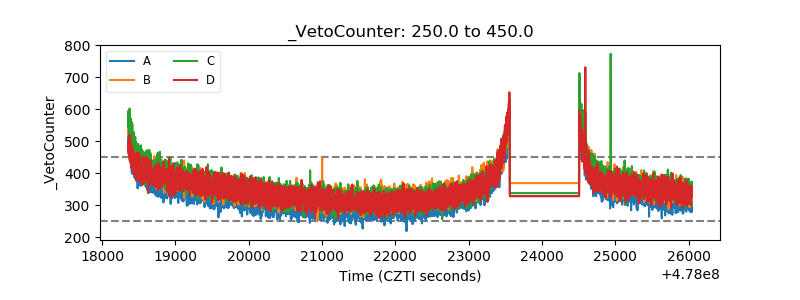 |