| Param | Original file | Final file |
|---|---|---|
| Filename | modeM0/AS1C07_001T01_9000006450_50888cztM0_level2.fits | modeM0/AS1C07_001T01_9000006450_50888cztM0_level2_quad_clean.evt |
| Size (bytes) | 759,962,880 | 82,866,240 |
| Size | 724.8 MB | 79.0 MB |
| Events in quadrant A | 9,798,016 | 466,137 |
| Events in quadrant B | 4,339,018 | 644,499 |
| Events in quadrant C | 5,706,445 | 518,714 |
| Events in quadrant D | 7,773,421 | 416,726 |
| Mode SS | |||
|---|---|---|---|
| Quadrant | BADHDUFLAG | Total packets | Discarded packets |
| A | 0 | 134 | 0 |
| B | 0 | 134 | 0 |
| C | 0 | 134 | 0 |
| D | 0 | 134 | 0 |
| Mode M0 | |||
|---|---|---|---|
| Quadrant | BADHDUFLAG | Total packets | Discarded packets |
| A | 0 | 33709 | 1 |
| B | 0 | 17589 | 1 |
| C | 0 | 21509 | 1 |
| D | 0 | 27632 | 1 |
| Mode M9 | |||
|---|---|---|---|
| Quadrant | BADHDUFLAG | Total packets | Discarded packets |
| A | 0 | 6 | 0 |
| B | 0 | 6 | 0 |
| C | 0 | 6 | 0 |
| D | 0 | 6 | 0 |
| Quadrant | Total seconds | Saturated seconds | Saturation percentage |
|---|---|---|---|
| A | 6637 | 2117 | 31.896941% |
| B | 6638 | 485 | 7.306418% |
| C | 6638 | 962 | 14.492317% |
| D | 6637 | 1967 | 29.636884% |
Noise dominated data is calculated using 1-second bins in cleaned event files. If a bin has >2000 counts, and if more than 50% of those come from <1% of pixels, then it is considered to be noise-dominated and hence unusable.
| Quadrant | # 1 sec bins | Bins with >0 counts | Bins with >2000 counts | High rate bins dominated by noise | Noise dominated (total time) | Noise dominated (detector-on time) | Marked lightcurve |
|---|---|---|---|---|---|---|---|
| A | 7192 | 6638 | 1928 | 1928 | 26.81% | 29.04% | 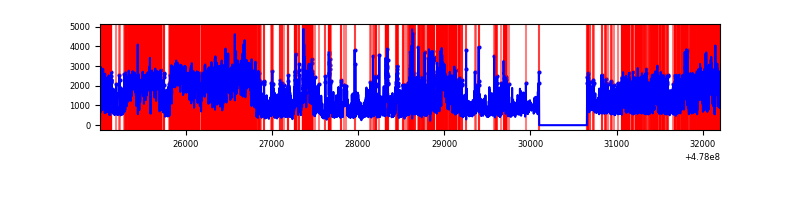 |
| B | 7193 | 6639 | 279 | 279 | 3.88% | 4.20% | 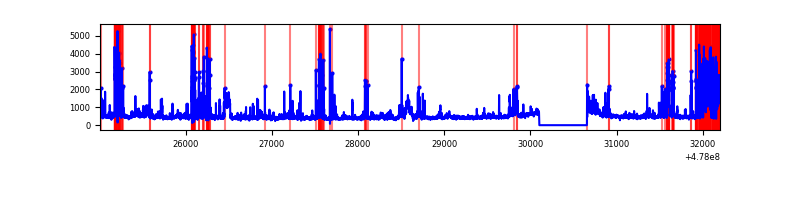 |
| C | 7193 | 6639 | 633 | 633 | 8.80% | 9.53% | 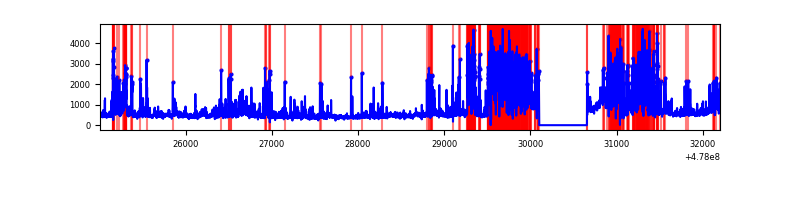 |
| D | 7192 | 6637 | 1165 | 1165 | 16.20% | 17.55% | 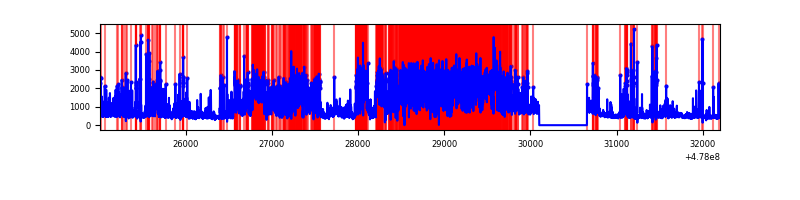 |
Top three noisy pixels from each quadrant. If the there are fewer than three noisy pixels in the level2.evt file, extra rows are filled as -1
| Pixel properties | Quadrant properties | ||||||
|---|---|---|---|---|---|---|---|
| Quadrant | DetID | PixID | Counts | Sigma | Mean | Median | Sigma |
| A | 4 | 4 | 3557973 | 22552.34 | 636 | 622 | 157.7 |
| A | 12 | 80 | 1524331 | 9659.77 | 636 | 622 | 157.7 |
| A | 7 | 206 | 1104054 | 6995.36 | 636 | 622 | 157.7 |
| B | 4 | 206 | 602213 | 4150.28 | 681 | 657 | 144.9 |
| B | 8 | 128 | 553823 | 3816.43 | 681 | 657 | 144.9 |
| B | 3 | 249 | 107732 | 738.74 | 681 | 657 | 144.9 |
| C | 1 | 29 | 1074476 | 6135.36 | 639 | 634 | 175.0 |
| C | 1 | 124 | 849886 | 4852.17 | 639 | 634 | 175.0 |
| C | 13 | 3 | 423181 | 2414.21 | 639 | 634 | 175.0 |
| D | 7 | 45 | 3591508 | 21417.27 | 600 | 579 | 167.7 |
| D | 10 | 181 | 601869 | 3586.25 | 600 | 579 | 167.7 |
| D | 2 | 249 | 247385 | 1472.01 | 600 | 579 | 167.7 |
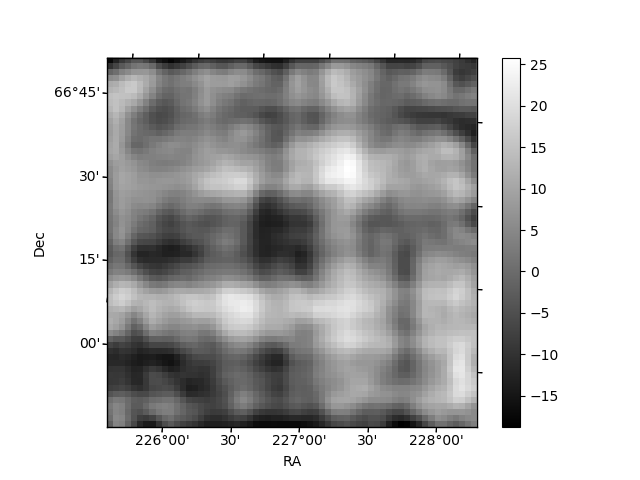
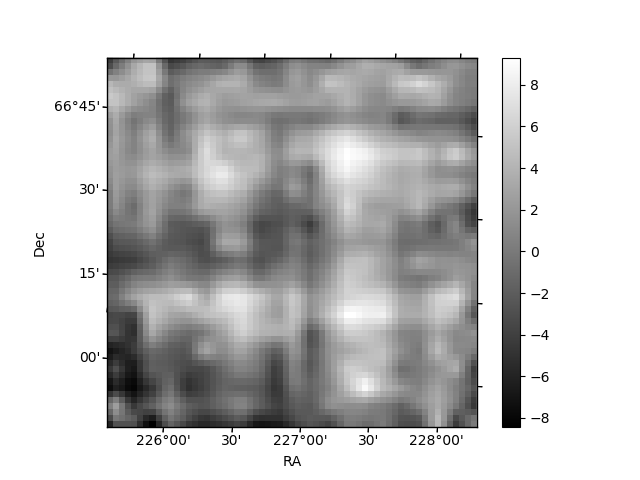
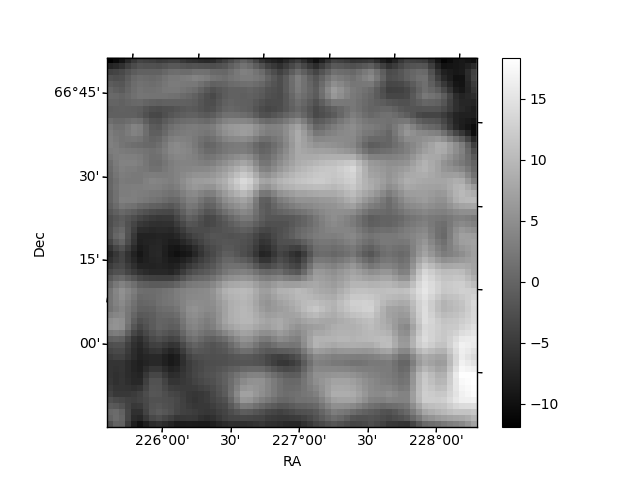
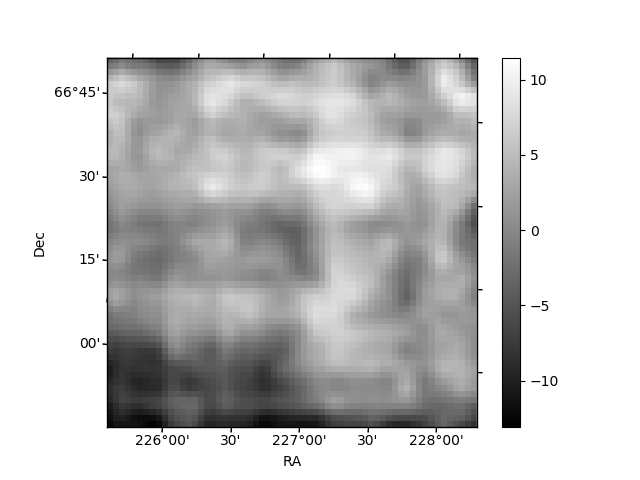
Histogram calculated using DETX and DETY for each event in the final _common_clean file
| Quadrant A | 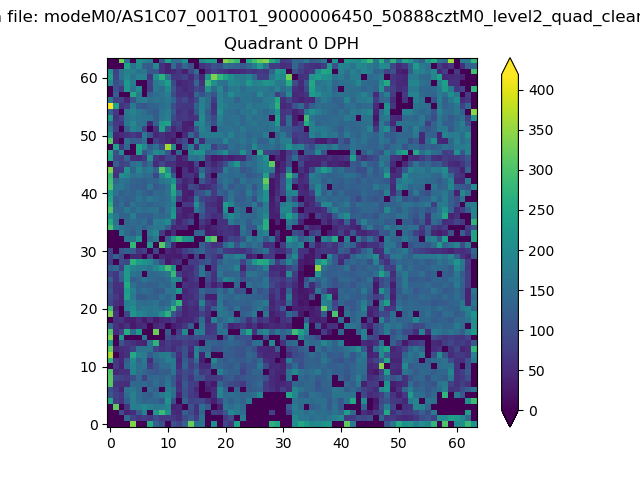 |
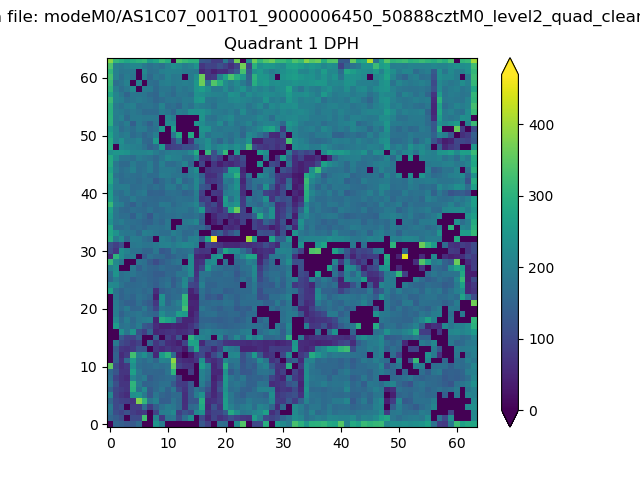 |
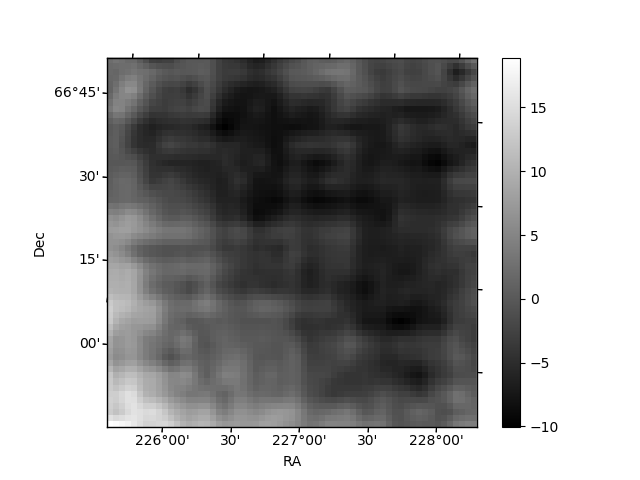
Quadrant B |
|---|---|---|---|
| Quadrant D | 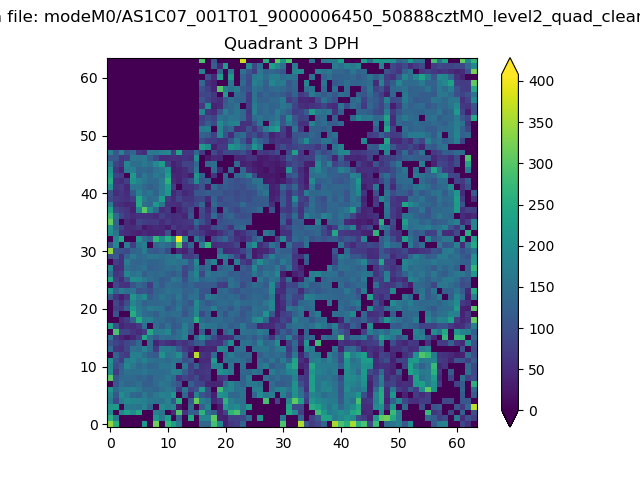 |
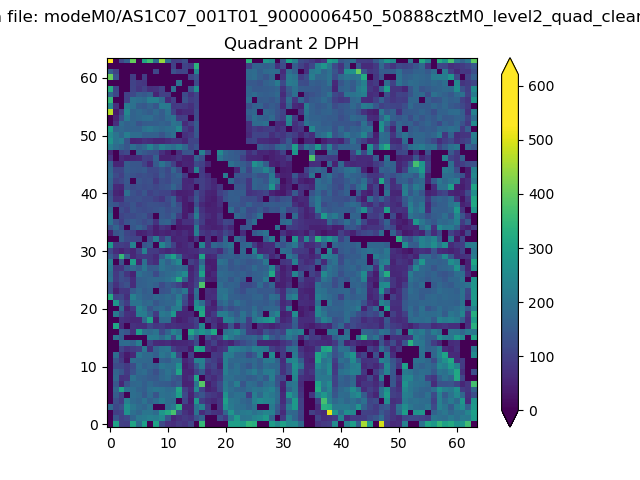 |
Quadrant C |
| Plot type | Count rate plots | Images |
|---|---|---|
| Comparison with Poisson distribution Blue bars denote a histogram of data divided into 1 sec bins. Red curve is a Poisson curve with rate = median count rate of data. |
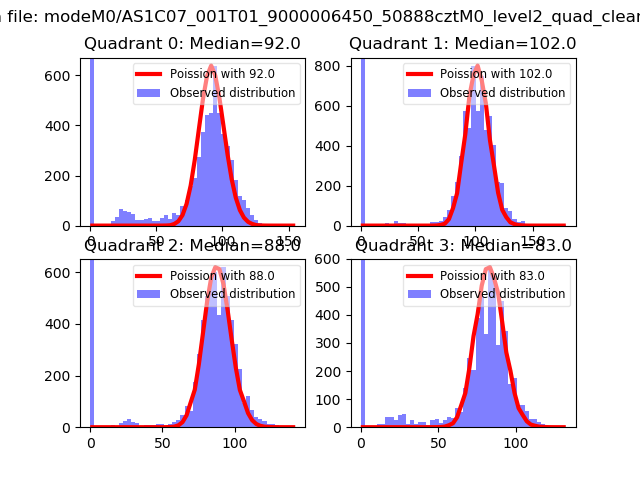 |
 |
| Quadrant-wise count rates Data is divided into 100 sec bins |
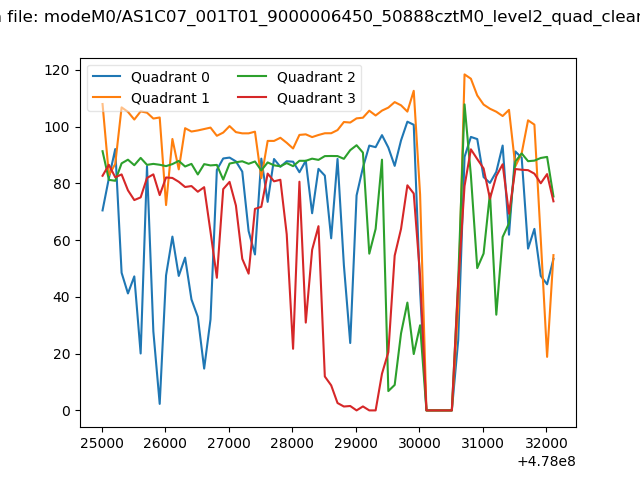 |
|
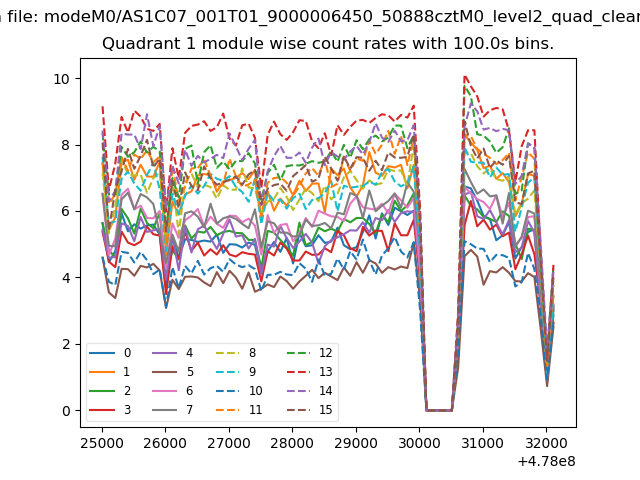
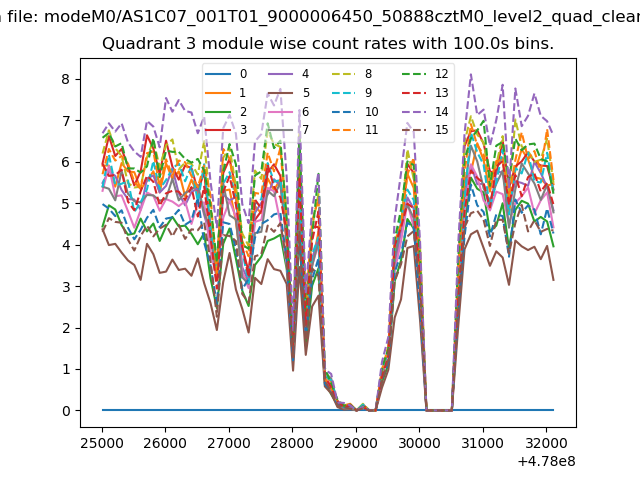
| Module-wise count rates for Quadrant A Data is divided into 100 sec bins |
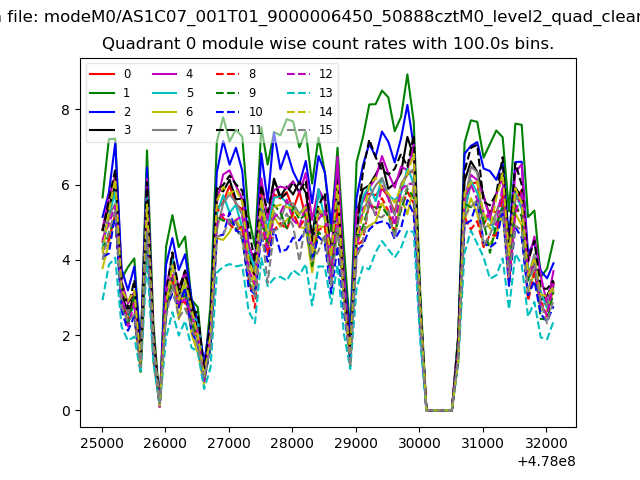 |
 |
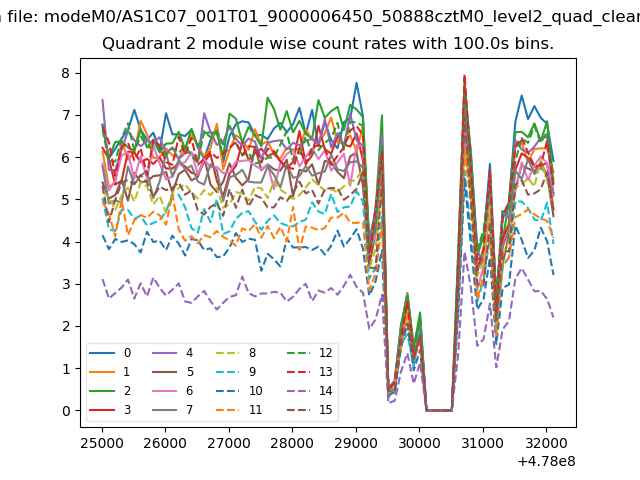
| Module-wise count rates for Quadrant B Data is divided into 100 sec bins |
 |
 |
| Module-wise count rates for Quadrant C Data is divided into 100 sec bins |
 |
 |
| Module-wise count rates for Quadrant D Data is divided into 100 sec bins |
 |
 |
| Parameter | Plot |
|---|---|
| CZT HV Monitor | 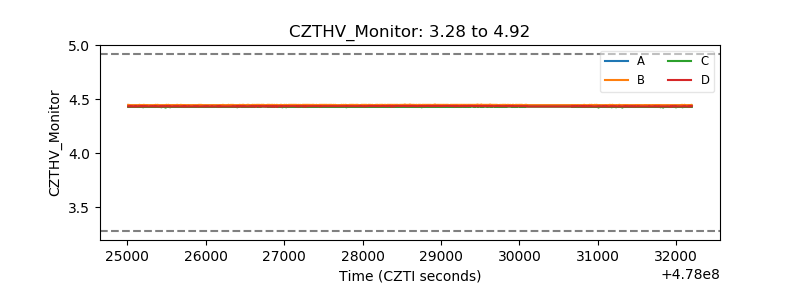 |
| D_VDD |  |
| Temperature 1 | 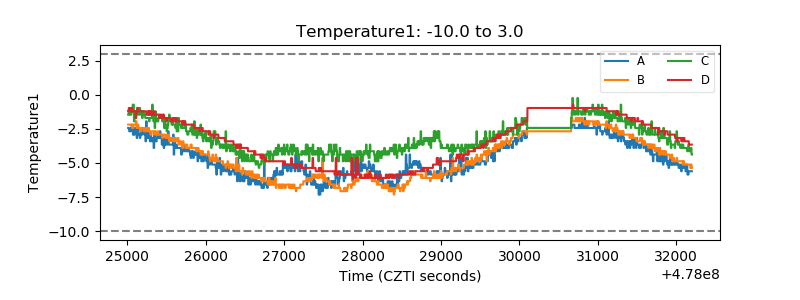 |
| Veto HV Monitor | 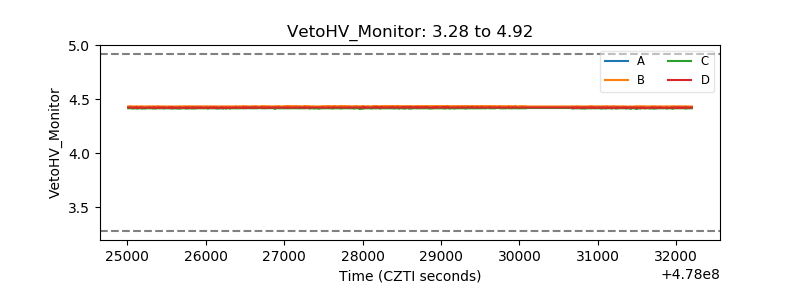 |
| Veto LLD | 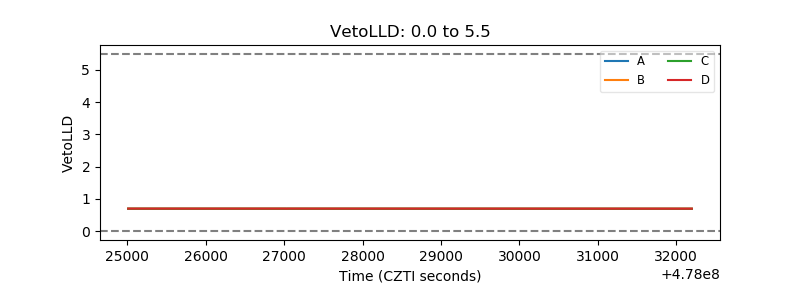 |
| Alpha Counter | 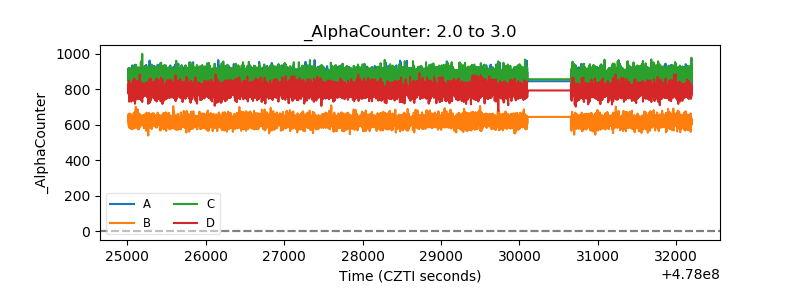 |
| _CPM_Rate | 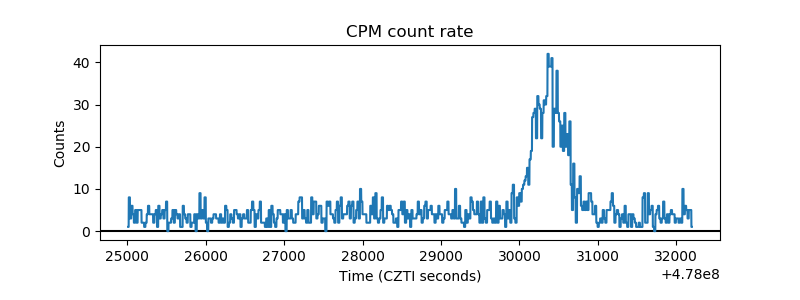 |
| CZT Counter | 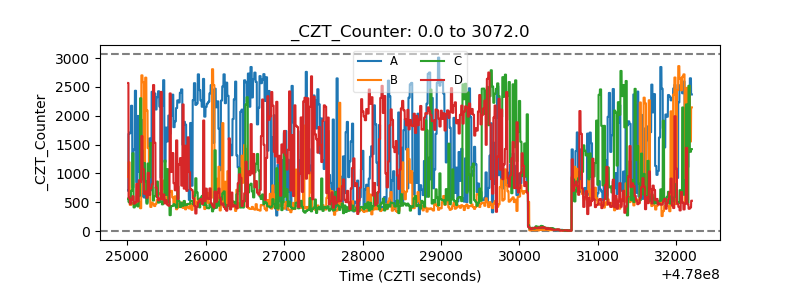 |
| +2.5 Volts monitor | 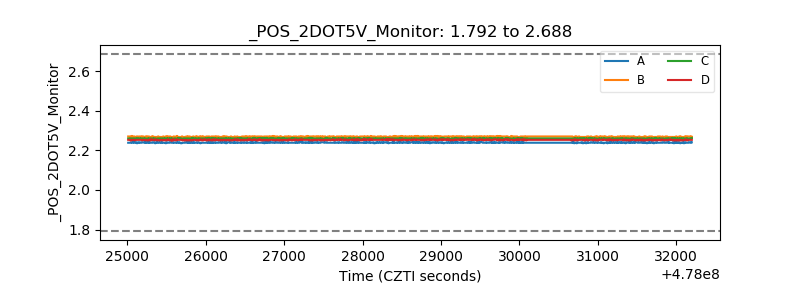 |
| +5 Volts monitor |  |
| _ROLL_ROT | 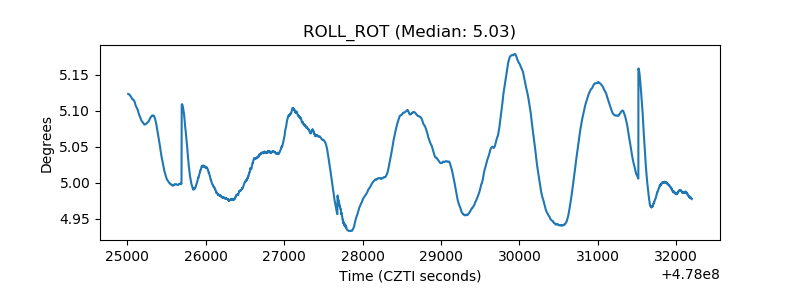 |
| _Roll_DEC | 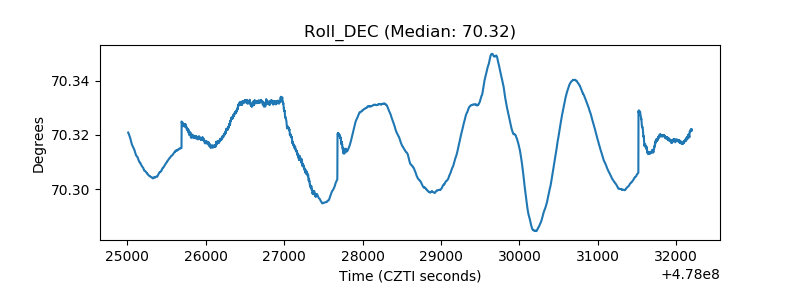 |
| _Roll_RA | 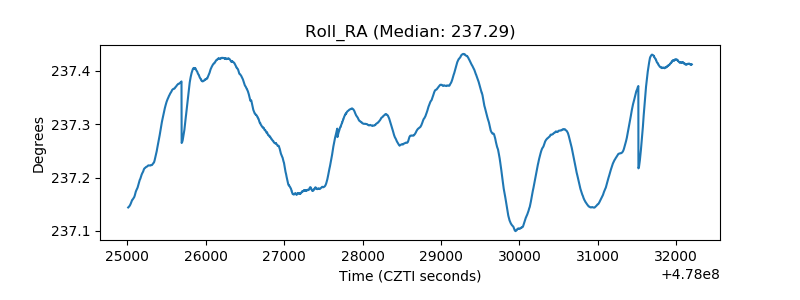 |
| Veto Counter | 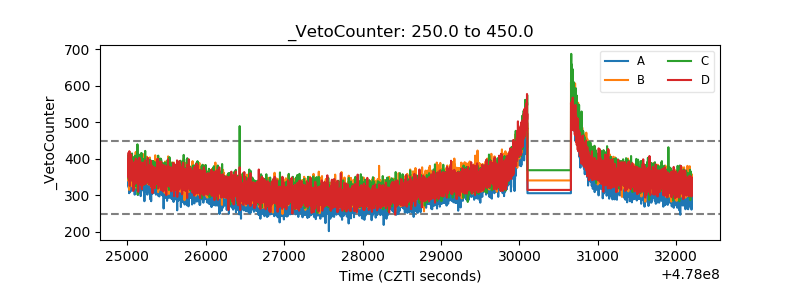 |