| Param | Original file | Final file |
|---|---|---|
| Filename | modeM0/AS1C07_001T01_9000006450_50889cztM0_level2.fits | modeM0/AS1C07_001T01_9000006450_50889cztM0_level2_quad_clean.evt |
| Size (bytes) | 819,417,600 | 103,631,040 |
| Size | 781.5 MB | 98.8 MB |
| Events in quadrant A | 10,187,029 | 630,654 |
| Events in quadrant B | 5,055,791 | 776,209 |
| Events in quadrant C | 7,198,393 | 625,573 |
| Events in quadrant D | 7,285,227 | 560,714 |
| Mode SS | |||
|---|---|---|---|
| Quadrant | BADHDUFLAG | Total packets | Discarded packets |
| A | 0 | 156 | 0 |
| B | 0 | 156 | 0 |
| C | 0 | 156 | 0 |
| D | 0 | 156 | 0 |
| Mode M0 | |||
|---|---|---|---|
| Quadrant | BADHDUFLAG | Total packets | Discarded packets |
| A | 0 | 35730 | 1 |
| B | 0 | 20464 | 1 |
| C | 0 | 26873 | 1 |
| D | 0 | 27082 | 4 |
| Mode M9 | |||
|---|---|---|---|
| Quadrant | BADHDUFLAG | Total packets | Discarded packets |
| A | 0 | 1 | 0 |
| B | 0 | 2 | 0 |
| C | 0 | 2 | 0 |
| D | 0 | 2 | 0 |
| Quadrant | Total seconds | Saturated seconds | Saturation percentage |
|---|---|---|---|
| A | 7826 | 1704 | 21.773575% |
| B | 7826 | 466 | 5.954511% |
| C | 7826 | 1174 | 15.001278% |
| D | 7825 | 1463 | 18.696486% |
Noise dominated data is calculated using 1-second bins in cleaned event files. If a bin has >2000 counts, and if more than 50% of those come from <1% of pixels, then it is considered to be noise-dominated and hence unusable.
| Quadrant | # 1 sec bins | Bins with >0 counts | Bins with >2000 counts | High rate bins dominated by noise | Noise dominated (total time) | Noise dominated (detector-on time) | Marked lightcurve |
|---|---|---|---|---|---|---|---|
| A | 7826 | 7826 | 1468 | 1468 | 18.76% | 18.76% | 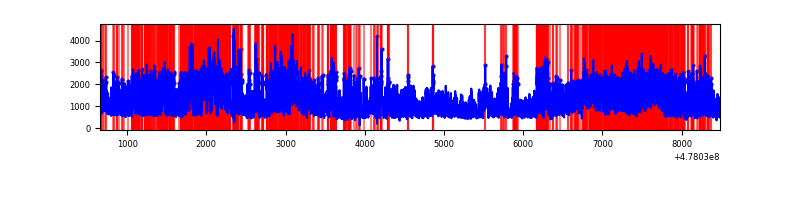 |
| B | 7826 | 7826 | 279 | 279 | 3.57% | 3.57% | 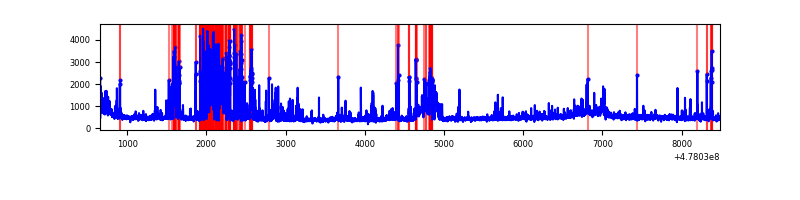 |
| C | 7826 | 7824 | 777 | 777 | 9.93% | 9.93% | 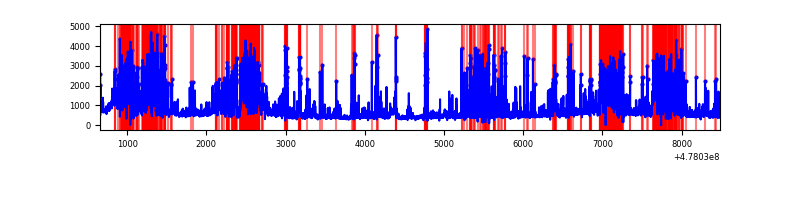 |
| D | 7825 | 7821 | 570 | 570 | 7.28% | 7.29% | 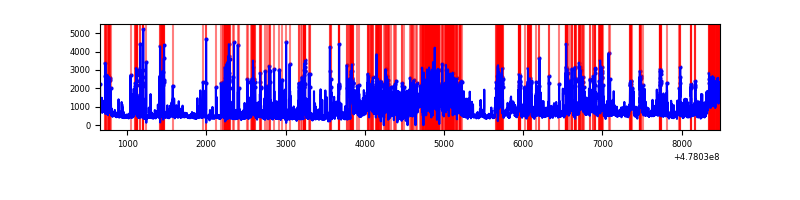 |
Top three noisy pixels from each quadrant. If the there are fewer than three noisy pixels in the level2.evt file, extra rows are filled as -1
| Pixel properties | Quadrant properties | ||||||
|---|---|---|---|---|---|---|---|
| Quadrant | DetID | PixID | Counts | Sigma | Mean | Median | Sigma |
| A | 4 | 4 | 5189555 | 26106.65 | 796 | 777 | 198.8 |
| A | 7 | 206 | 655780 | 3295.56 | 796 | 777 | 198.8 |
| A | 4 | 3 | 292602 | 1468.28 | 796 | 777 | 198.8 |
| B | 4 | 206 | 864806 | 4876.31 | 827 | 798 | 177.2 |
| B | 0 | 171 | 289416 | 1628.91 | 827 | 798 | 177.2 |
| B | 8 | 128 | 113708 | 637.24 | 827 | 798 | 177.2 |
| C | 1 | 29 | 2126644 | 10061.76 | 770 | 764 | 211.3 |
| C | 1 | 124 | 946111 | 4474.31 | 770 | 764 | 211.3 |
| C | 12 | 247 | 370782 | 1751.29 | 770 | 764 | 211.3 |
| D | 7 | 45 | 1837964 | 8778.23 | 753 | 727 | 209.3 |
| D | 2 | 249 | 470128 | 2242.77 | 753 | 727 | 209.3 |
| D | 1 | 47 | 319637 | 1523.73 | 753 | 727 | 209.3 |
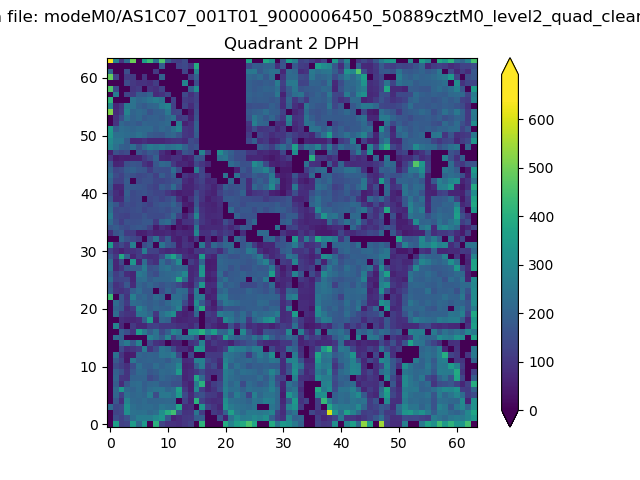
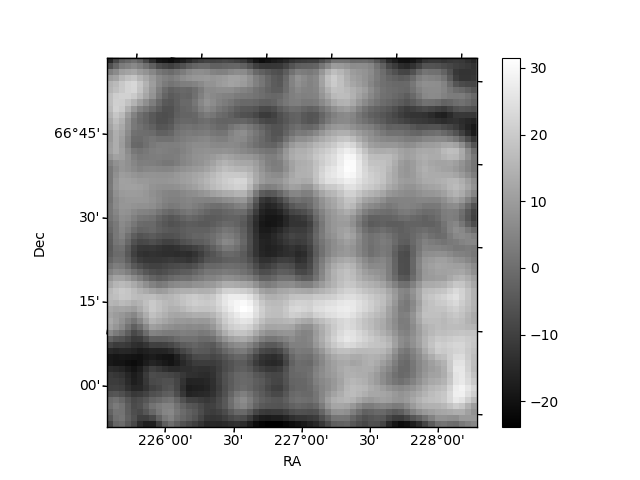
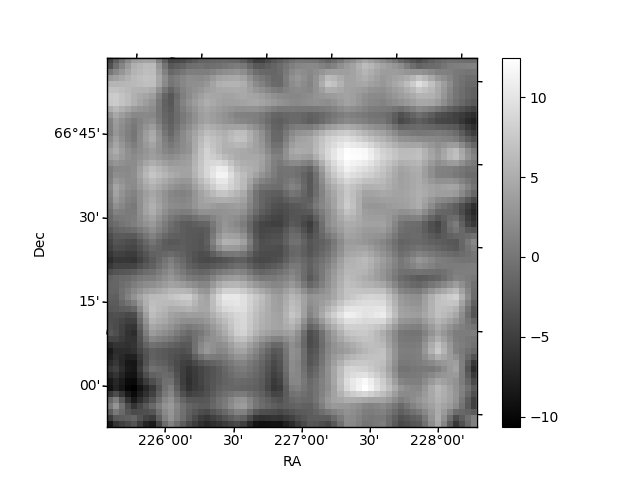
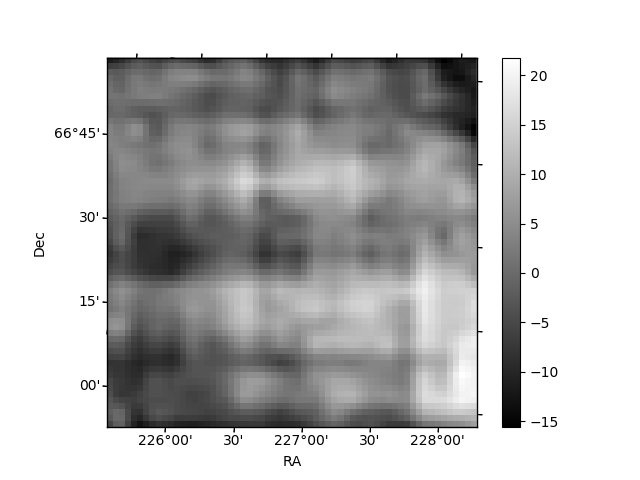
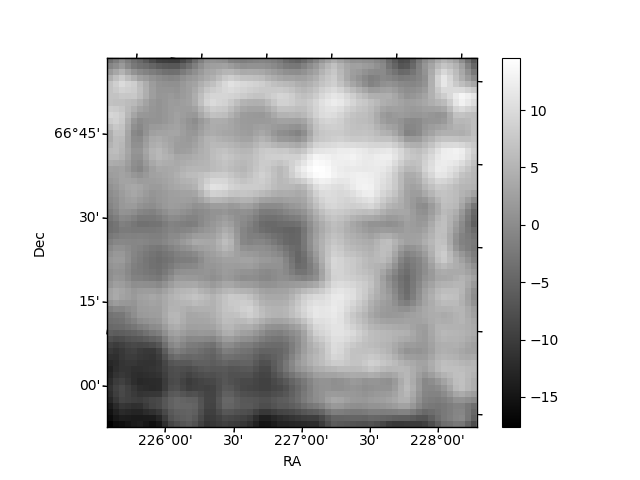
Histogram calculated using DETX and DETY for each event in the final _common_clean file
| Quadrant A | 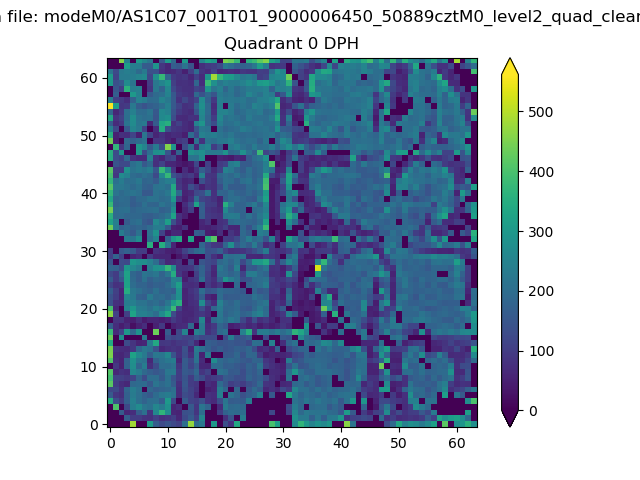 |
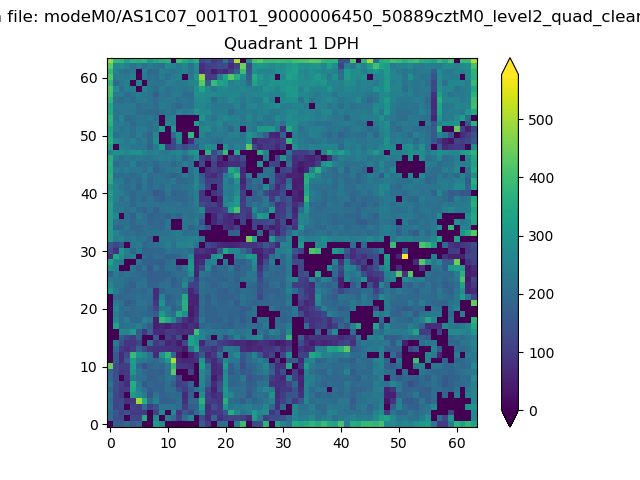 |
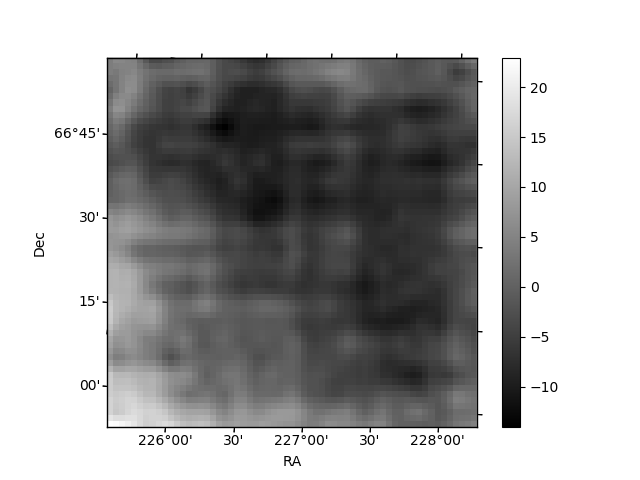
Quadrant B |
|---|---|---|---|
| Quadrant D | 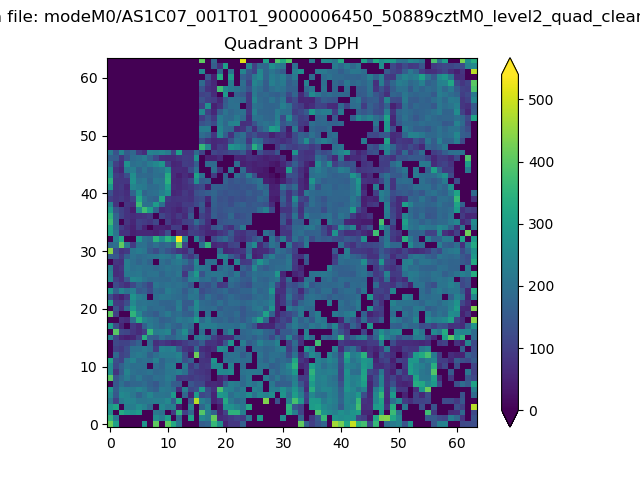 |
 |
Quadrant C |
| Plot type | Count rate plots | Images |
|---|---|---|
| Comparison with Poisson distribution Blue bars denote a histogram of data divided into 1 sec bins. Red curve is a Poisson curve with rate = median count rate of data. |
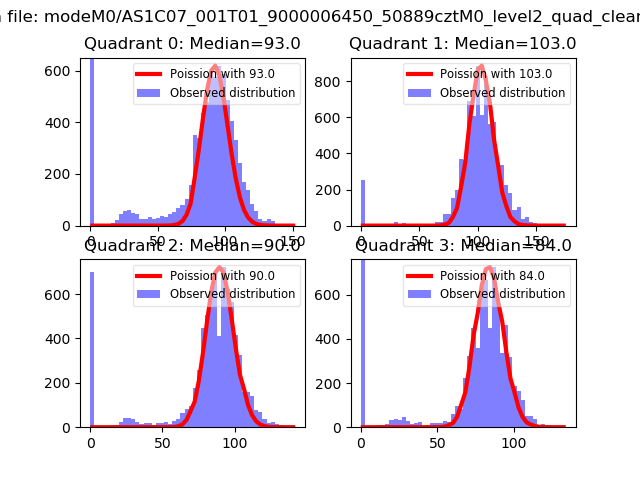 |
 |
| Quadrant-wise count rates Data is divided into 100 sec bins |
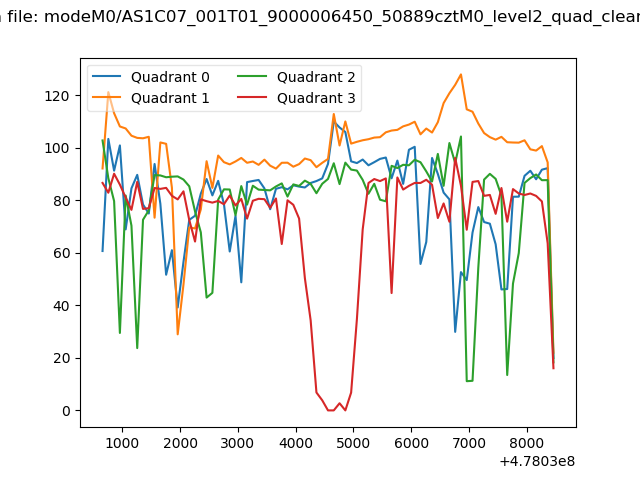 |
|
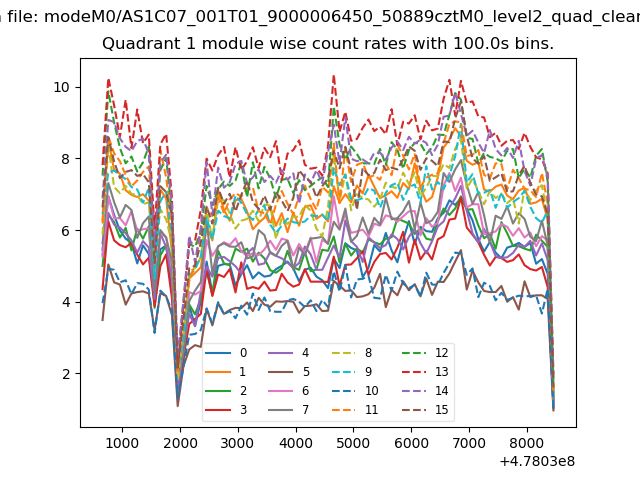
| Module-wise count rates for Quadrant A Data is divided into 100 sec bins |
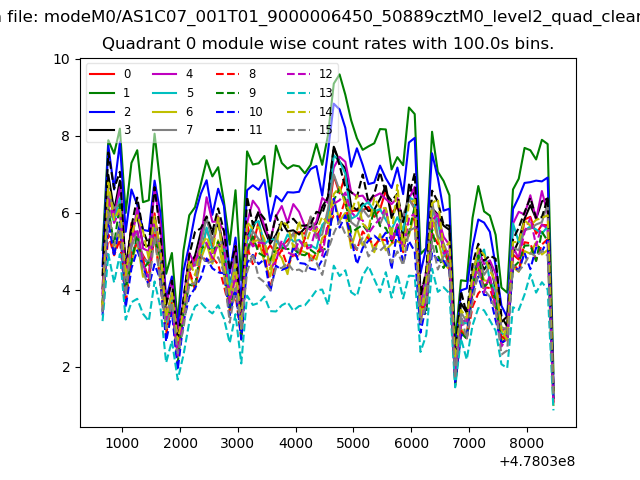 |
 |
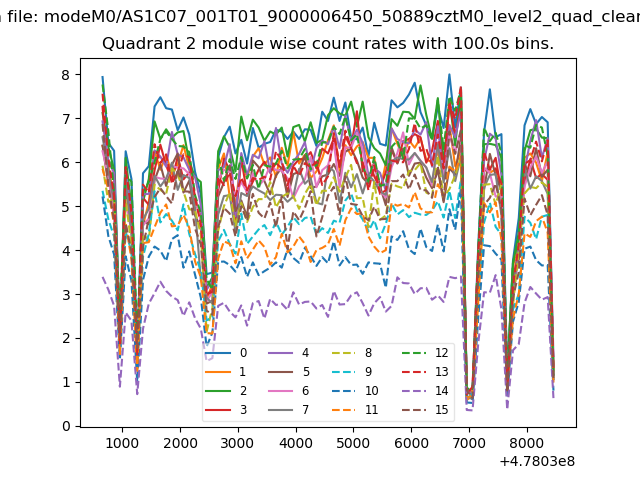
| Module-wise count rates for Quadrant B Data is divided into 100 sec bins |
 |
 |
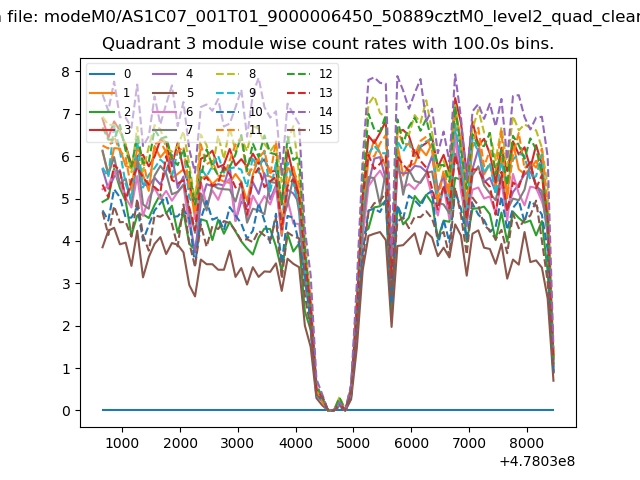
| Module-wise count rates for Quadrant C Data is divided into 100 sec bins |
 |
 |
| Module-wise count rates for Quadrant D Data is divided into 100 sec bins |
 |
 |
| Parameter | Plot |
|---|---|
| CZT HV Monitor | 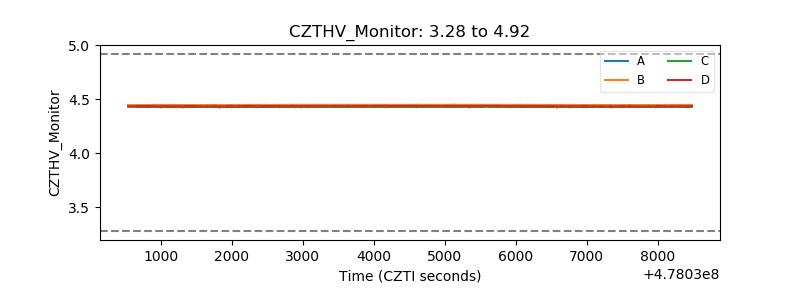 |
| D_VDD | 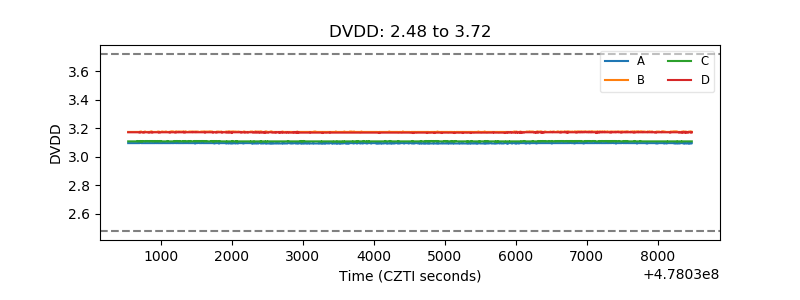 |
| Temperature 1 | 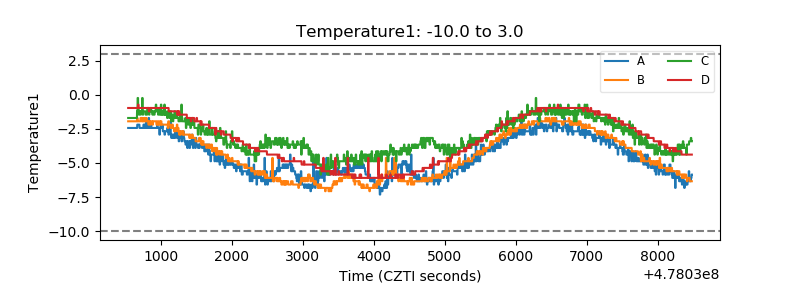 |
| Veto HV Monitor | 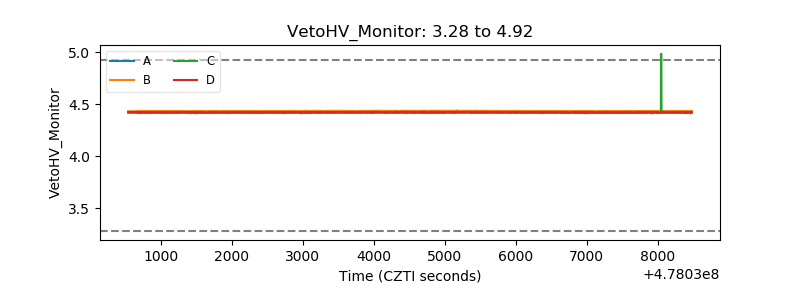 |
| Veto LLD | 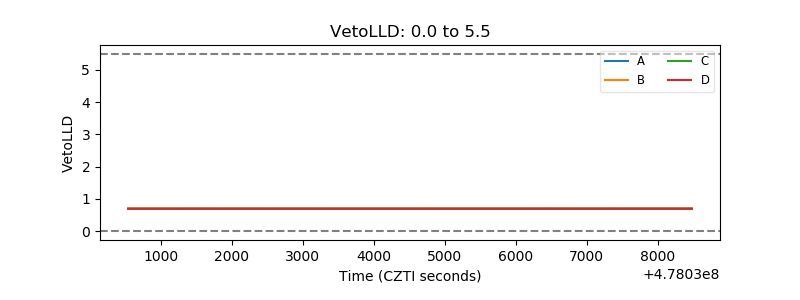 |
| Alpha Counter | 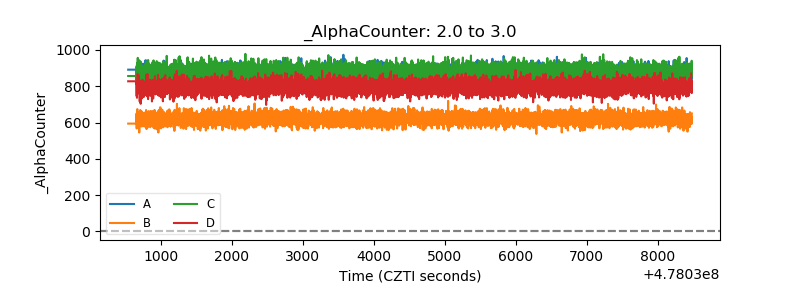 |
| _CPM_Rate | 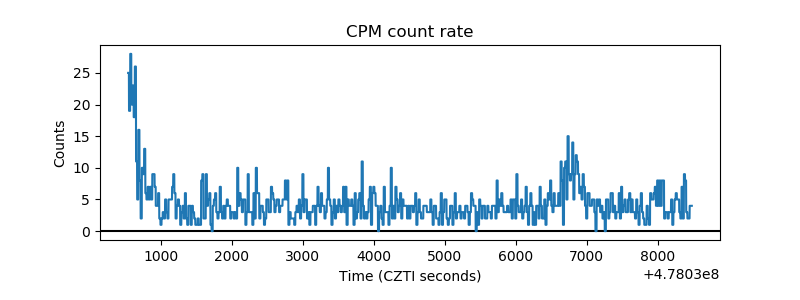 |
| CZT Counter | 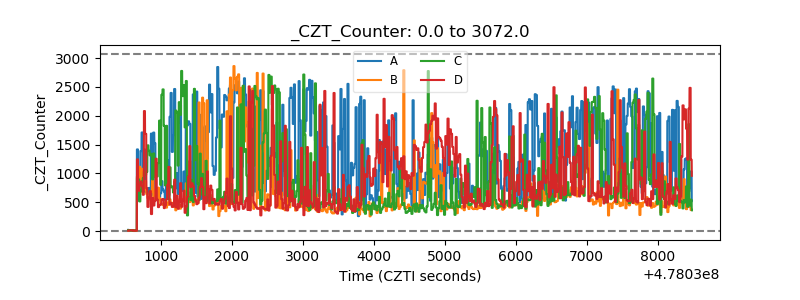 |
| +2.5 Volts monitor | 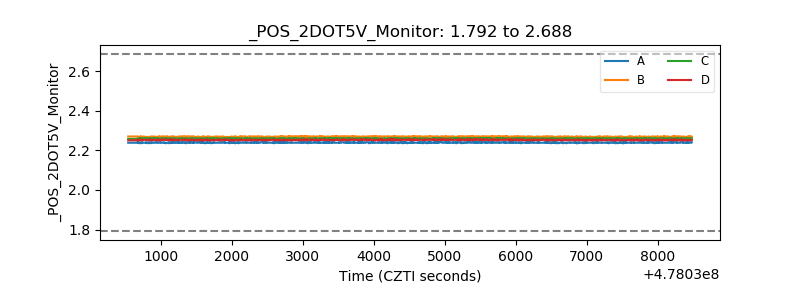 |
| +5 Volts monitor | 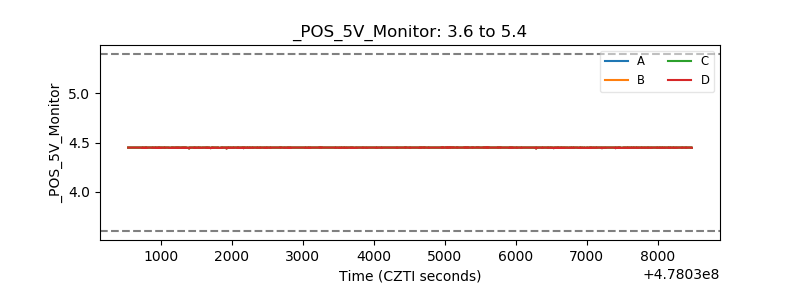 |
| _ROLL_ROT | 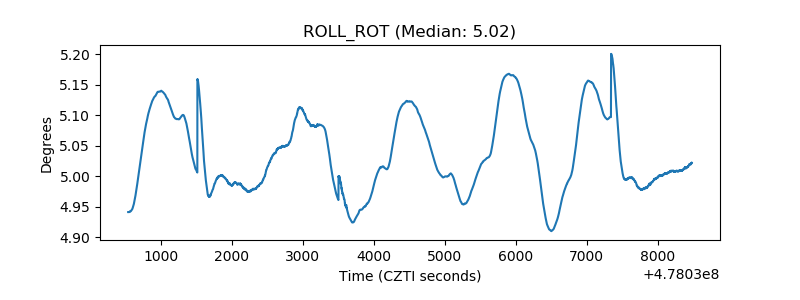 |
| _Roll_DEC | 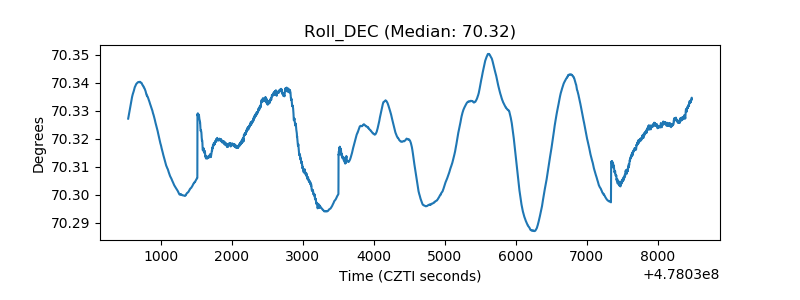 |
| _Roll_RA | 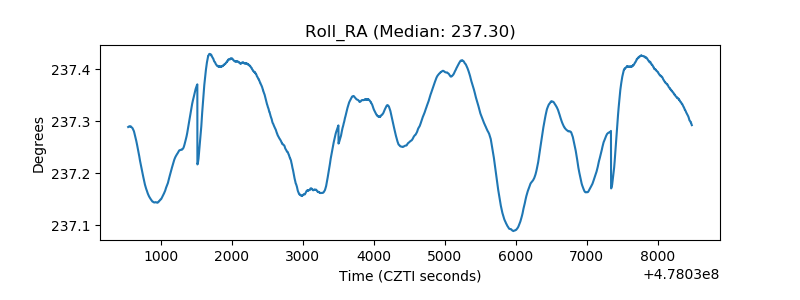 |
| Veto Counter | 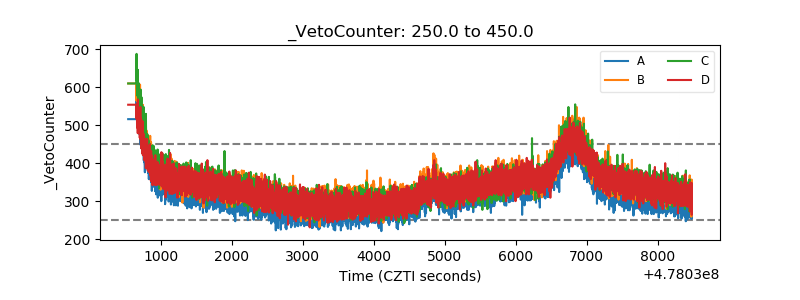 |