| Param | Original file | Final file |
|---|---|---|
| Filename | modeM0/AS1C07_001T01_9000006450_50890cztM0_level2.fits | modeM0/AS1C07_001T01_9000006450_50890cztM0_level2_quad_clean.evt |
| Size (bytes) | 1,034,150,400 | 99,846,720 |
| Size | 986.2 MB | 95.2 MB |
| Events in quadrant A | 10,303,046 | 643,867 |
| Events in quadrant B | 4,362,729 | 854,057 |
| Events in quadrant C | 13,401,041 | 323,766 |
| Events in quadrant D | 9,569,684 | 622,484 |
| Mode SS | |||
|---|---|---|---|
| Quadrant | BADHDUFLAG | Total packets | Discarded packets |
| A | 0 | 166 | 0 |
| B | 0 | 166 | 0 |
| C | 0 | 166 | 0 |
| D | 0 | 166 | 0 |
| Mode M0 | |||
|---|---|---|---|
| Quadrant | BADHDUFLAG | Total packets | Discarded packets |
| A | 0 | 36439 | 0 |
| B | 0 | 18867 | 0 |
| C | 0 | 45622 | 0 |
| D | 0 | 34272 | 0 |
| Quadrant | Total seconds | Saturated seconds | Saturation percentage |
|---|---|---|---|
| A | 8328 | 1879 | 22.562440% |
| B | 8329 | 105 | 1.260656% |
| C | 8329 | 5148 | 61.808140% |
| D | 8329 | 1321 | 15.860247% |
Noise dominated data is calculated using 1-second bins in cleaned event files. If a bin has >2000 counts, and if more than 50% of those come from <1% of pixels, then it is considered to be noise-dominated and hence unusable.
| Quadrant | # 1 sec bins | Bins with >0 counts | Bins with >2000 counts | High rate bins dominated by noise | Noise dominated (total time) | Noise dominated (detector-on time) | Marked lightcurve |
|---|---|---|---|---|---|---|---|
| A | 8328 | 8328 | 1516 | 1516 | 18.20% | 18.20% | 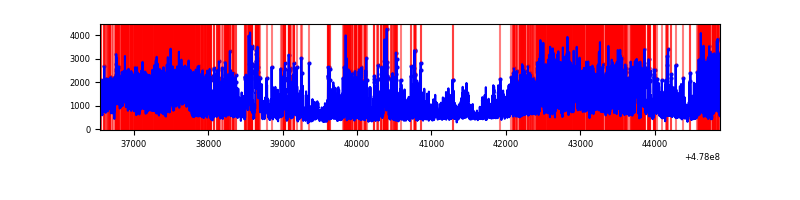 |
| B | 8329 | 8329 | 52 | 52 | 0.62% | 0.62% | 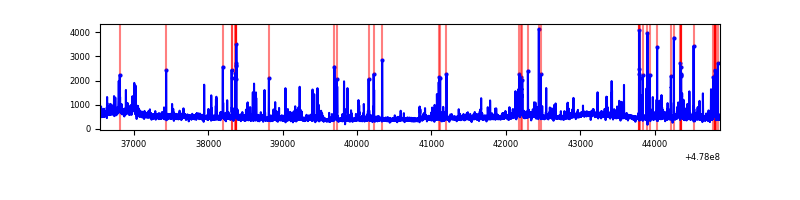 |
| C | 8328 | 8326 | 2671 | 2671 | 32.07% | 32.08% | 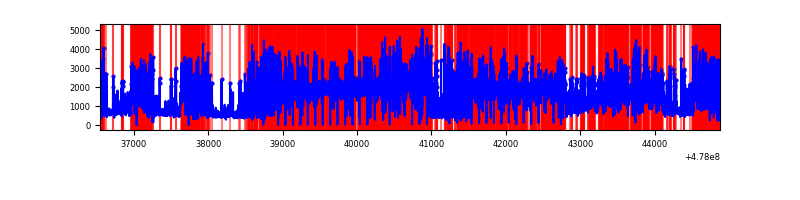 |
| D | 8329 | 8329 | 879 | 879 | 10.55% | 10.55% | 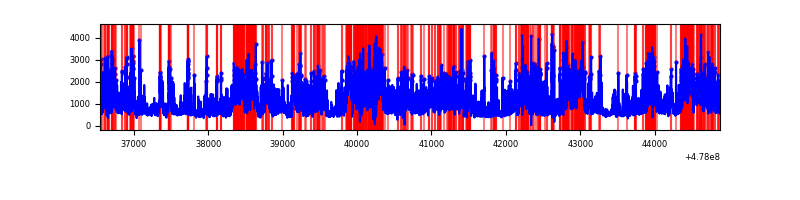 |
Top three noisy pixels from each quadrant. If the there are fewer than three noisy pixels in the level2.evt file, extra rows are filled as -1
| Pixel properties | Quadrant properties | ||||||
|---|---|---|---|---|---|---|---|
| Quadrant | DetID | PixID | Counts | Sigma | Mean | Median | Sigma |
| A | 4 | 4 | 5084851 | 24293.16 | 835 | 812 | 209.3 |
| A | 7 | 206 | 725786 | 3464.16 | 835 | 812 | 209.3 |
| A | 4 | 3 | 297735 | 1418.79 | 835 | 812 | 209.3 |
| B | 0 | 171 | 177814 | 929.85 | 896 | 864 | 190.3 |
| B | 4 | 81 | 109744 | 572.15 | 896 | 864 | 190.3 |
| B | 4 | 206 | 73824 | 383.39 | 896 | 864 | 190.3 |
| C | 1 | 29 | 7957312 | 54859.32 | 519 | 516 | 145.0 |
| C | 4 | 210 | 849299 | 5852.06 | 519 | 516 | 145.0 |
| C | 15 | 173 | 455864 | 3139.46 | 519 | 516 | 145.0 |
| D | 7 | 45 | 3040976 | 12877.6 | 833 | 804 | 236.1 |
| D | 2 | 249 | 443920 | 1876.96 | 833 | 804 | 236.1 |
| D | 1 | 47 | 426921 | 1804.95 | 833 | 804 | 236.1 |
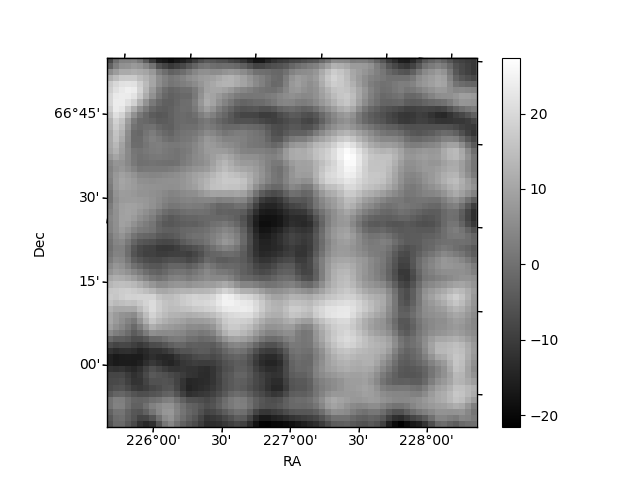
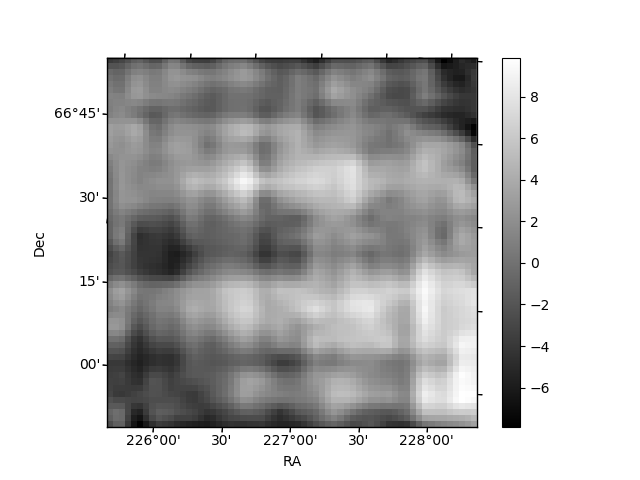
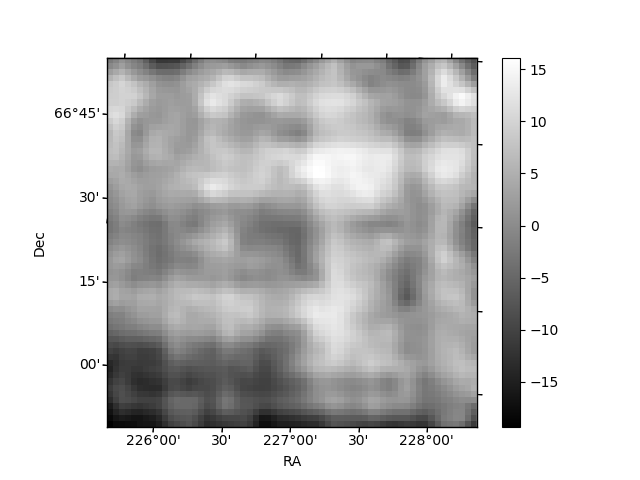
Histogram calculated using DETX and DETY for each event in the final _common_clean file
| Quadrant A | 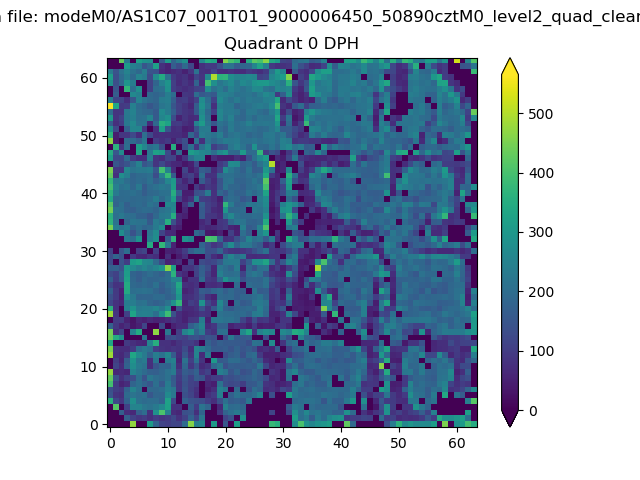 |
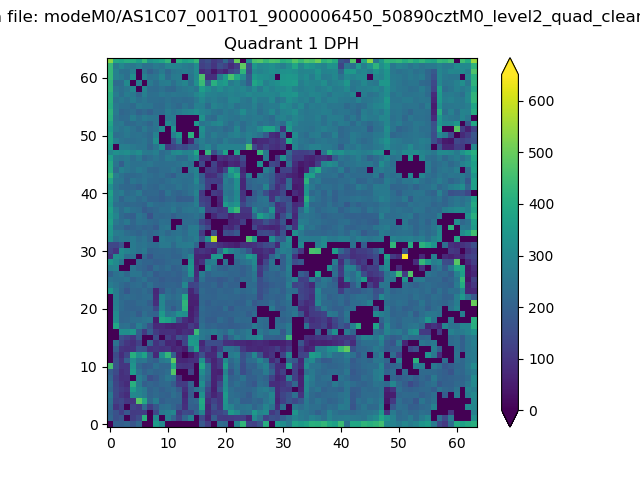 |
Quadrant B |
|---|---|---|---|
| Quadrant D | 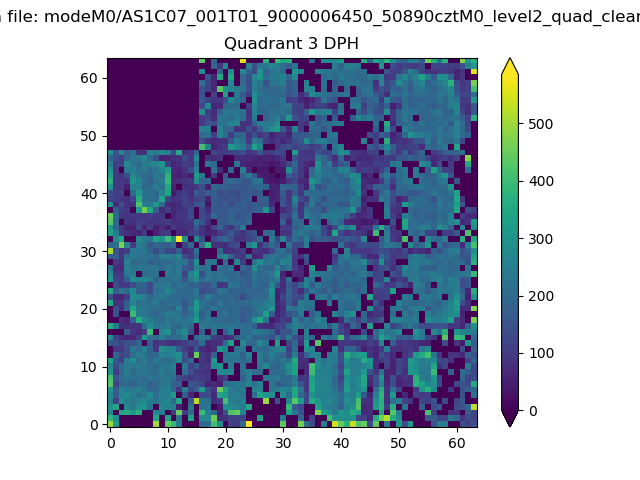 |
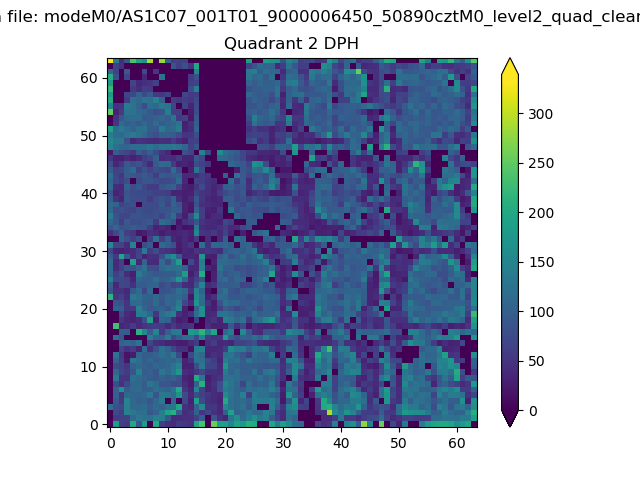 |
Quadrant C |
| Plot type | Count rate plots | Images |
|---|---|---|
| Comparison with Poisson distribution Blue bars denote a histogram of data divided into 1 sec bins. Red curve is a Poisson curve with rate = median count rate of data. |
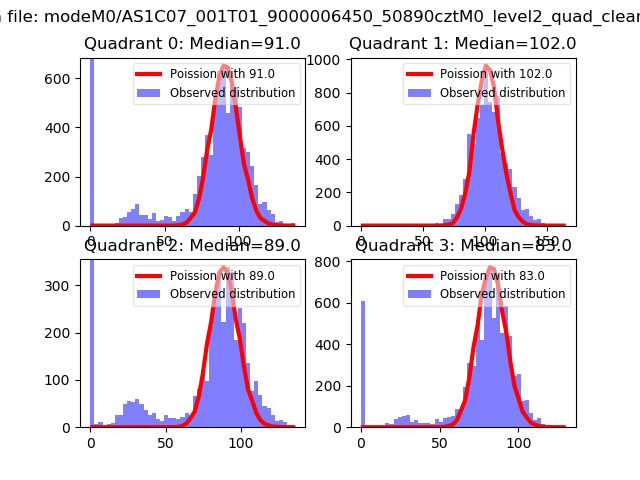 |
 |
| Quadrant-wise count rates Data is divided into 100 sec bins |
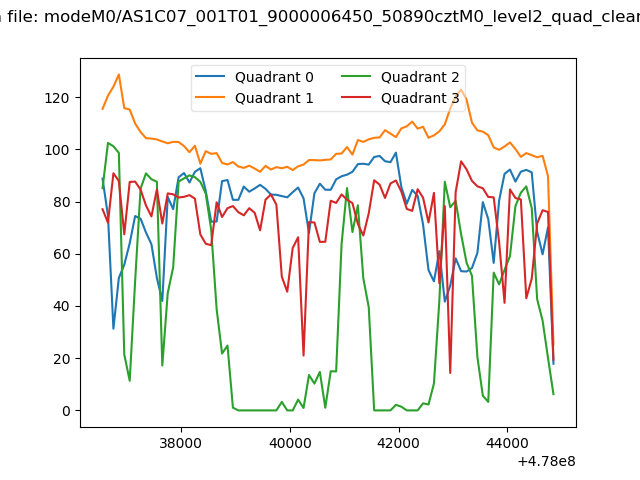 |
|
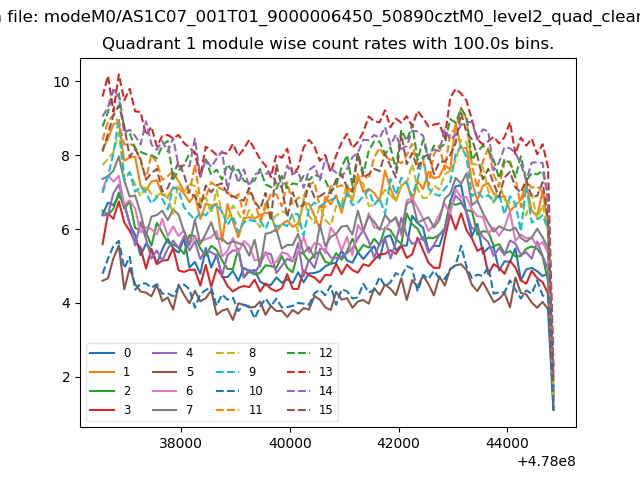
| Module-wise count rates for Quadrant A Data is divided into 100 sec bins |
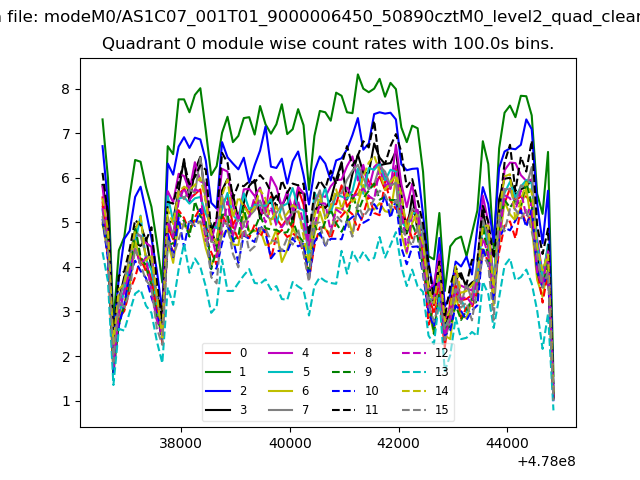 |
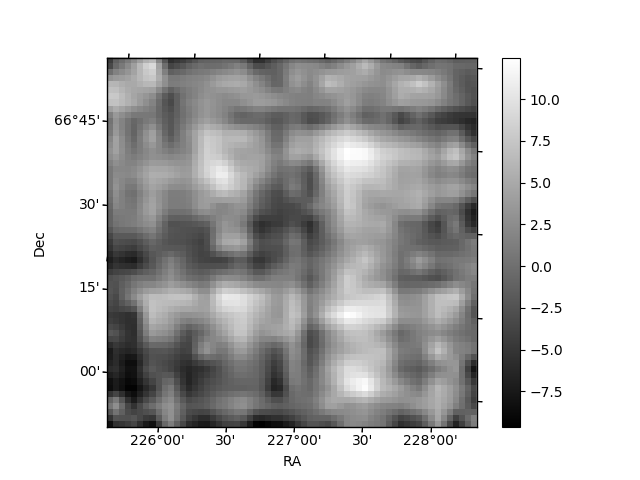 |
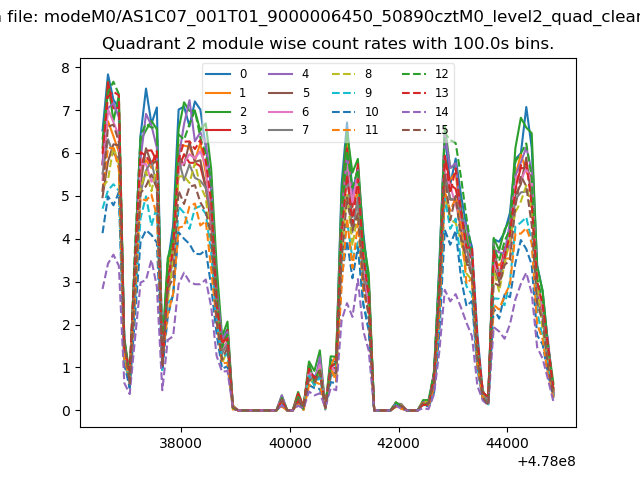
| Module-wise count rates for Quadrant B Data is divided into 100 sec bins |
 |
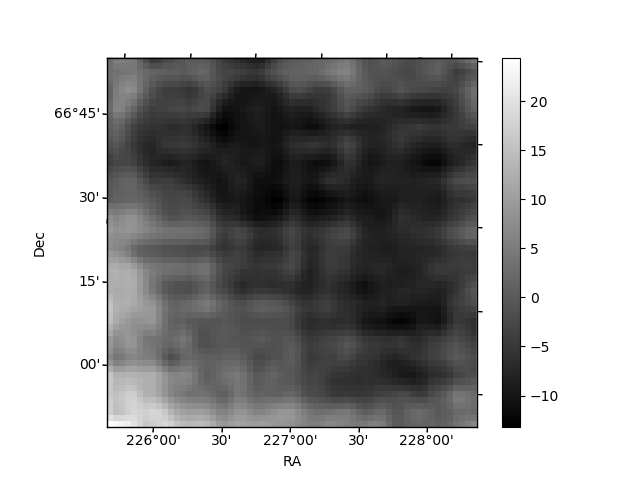 |
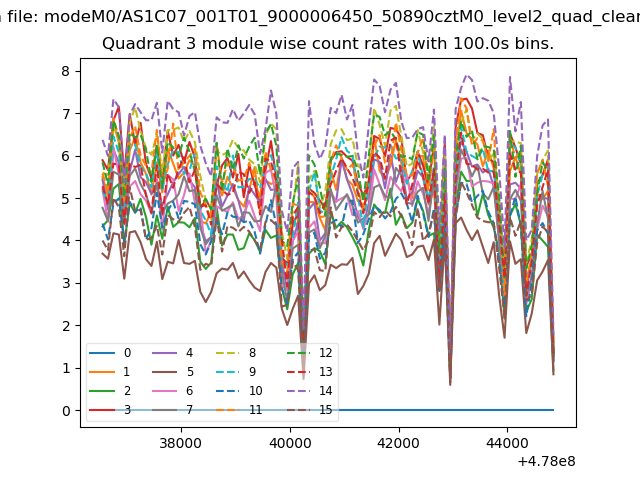
| Module-wise count rates for Quadrant C Data is divided into 100 sec bins |
 |
 |
| Module-wise count rates for Quadrant D Data is divided into 100 sec bins |
 |
 |
| Parameter | Plot |
|---|---|
| CZT HV Monitor | 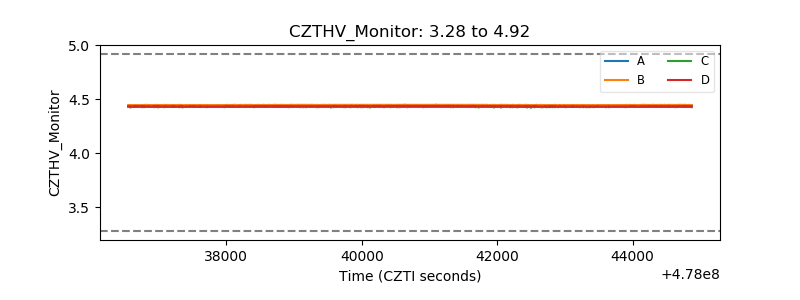 |
| D_VDD | 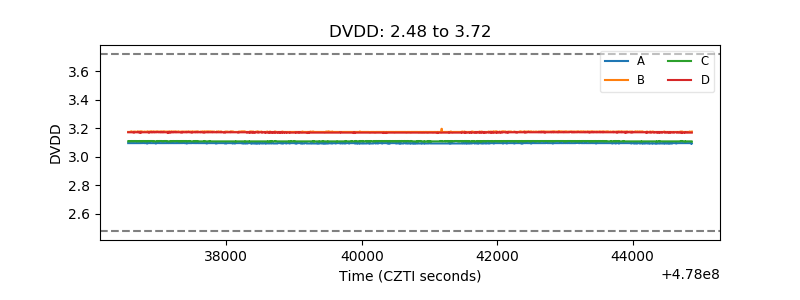 |
| Temperature 1 | 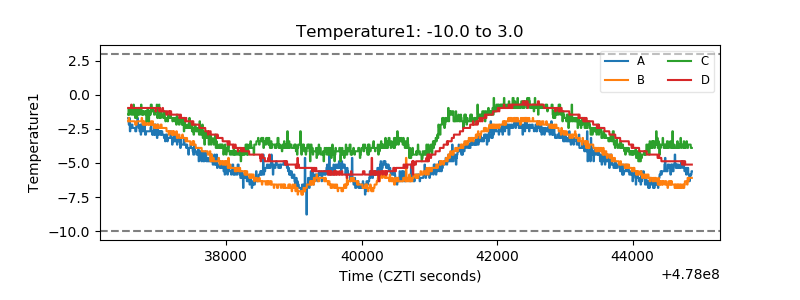 |
| Veto HV Monitor | 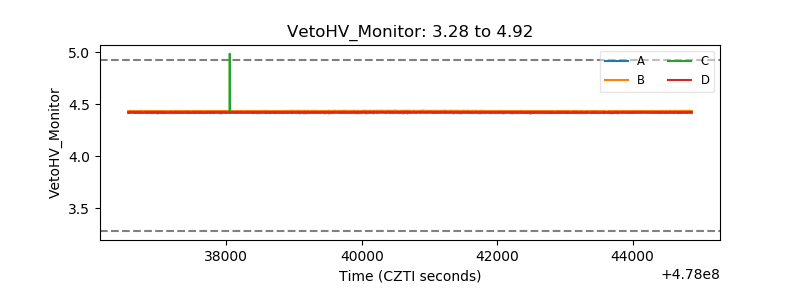 |
| Veto LLD | 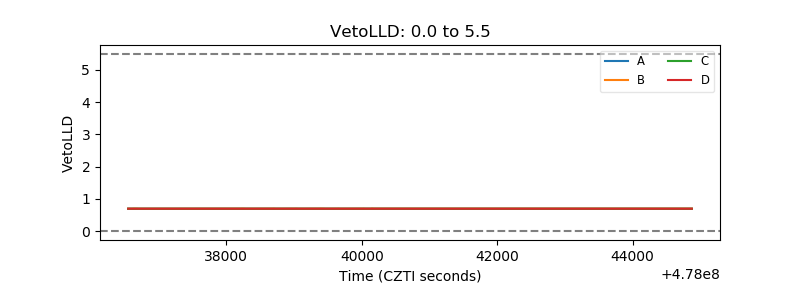 |
| Alpha Counter | 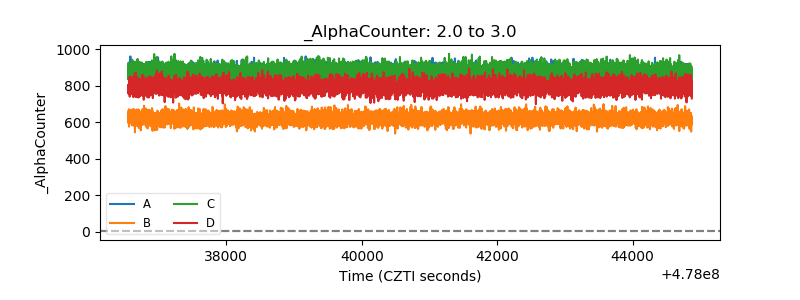 |
| _CPM_Rate | 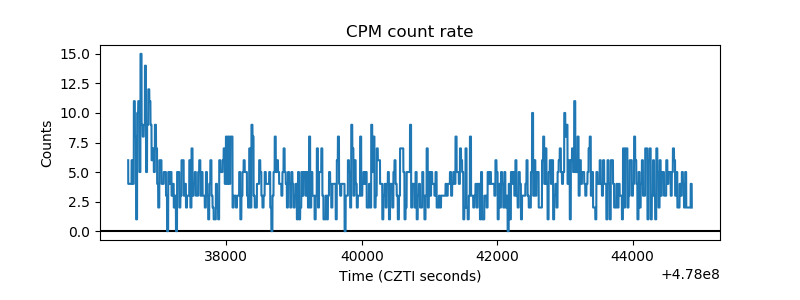 |
| CZT Counter | 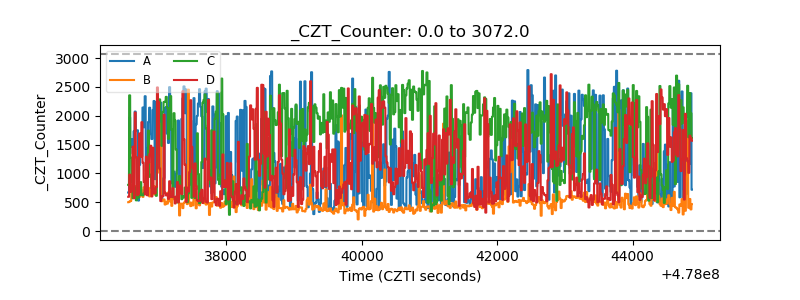 |
| +2.5 Volts monitor | 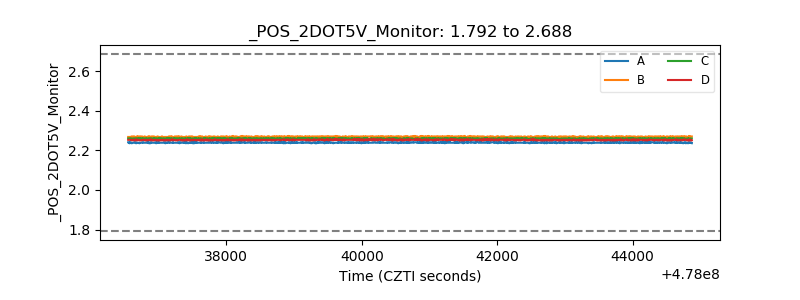 |
| +5 Volts monitor |  |
| _ROLL_ROT | 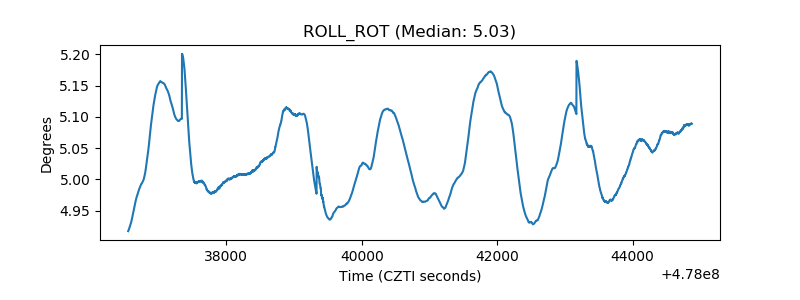 |
| _Roll_DEC | 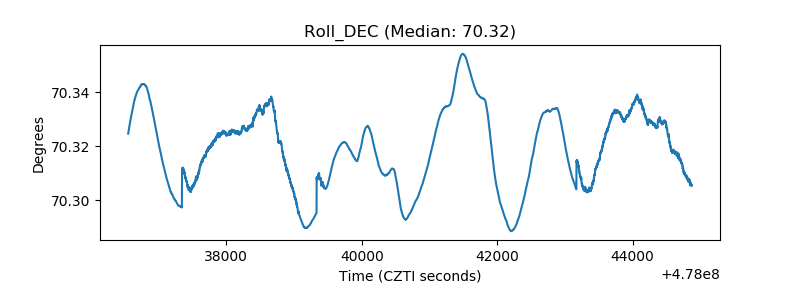 |
| _Roll_RA | 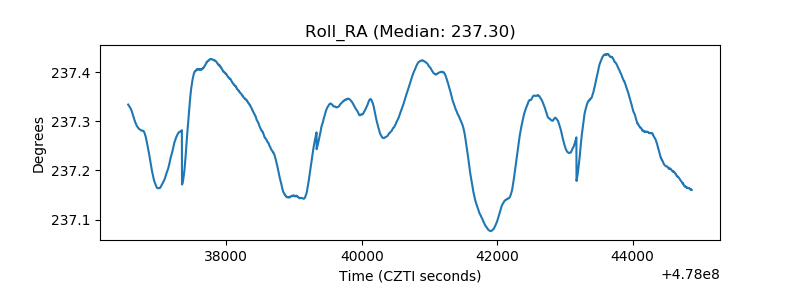 |
| Veto Counter | 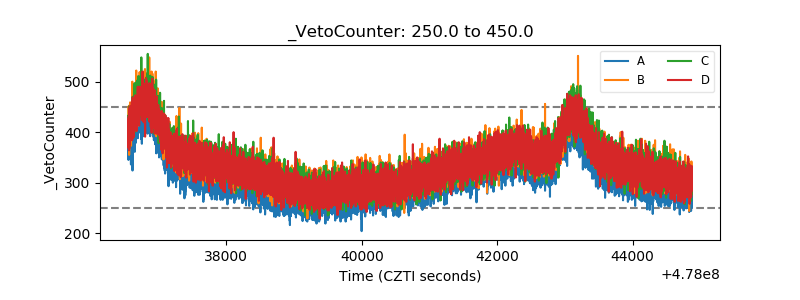 |