| Param | Original file | Final file |
|---|---|---|
| Filename | modeM0/AS1C07_001T01_9000006450_50894cztM0_level2.fits | modeM0/AS1C07_001T01_9000006450_50894cztM0_level2_quad_clean.evt |
| Size (bytes) | 3,263,826,240 | 276,419,520 |
| Size | 3.0 GB | 263.6 MB |
| Events in quadrant A | 34,253,783 | 1,704,623 |
| Events in quadrant B | 12,955,394 | 2,484,119 |
| Events in quadrant C | 37,706,430 | 1,149,389 |
| Events in quadrant D | 33,982,319 | 1,314,674 |
| Mode SS | |||
|---|---|---|---|
| Quadrant | BADHDUFLAG | Total packets | Discarded packets |
| A | 0 | 507 | 2 |
| B | 0 | 508 | 4 |
| C | 0 | 505 | 3 |
| D | 0 | 508 | 4 |
| Mode M0 | |||
|---|---|---|---|
| Quadrant | BADHDUFLAG | Total packets | Discarded packets |
| A | 0 | 119991 | 952 |
| B | 0 | 56834 | 312 |
| C | 0 | 130473 | 1114 |
| D | 0 | 119470 | 786 |
| Mode M9 | |||
|---|---|---|---|
| Quadrant | BADHDUFLAG | Total packets | Discarded packets |
| A | 0 | 15 | 0 |
| B | 0 | 15 | 0 |
| C | 0 | 15 | 0 |
| D | 0 | 15 | 0 |
| Quadrant | Total seconds | Saturated seconds | Saturation percentage |
|---|---|---|---|
| A | 24916 | 6982 | 28.022154% |
| B | 24951 | 504 | 2.019959% |
| C | 24899 | 12032 | 48.323226% |
| D | 24923 | 8423 | 33.796092% |
Noise dominated data is calculated using 1-second bins in cleaned event files. If a bin has >2000 counts, and if more than 50% of those come from <1% of pixels, then it is considered to be noise-dominated and hence unusable.
| Quadrant | # 1 sec bins | Bins with >0 counts | Bins with >2000 counts | High rate bins dominated by noise | Noise dominated (total time) | Noise dominated (detector-on time) | Marked lightcurve |
|---|---|---|---|---|---|---|---|
| A | 26575 | 24961 | 6160 | 6160 | 23.18% | 24.68% | 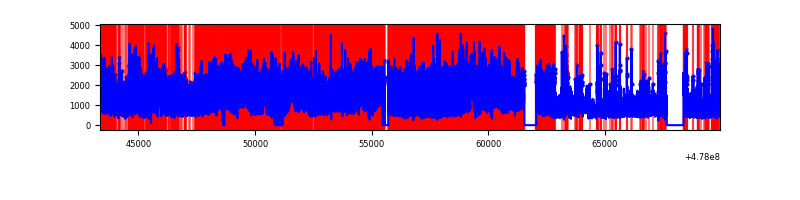 |
| B | 26575 | 24996 | 235 | 235 | 0.88% | 0.94% | 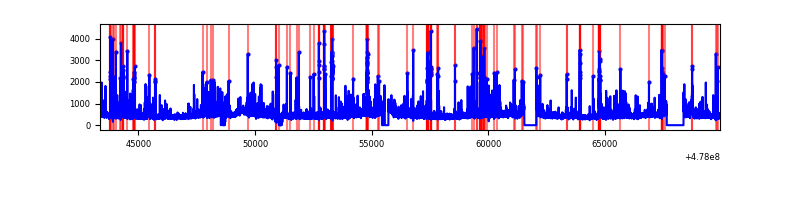 |
| C | 26574 | 24934 | 6797 | 6797 | 25.58% | 27.26% | 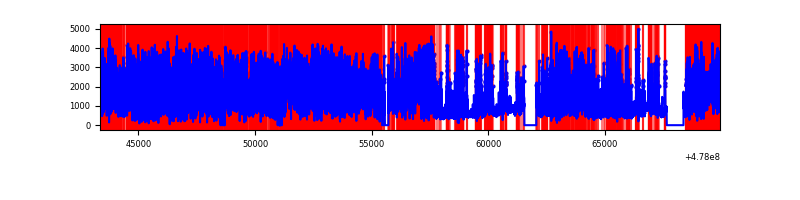 |
| D | 26575 | 24963 | 6689 | 6689 | 25.17% | 26.80% | 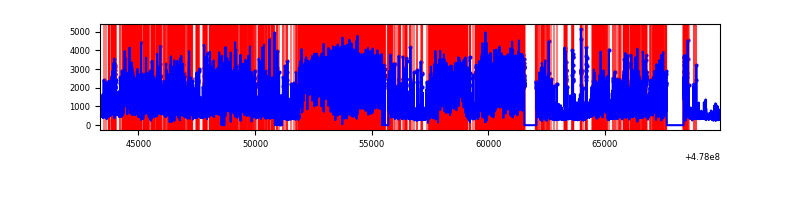 |
Top three noisy pixels from each quadrant. If the there are fewer than three noisy pixels in the level2.evt file, extra rows are filled as -1
| Pixel properties | Quadrant properties | ||||||
|---|---|---|---|---|---|---|---|
| Quadrant | DetID | PixID | Counts | Sigma | Mean | Median | Sigma |
| A | 4 | 4 | 16159102 | 27078.8 | 2403 | 2334 | 596.7 |
| A | 7 | 207 | 4264999 | 7144.24 | 2403 | 2334 | 596.7 |
| A | 4 | 249 | 780067 | 1303.48 | 2403 | 2334 | 596.7 |
| B | 4 | 206 | 342667 | 610.22 | 2613 | 2515 | 557.4 |
| B | 0 | 171 | 317352 | 564.8 | 2613 | 2515 | 557.4 |
| B | 8 | 128 | 282561 | 502.39 | 2613 | 2515 | 557.4 |
| C | 1 | 29 | 11954247 | 22739.46 | 1881 | 1866 | 525.6 |
| C | 4 | 210 | 8980928 | 17082.71 | 1881 | 1866 | 525.6 |
| C | 12 | 247 | 1729861 | 3287.52 | 1881 | 1866 | 525.6 |
| D | 15 | 184 | 10288436 | 17316.1 | 2120 | 2047 | 594.0 |
| D | 7 | 45 | 4772967 | 8031.36 | 2120 | 2047 | 594.0 |
| D | 15 | 108 | 1910144 | 3212.09 | 2120 | 2047 | 594.0 |
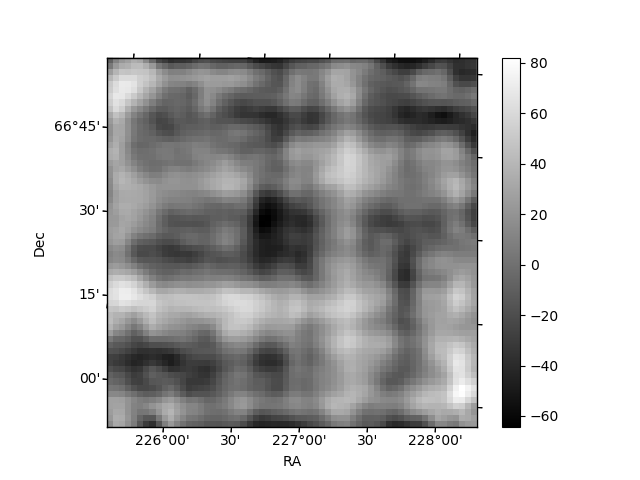
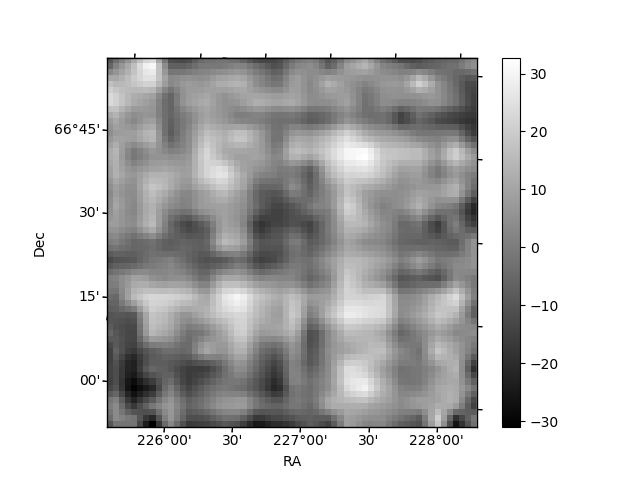
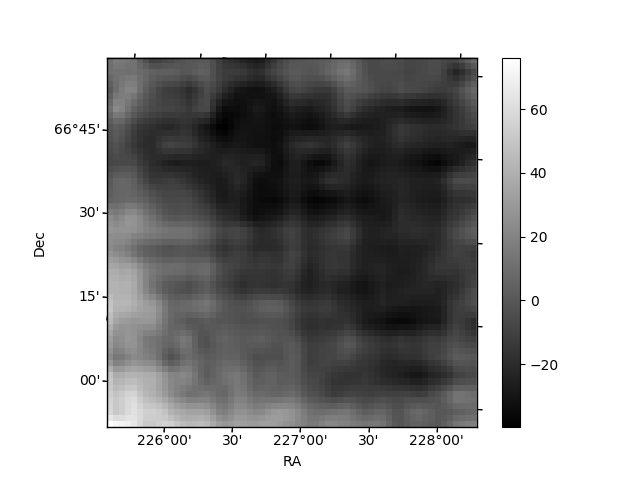
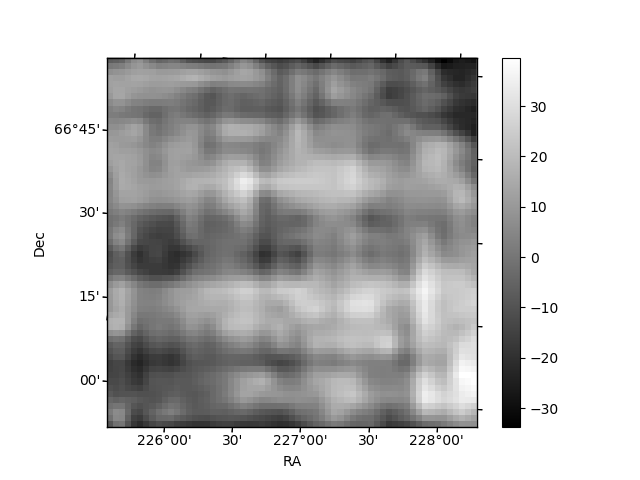
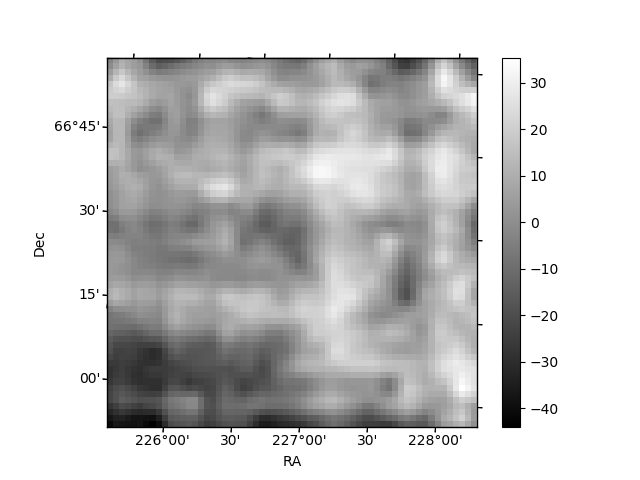
Histogram calculated using DETX and DETY for each event in the final _common_clean file
| Quadrant A | 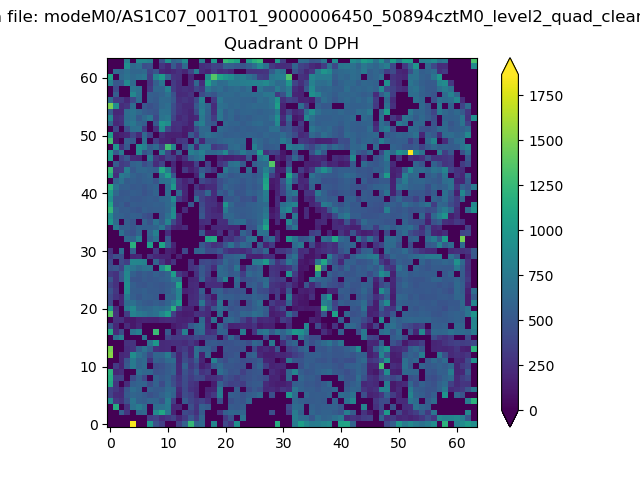 |
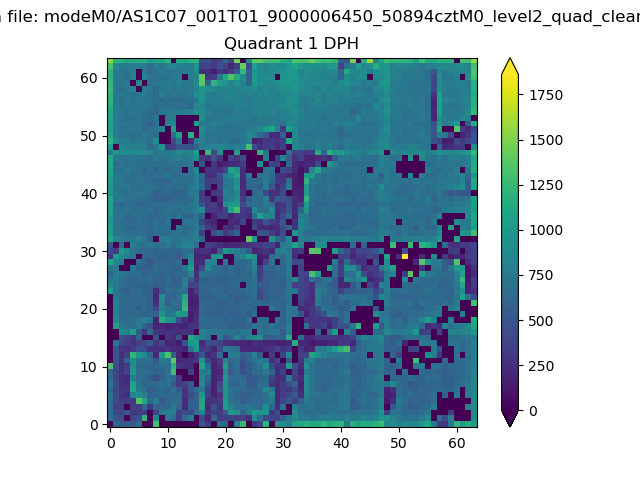 |
Quadrant B |
|---|---|---|---|
| Quadrant D | 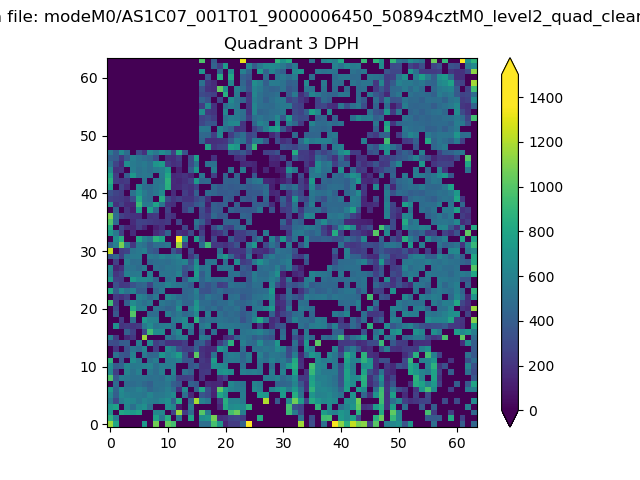 |
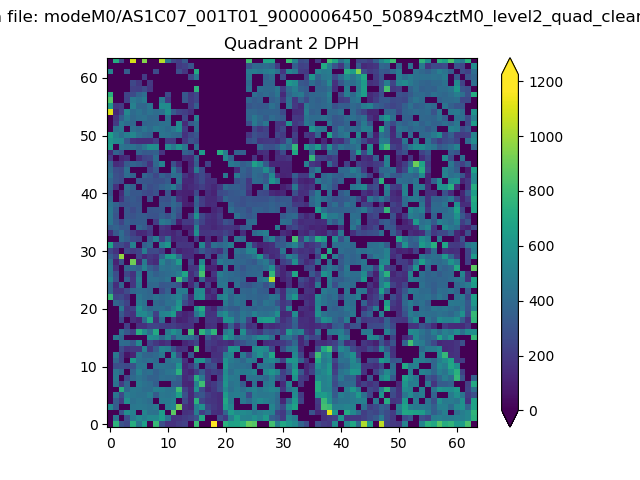 |
Quadrant C |
| Plot type | Count rate plots | Images |
|---|---|---|
| Comparison with Poisson distribution Blue bars denote a histogram of data divided into 1 sec bins. Red curve is a Poisson curve with rate = median count rate of data. |
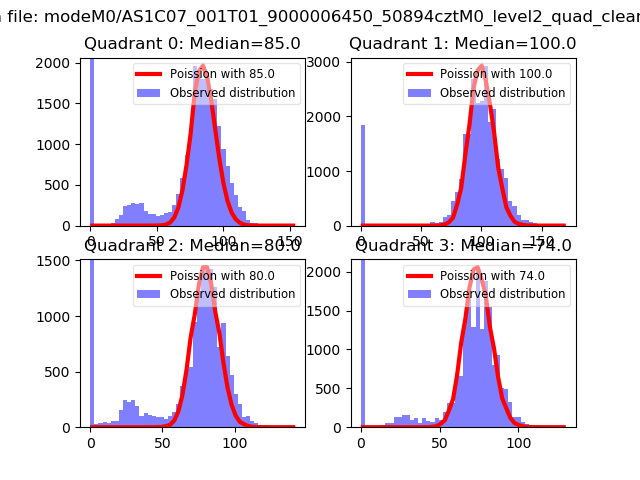 |
 |
| Quadrant-wise count rates Data is divided into 100 sec bins |
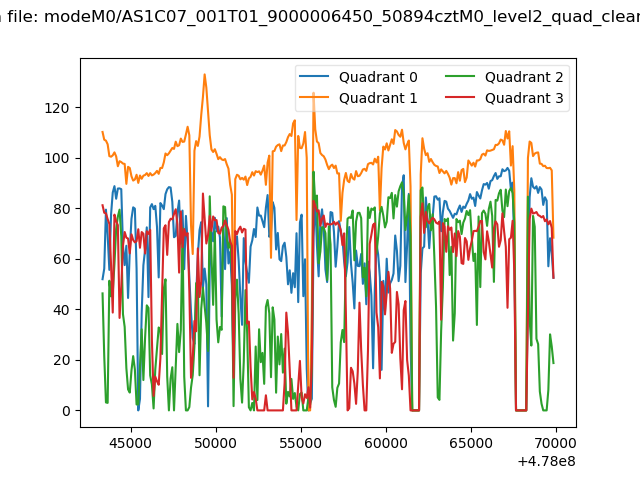 |
|
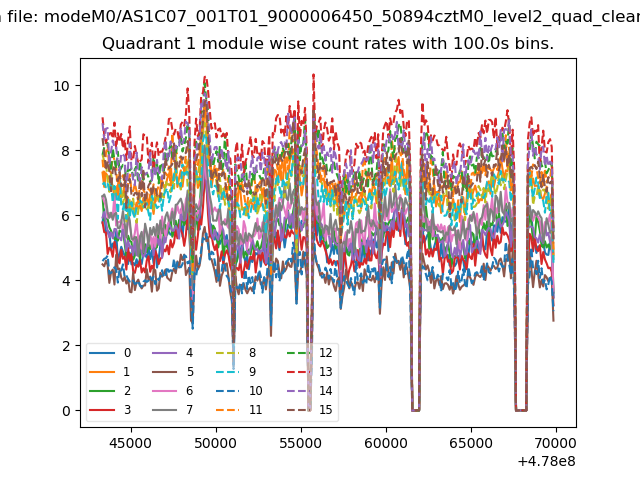
| Module-wise count rates for Quadrant A Data is divided into 100 sec bins |
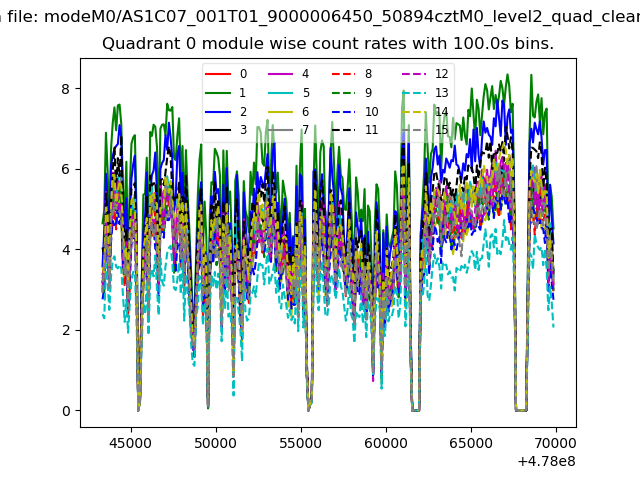 |
 |
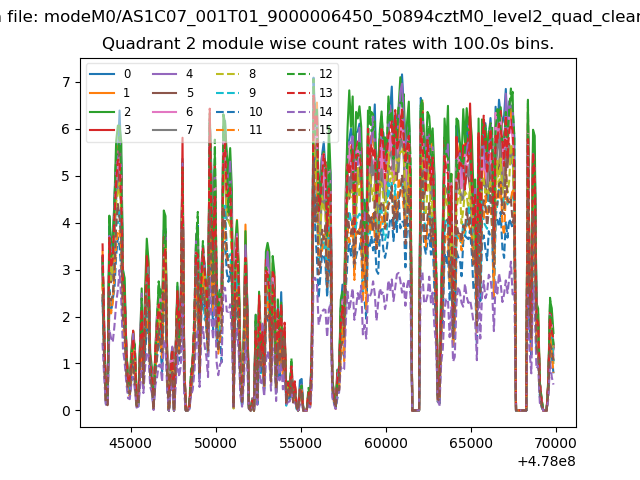
| Module-wise count rates for Quadrant B Data is divided into 100 sec bins |
 |
 |
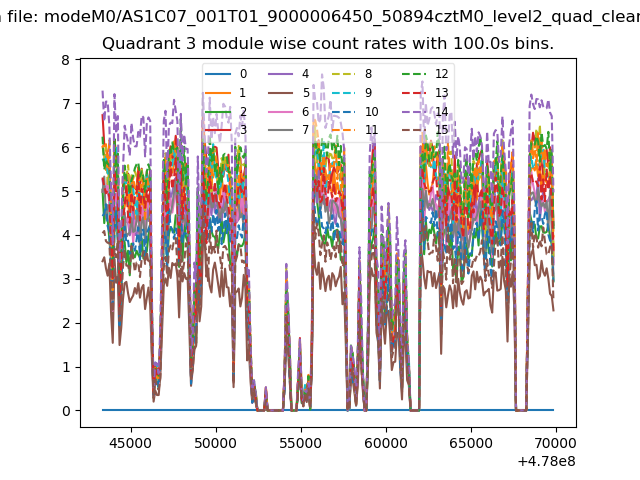
| Module-wise count rates for Quadrant C Data is divided into 100 sec bins |
 |
 |
| Module-wise count rates for Quadrant D Data is divided into 100 sec bins |
 |
 |
| Parameter | Plot |
|---|---|
| CZT HV Monitor | 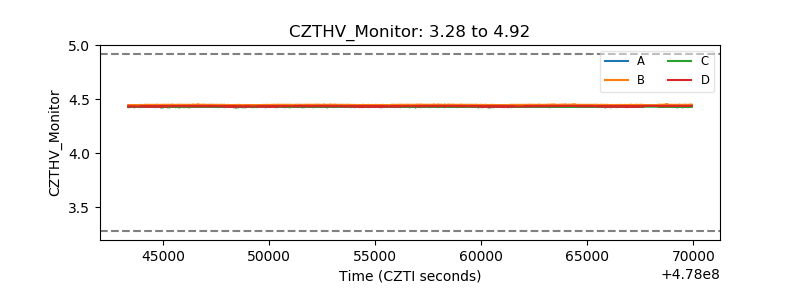 |
| D_VDD | 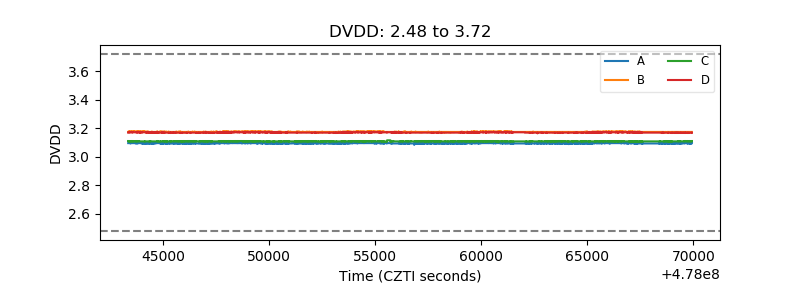 |
| Temperature 1 | 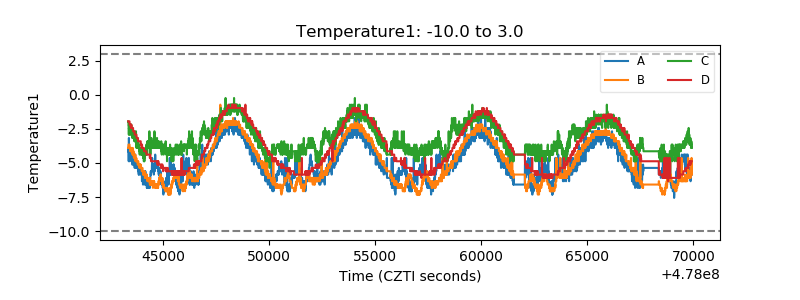 |
| Veto HV Monitor | 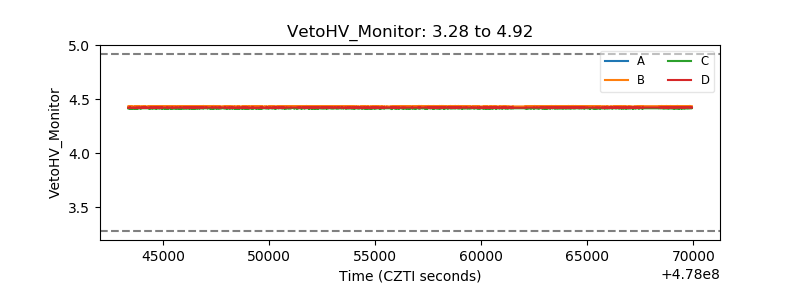 |
| Veto LLD | 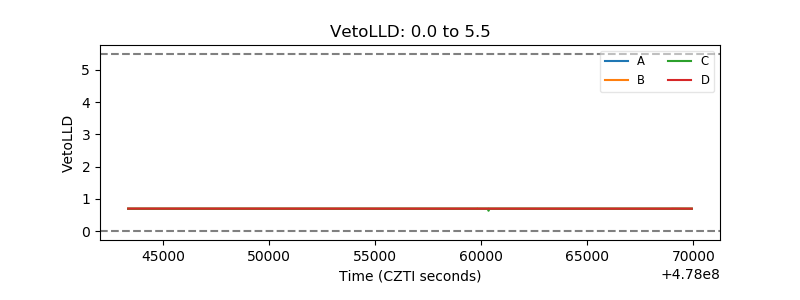 |
| Alpha Counter | 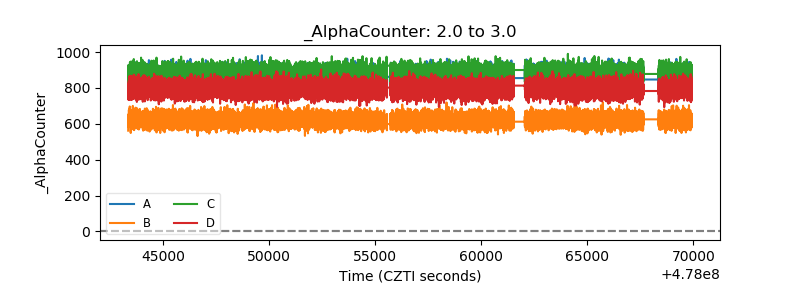 |
| _CPM_Rate | 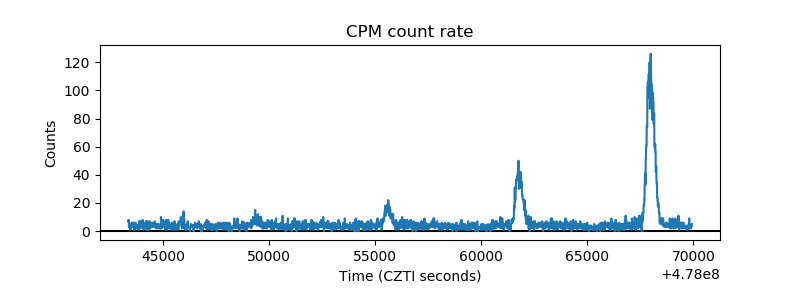 |
| CZT Counter | 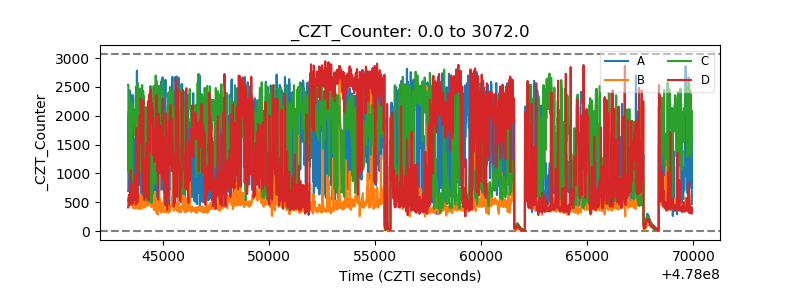 |
| +2.5 Volts monitor | 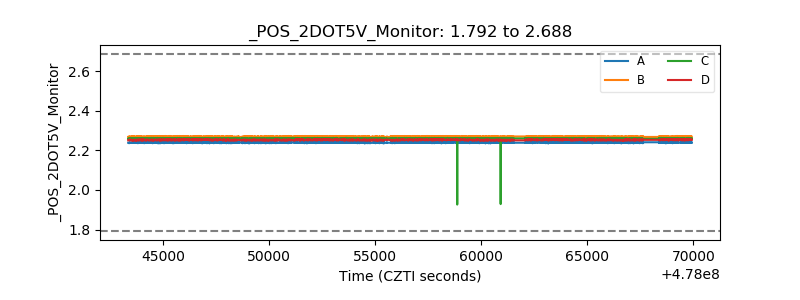 |
| +5 Volts monitor | 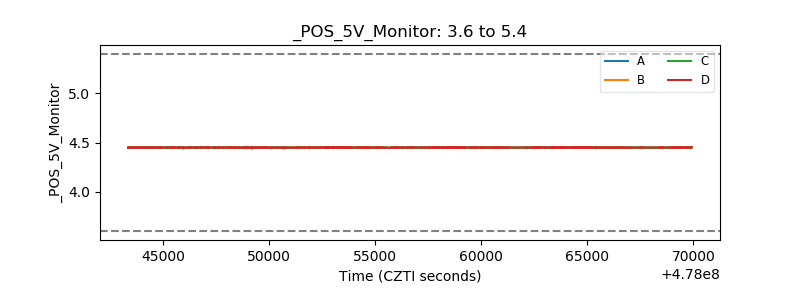 |
| _ROLL_ROT | 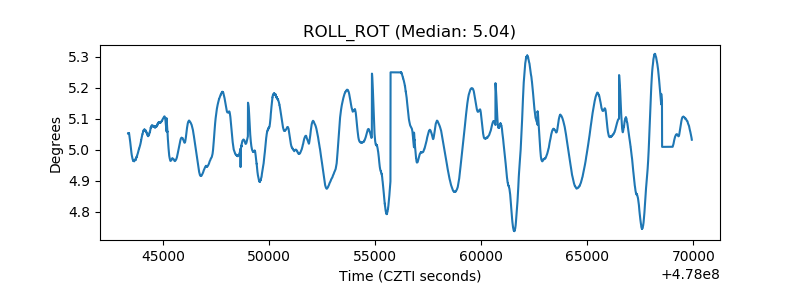 |
| _Roll_DEC | 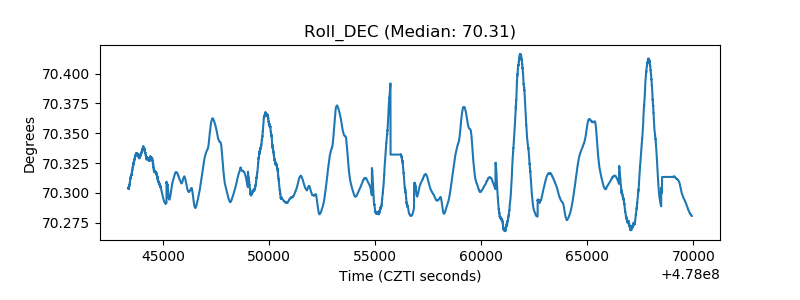 |
| _Roll_RA | 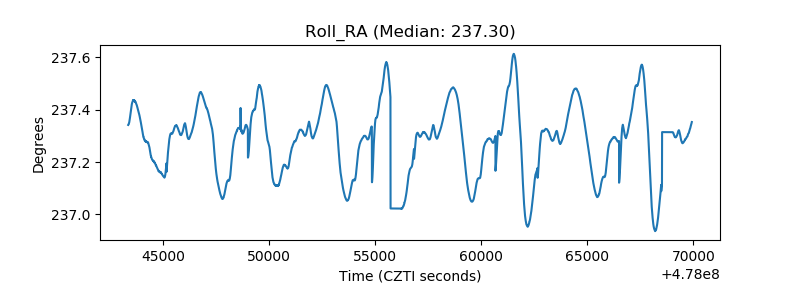 |
| Veto Counter | 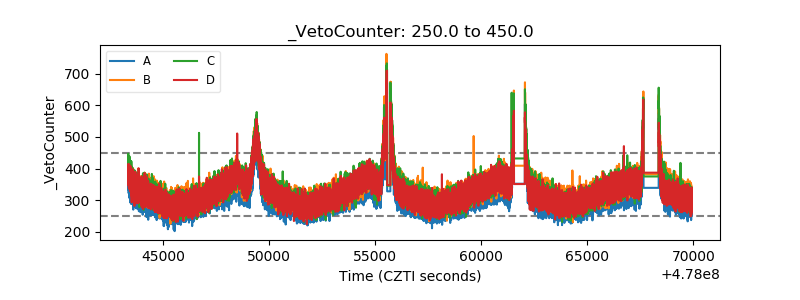 |