| Param | Original file | Final file |
|---|---|---|
| Filename | modeM0/AS1C07_001T01_9000006450_50903cztM0_level2.fits | modeM0/AS1C07_001T01_9000006450_50903cztM0_level2_quad_clean.evt |
| Size (bytes) | 612,838,080 | 104,621,760 |
| Size | 584.4 MB | 99.8 MB |
| Events in quadrant A | 5,784,252 | 678,096 |
| Events in quadrant B | 3,916,988 | 768,184 |
| Events in quadrant C | 5,113,553 | 672,720 |
| Events in quadrant D | 7,285,088 | 523,499 |
| Mode SS | |||
|---|---|---|---|
| Quadrant | BADHDUFLAG | Total packets | Discarded packets |
| A | 0 | 154 | 0 |
| B | 0 | 154 | 0 |
| C | 0 | 154 | 0 |
| D | 0 | 154 | 0 |
| Mode M0 | |||
|---|---|---|---|
| Quadrant | BADHDUFLAG | Total packets | Discarded packets |
| A | 0 | 22437 | 4 |
| B | 0 | 17129 | 4 |
| C | 0 | 20355 | 4 |
| D | 0 | 26955 | 4 |
| Mode M9 | |||
|---|---|---|---|
| Quadrant | BADHDUFLAG | Total packets | Discarded packets |
| A | 0 | 3 | 0 |
| B | 0 | 4 | 0 |
| C | 0 | 4 | 0 |
| D | 0 | 4 | 0 |
| Quadrant | Total seconds | Saturated seconds | Saturation percentage |
|---|---|---|---|
| A | 7543 | 575 | 7.622962% |
| B | 7543 | 213 | 2.823810% |
| C | 7543 | 204 | 2.704494% |
| D | 7543 | 1520 | 20.151134% |
Noise dominated data is calculated using 1-second bins in cleaned event files. If a bin has >2000 counts, and if more than 50% of those come from <1% of pixels, then it is considered to be noise-dominated and hence unusable.
| Quadrant | # 1 sec bins | Bins with >0 counts | Bins with >2000 counts | High rate bins dominated by noise | Noise dominated (total time) | Noise dominated (detector-on time) | Marked lightcurve |
|---|---|---|---|---|---|---|---|
| A | 7793 | 7547 | 383 | 383 | 4.91% | 5.07% | 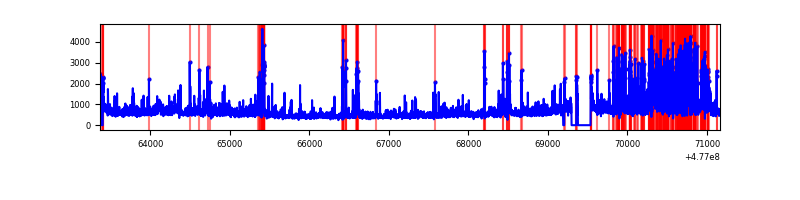 |
| B | 7793 | 7547 | 47 | 47 | 0.60% | 0.62% | 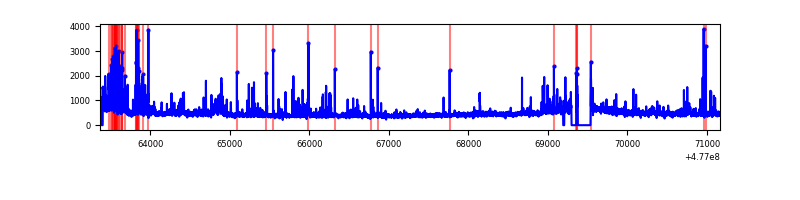 |
| C | 7793 | 7547 | 70 | 70 | 0.90% | 0.93% | 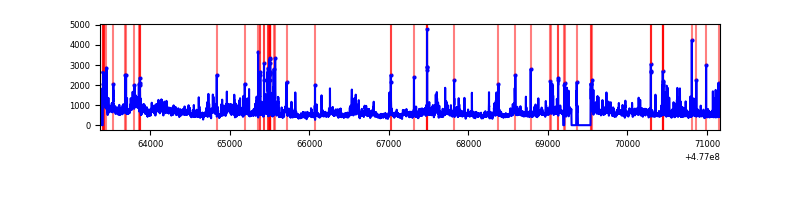 |
| D | 7792 | 7546 | 949 | 949 | 12.18% | 12.58% | 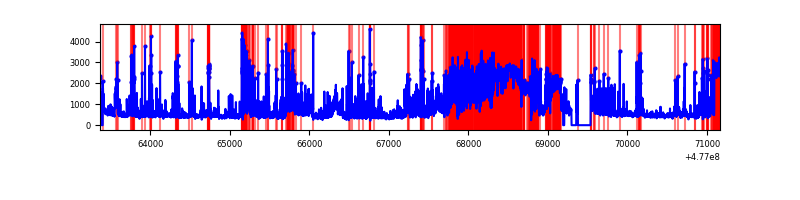 |
Top three noisy pixels from each quadrant. If the there are fewer than three noisy pixels in the level2.evt file, extra rows are filled as -1
| Pixel properties | Quadrant properties | ||||||
|---|---|---|---|---|---|---|---|
| Quadrant | DetID | PixID | Counts | Sigma | Mean | Median | Sigma |
| A | 7 | 206 | 929457 | 4759.65 | 788 | 770 | 195.1 |
| A | 4 | 4 | 703678 | 3602.5 | 788 | 770 | 195.1 |
| A | 4 | 3 | 175442 | 895.22 | 788 | 770 | 195.1 |
| B | 4 | 81 | 179651 | 1044.53 | 806 | 775 | 171.2 |
| B | 8 | 234 | 131400 | 762.77 | 806 | 775 | 171.2 |
| B | 8 | 128 | 124345 | 721.58 | 806 | 775 | 171.2 |
| C | 12 | 247 | 774825 | 3581.43 | 790 | 783 | 216.1 |
| C | 3 | 233 | 208821 | 962.57 | 790 | 783 | 216.1 |
| C | 5 | 10 | 187743 | 865.05 | 790 | 783 | 216.1 |
| D | 7 | 45 | 2160155 | 10845.76 | 711 | 685 | 199.1 |
| D | 15 | 184 | 433964 | 2176.11 | 711 | 685 | 199.1 |
| D | 2 | 249 | 416231 | 2087.04 | 711 | 685 | 199.1 |
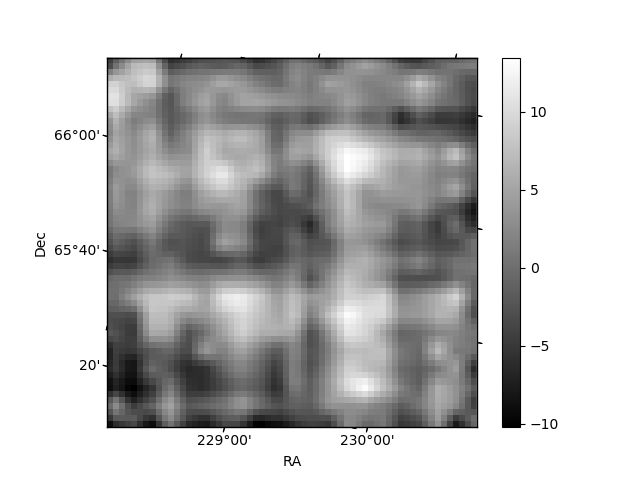
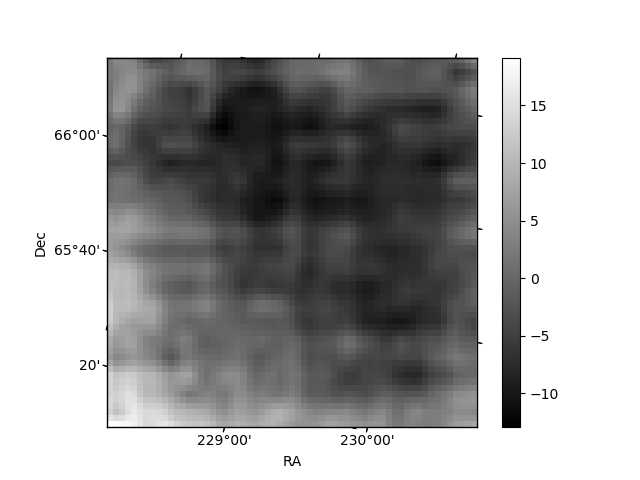
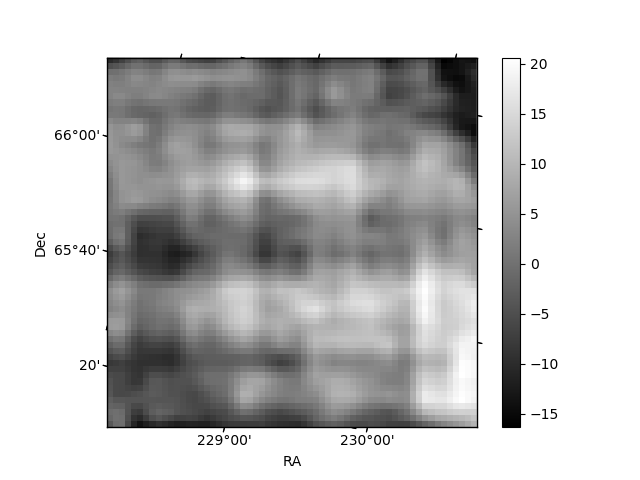
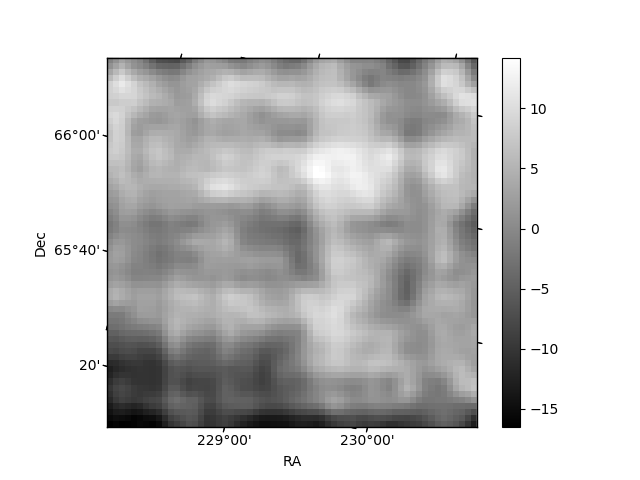
Histogram calculated using DETX and DETY for each event in the final _common_clean file
| Quadrant A | 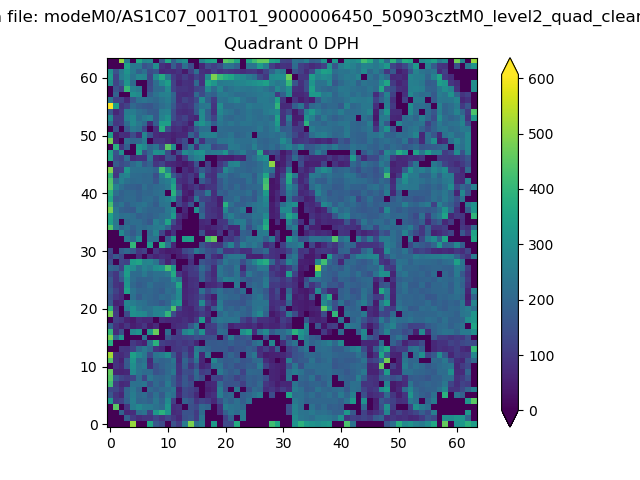 |
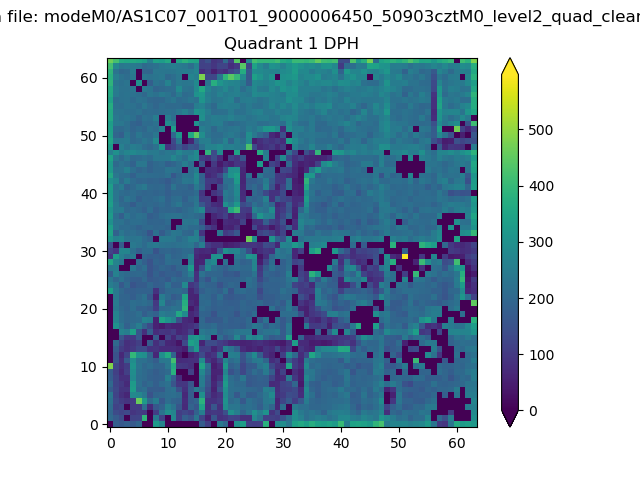 |
Quadrant B |
|---|---|---|---|
| Quadrant D | 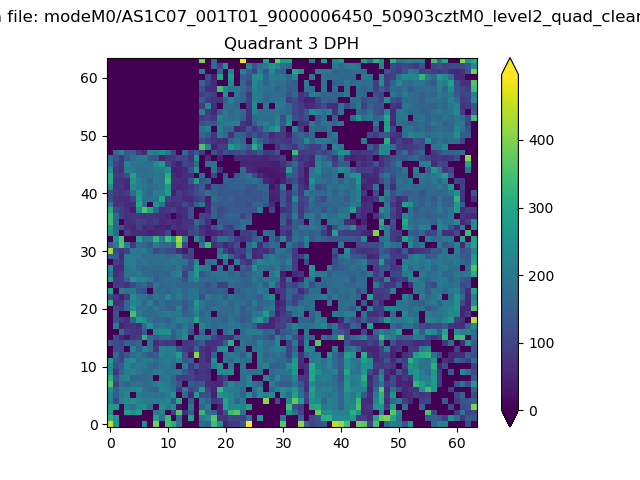 |
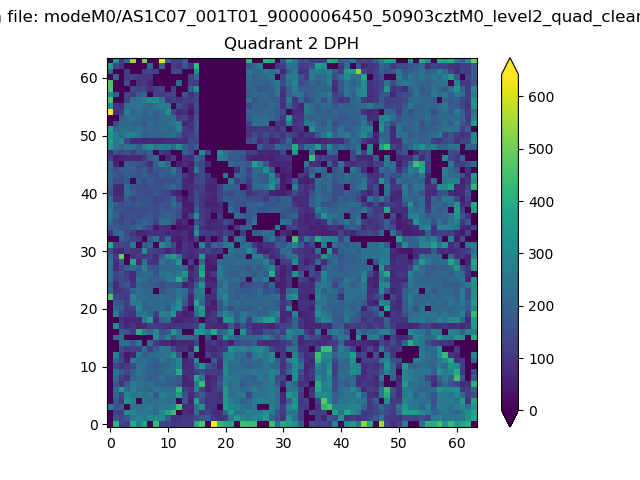 |
Quadrant C |
| Plot type | Count rate plots | Images |
|---|---|---|
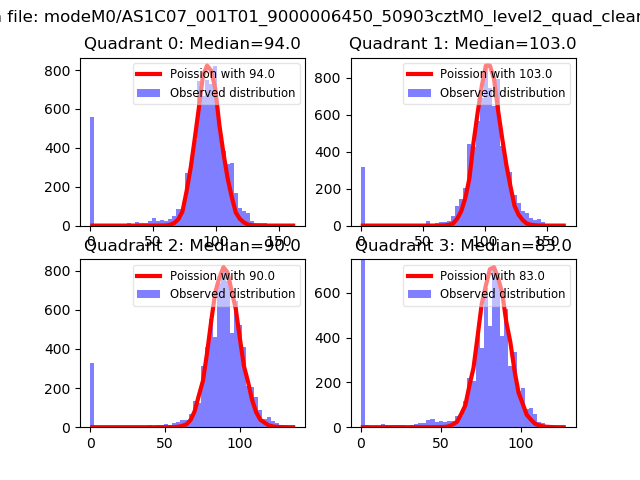
| Comparison with Poisson distribution Blue bars denote a histogram of data divided into 1 sec bins. Red curve is a Poisson curve with rate = median count rate of data. |
 |
 |
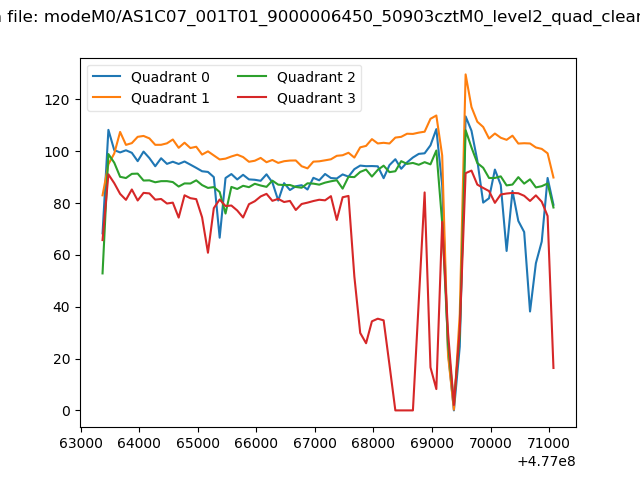
| Quadrant-wise count rates Data is divided into 100 sec bins |
 |
|
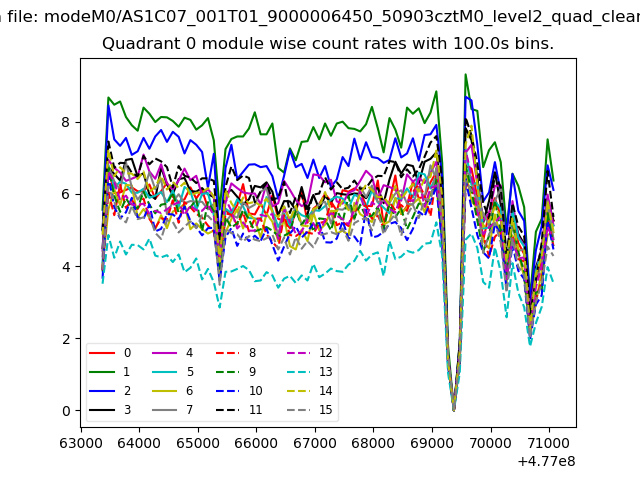
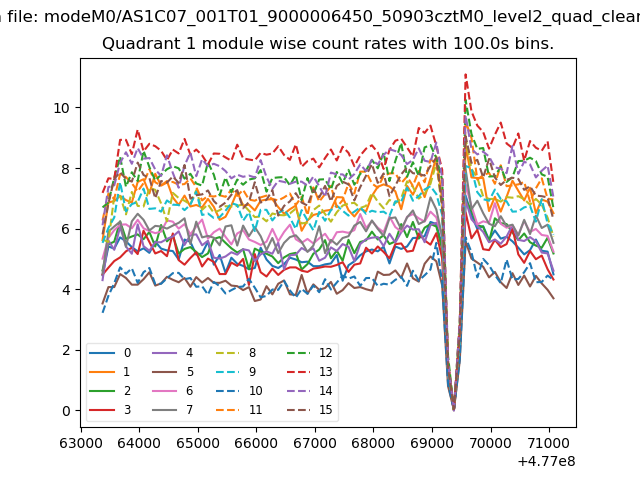
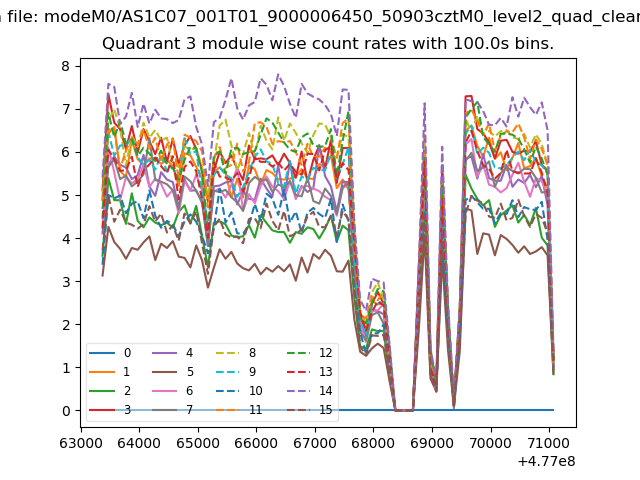
| Module-wise count rates for Quadrant A Data is divided into 100 sec bins |
 |
 |
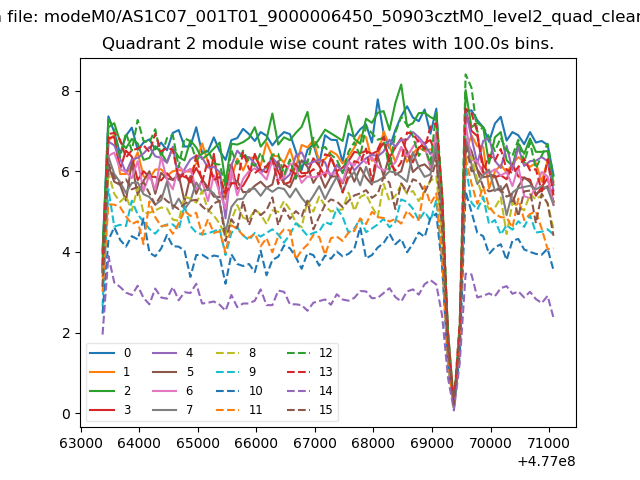
| Module-wise count rates for Quadrant B Data is divided into 100 sec bins |
 |
 |
| Module-wise count rates for Quadrant C Data is divided into 100 sec bins |
 |
 |
| Module-wise count rates for Quadrant D Data is divided into 100 sec bins |
 |
 |
| Parameter | Plot |
|---|---|
| CZT HV Monitor | 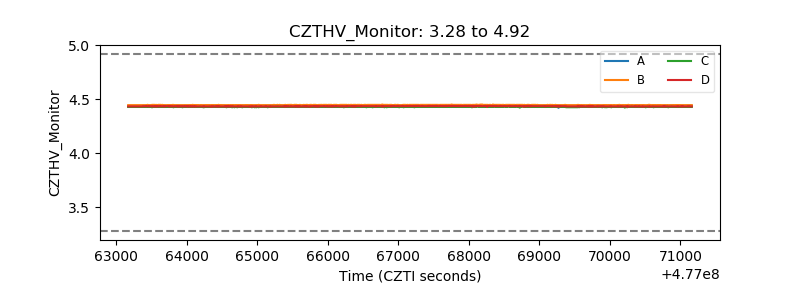 |
| D_VDD | 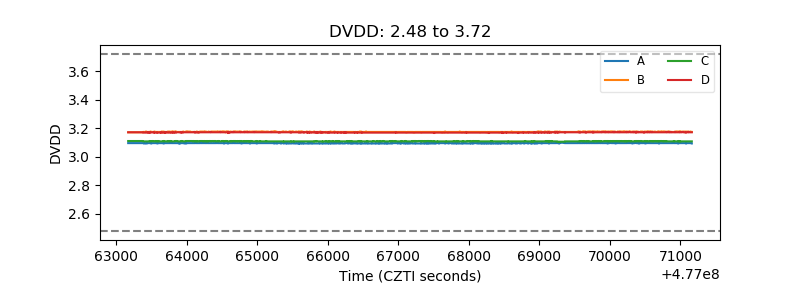 |
| Temperature 1 | 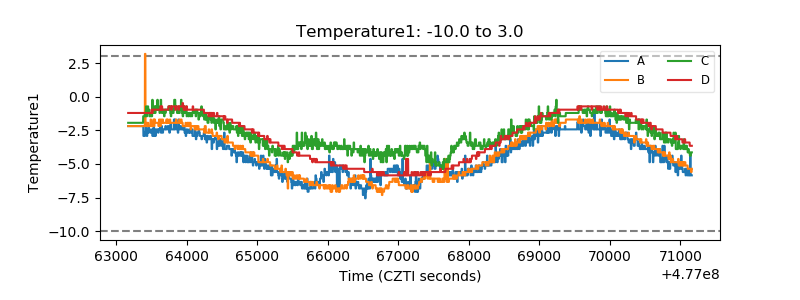 |
| Veto HV Monitor | 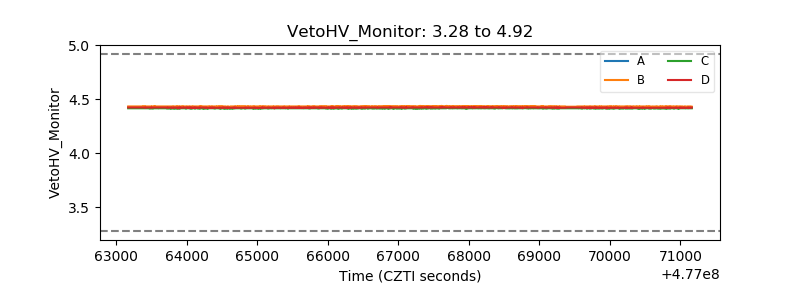 |
| Veto LLD | 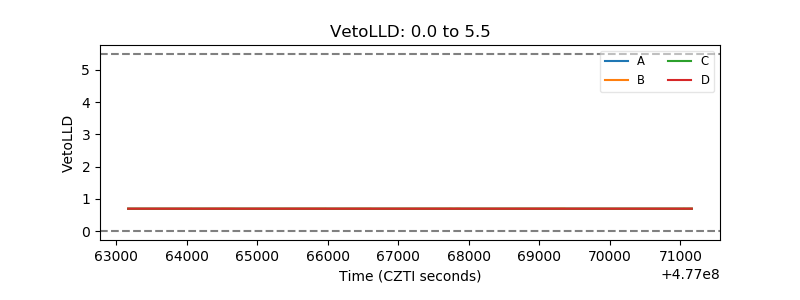 |
| Alpha Counter | 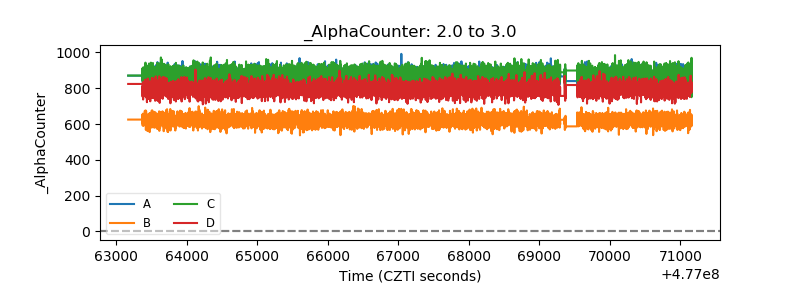 |
| _CPM_Rate | 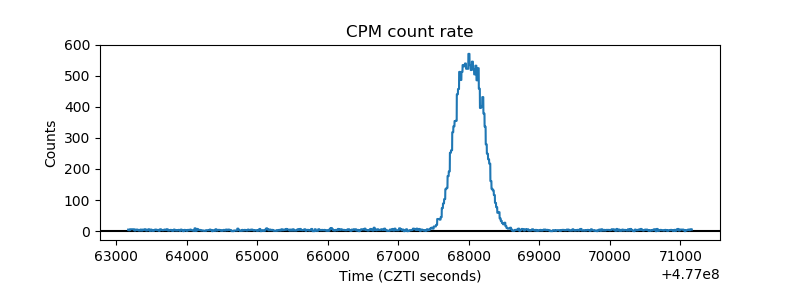 |
| CZT Counter | 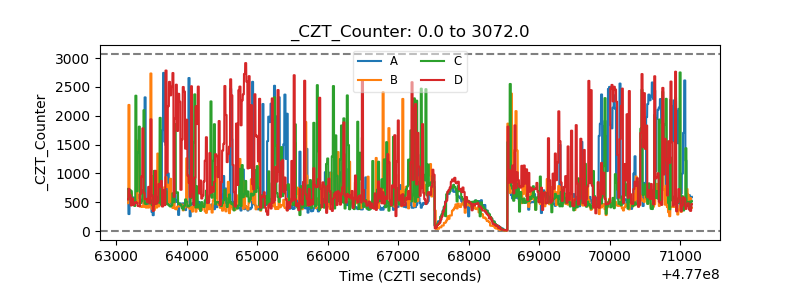 |
| +2.5 Volts monitor | 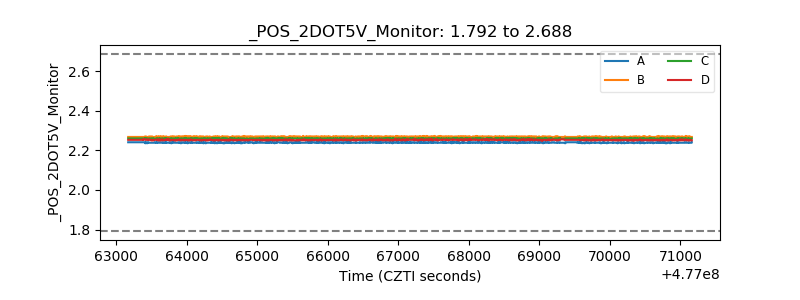 |
| +5 Volts monitor | 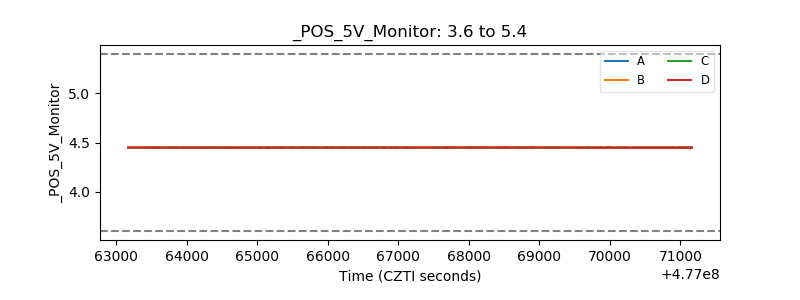 |
| _ROLL_ROT | 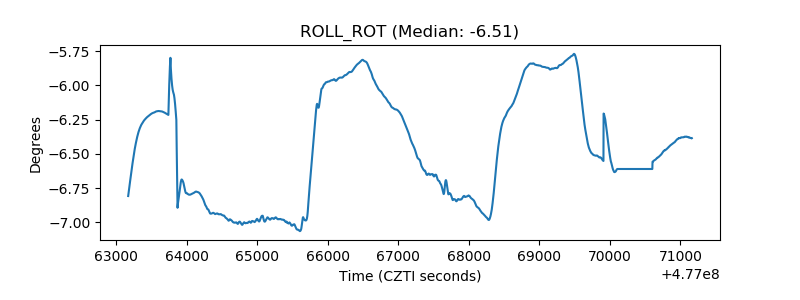 |
| _Roll_DEC | 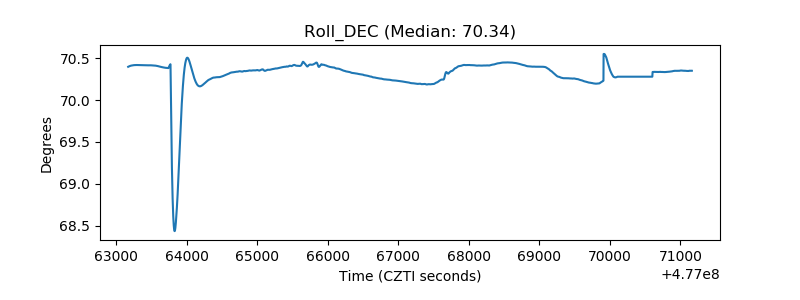 |
| _Roll_RA | 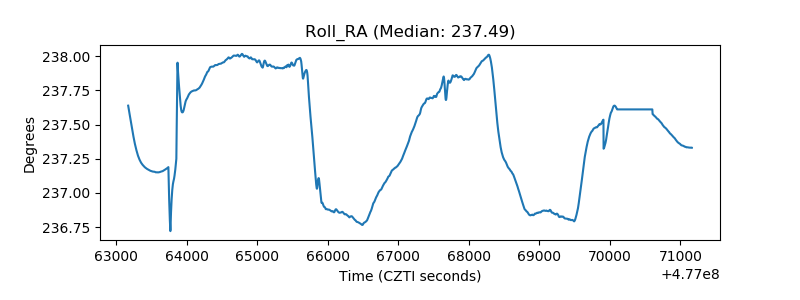 |
| Veto Counter | 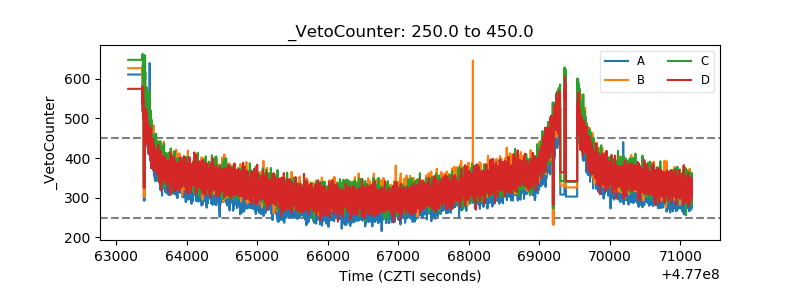 |