| Param | Original file | Final file |
|---|---|---|
| Filename | modeM0/AS1C07_001T01_9000006450_50909cztM0_level2.fits | modeM0/AS1C07_001T01_9000006450_50909cztM0_level2_quad_clean.evt |
| Size (bytes) | 678,240,000 | 90,633,600 |
| Size | 646.8 MB | 86.4 MB |
| Events in quadrant A | 12,721,436 | 407,659 |
| Events in quadrant B | 3,447,644 | 685,787 |
| Events in quadrant C | 4,766,613 | 595,539 |
| Events in quadrant D | 3,635,978 | 574,439 |
| Mode SS | |||
|---|---|---|---|
| Quadrant | BADHDUFLAG | Total packets | Discarded packets |
| A | 0 | 140 | 0 |
| B | 0 | 140 | 0 |
| C | 0 | 140 | 0 |
| D | 0 | 140 | 0 |
| Mode M0 | |||
|---|---|---|---|
| Quadrant | BADHDUFLAG | Total packets | Discarded packets |
| A | 0 | 42539 | 1 |
| B | 0 | 15256 | 1 |
| C | 0 | 18620 | 1 |
| D | 0 | 16083 | 1 |
| Mode M9 | |||
|---|---|---|---|
| Quadrant | BADHDUFLAG | Total packets | Discarded packets |
| A | 0 | 8 | 0 |
| B | 0 | 8 | 0 |
| C | 0 | 8 | 0 |
| D | 0 | 8 | 0 |
| Quadrant | Total seconds | Saturated seconds | Saturation percentage |
|---|---|---|---|
| A | 6896 | 3036 | 44.025522% |
| B | 6896 | 82 | 1.189095% |
| C | 6896 | 325 | 4.712877% |
| D | 6896 | 98 | 1.421114% |
Noise dominated data is calculated using 1-second bins in cleaned event files. If a bin has >2000 counts, and if more than 50% of those come from <1% of pixels, then it is considered to be noise-dominated and hence unusable.
| Quadrant | # 1 sec bins | Bins with >0 counts | Bins with >2000 counts | High rate bins dominated by noise | Noise dominated (total time) | Noise dominated (detector-on time) | Marked lightcurve |
|---|---|---|---|---|---|---|---|
| A | 7691 | 6896 | 2963 | 2963 | 38.53% | 42.97% | 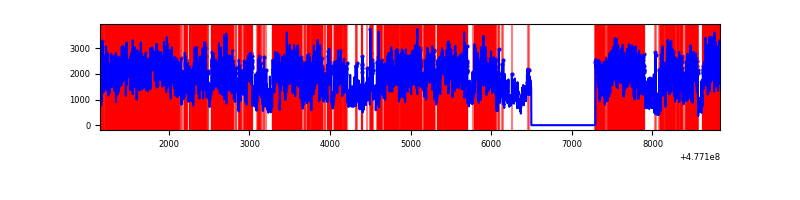 |
| B | 7691 | 6897 | 27 | 27 | 0.35% | 0.39% | 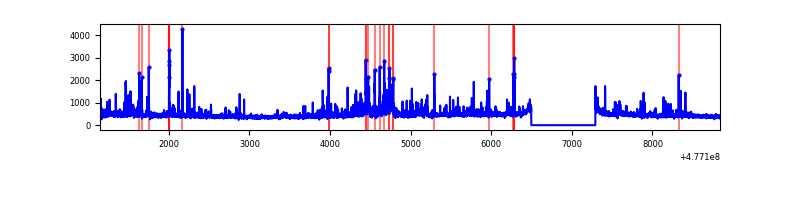 |
| C | 7691 | 6897 | 316 | 316 | 4.11% | 4.58% | 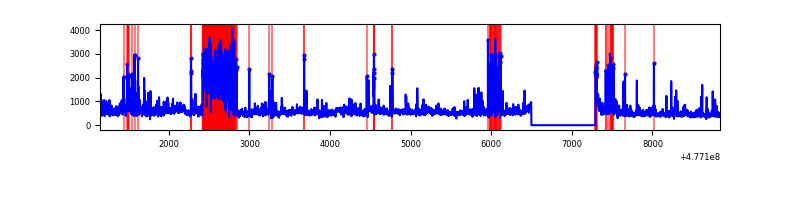 |
| D | 7691 | 6897 | 88 | 88 | 1.14% | 1.28% | 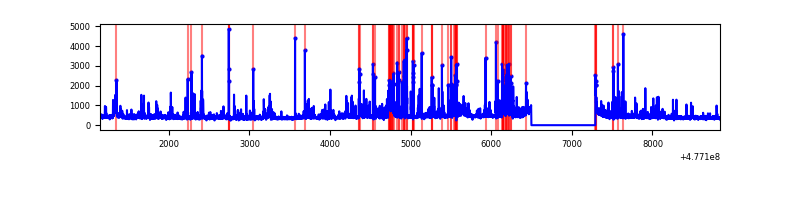 |
Top three noisy pixels from each quadrant. If the there are fewer than three noisy pixels in the level2.evt file, extra rows are filled as -1
| Pixel properties | Quadrant properties | ||||||
|---|---|---|---|---|---|---|---|
| Quadrant | DetID | PixID | Counts | Sigma | Mean | Median | Sigma |
| A | 4 | 4 | 9228626 | 56773.84 | 642 | 625 | 162.5 |
| A | 4 | 3 | 245238 | 1504.94 | 642 | 625 | 162.5 |
| A | 8 | 38 | 123845 | 758.09 | 642 | 625 | 162.5 |
| B | 4 | 81 | 251499 | 1633.04 | 714 | 689 | 153.6 |
| B | 8 | 128 | 87477 | 565.08 | 714 | 689 | 153.6 |
| B | 0 | 245 | 45335 | 290.69 | 714 | 689 | 153.6 |
| C | 12 | 252 | 721616 | 3804.56 | 685 | 678 | 189.5 |
| C | 12 | 247 | 354778 | 1868.67 | 685 | 678 | 189.5 |
| C | 3 | 233 | 354684 | 1868.17 | 685 | 678 | 189.5 |
| D | 2 | 249 | 429416 | 2237.7 | 685 | 662 | 191.6 |
| D | 2 | 120 | 48637 | 250.39 | 685 | 662 | 191.6 |
| D | 3 | 12 | 47912 | 246.6 | 685 | 662 | 191.6 |
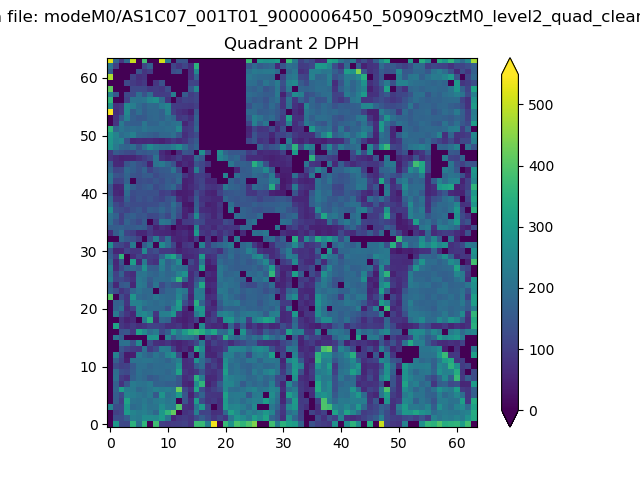
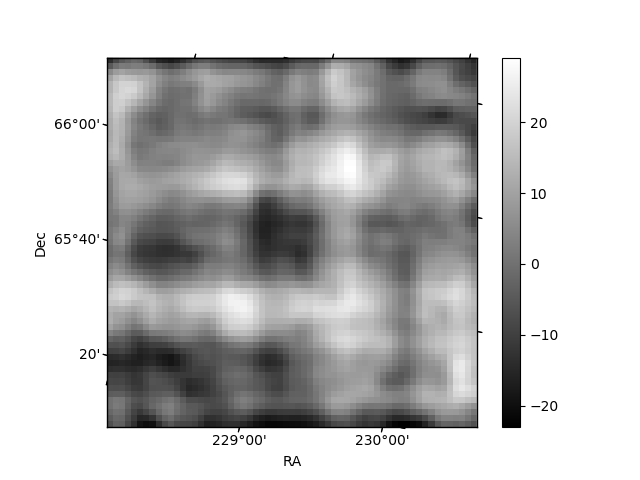
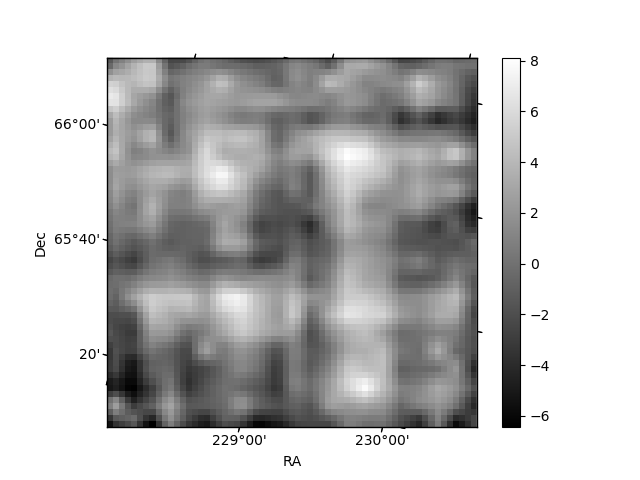
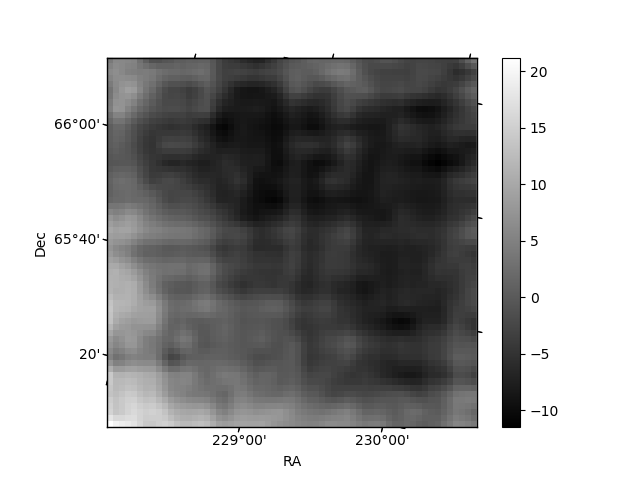
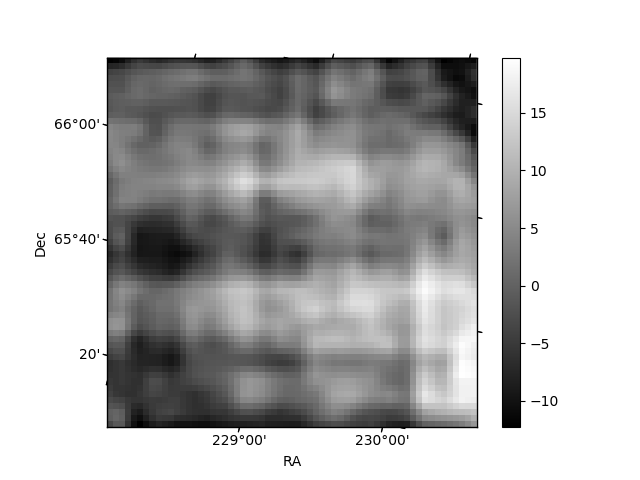
Histogram calculated using DETX and DETY for each event in the final _common_clean file
| Quadrant A | 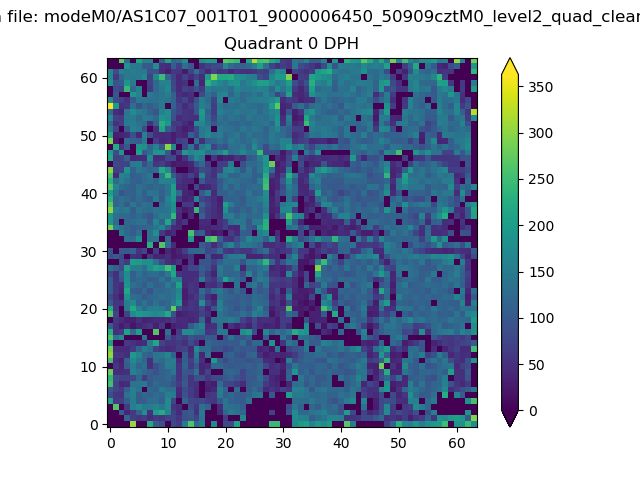 |
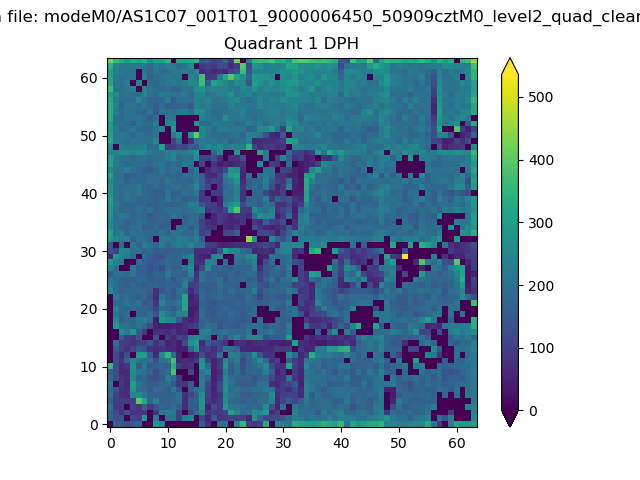 |
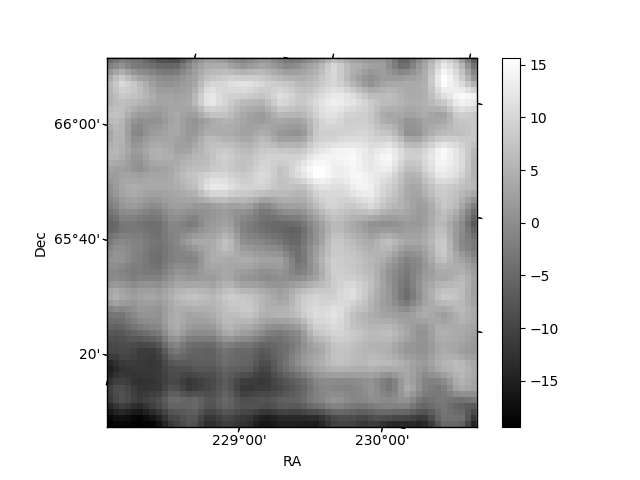
Quadrant B |
|---|---|---|---|
| Quadrant D | 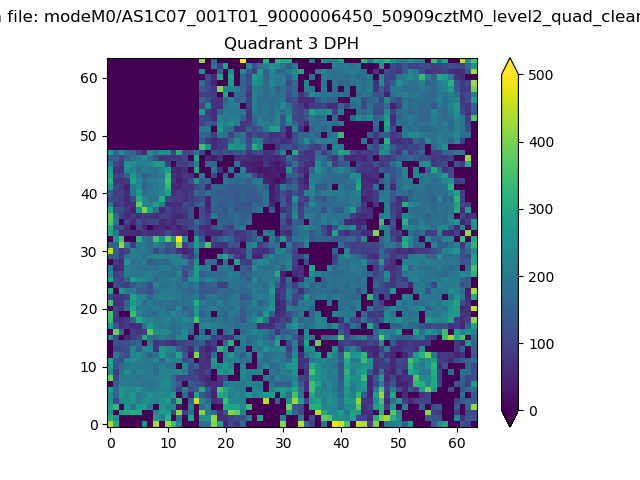 |
 |
Quadrant C |
| Plot type | Count rate plots | Images |
|---|---|---|
| Comparison with Poisson distribution Blue bars denote a histogram of data divided into 1 sec bins. Red curve is a Poisson curve with rate = median count rate of data. |
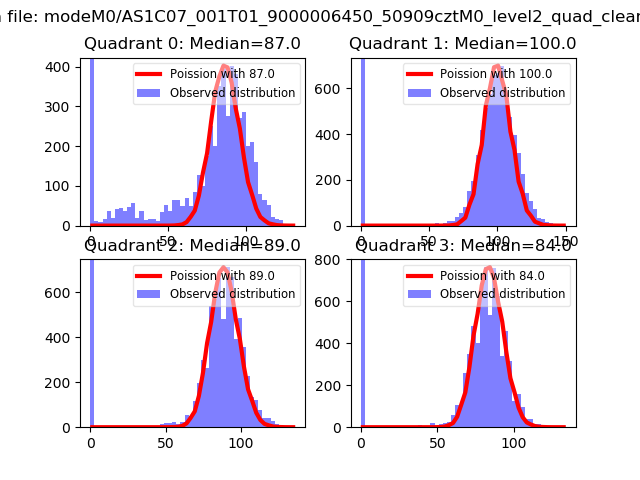 |
 |
| Quadrant-wise count rates Data is divided into 100 sec bins |
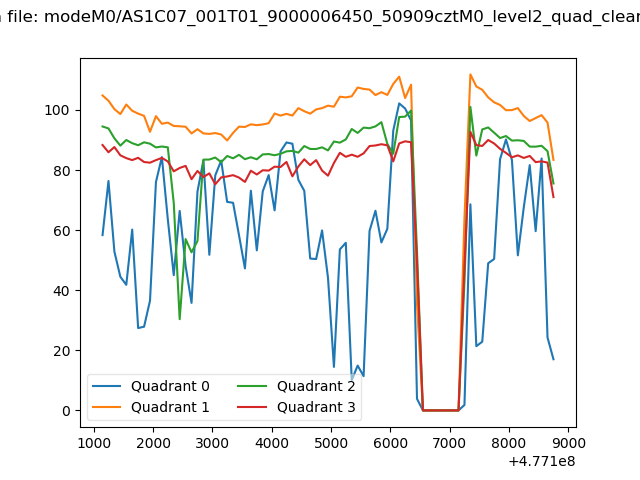 |
|
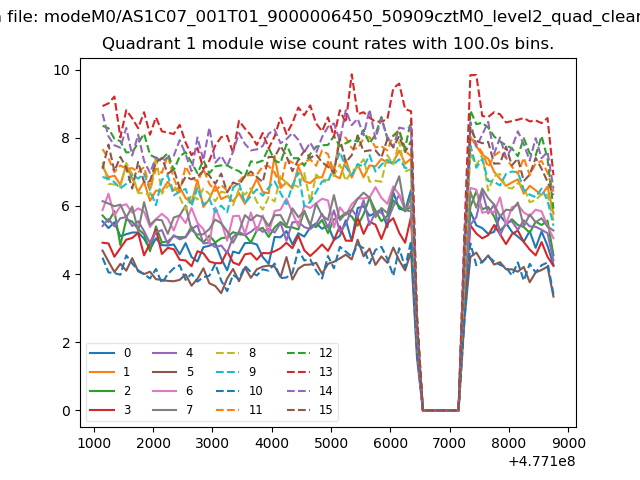
| Module-wise count rates for Quadrant A Data is divided into 100 sec bins |
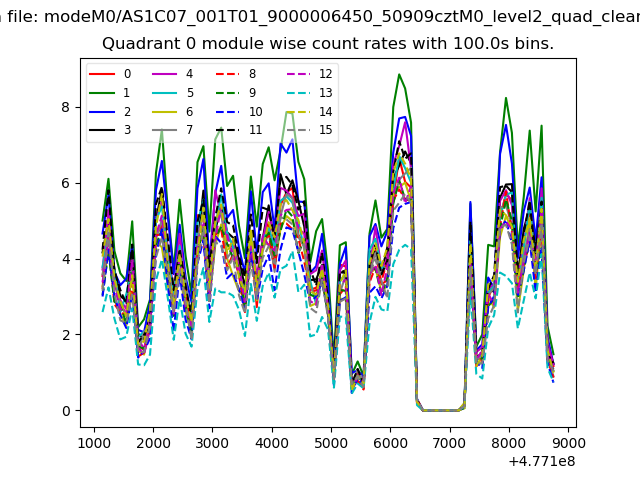 |
 |
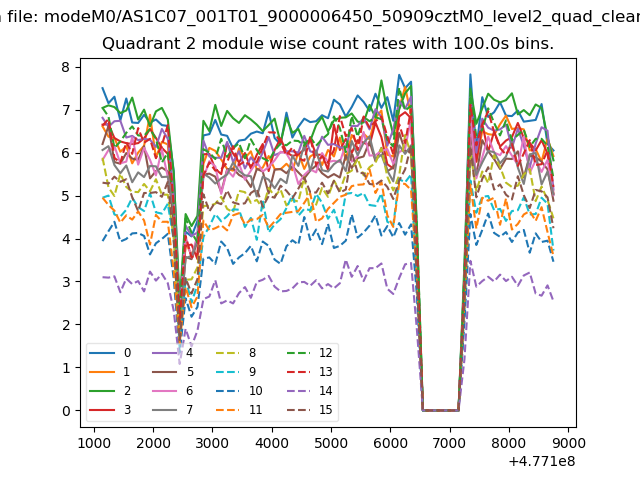
| Module-wise count rates for Quadrant B Data is divided into 100 sec bins |
 |
 |
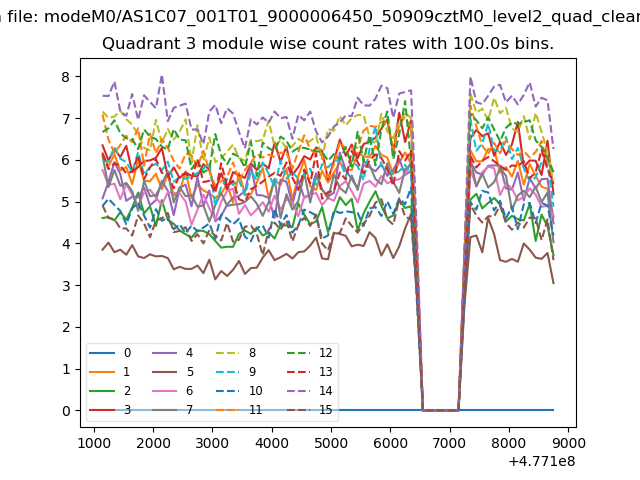
| Module-wise count rates for Quadrant C Data is divided into 100 sec bins |
 |
 |
| Module-wise count rates for Quadrant D Data is divided into 100 sec bins |
 |
 |
| Parameter | Plot |
|---|---|
| CZT HV Monitor | 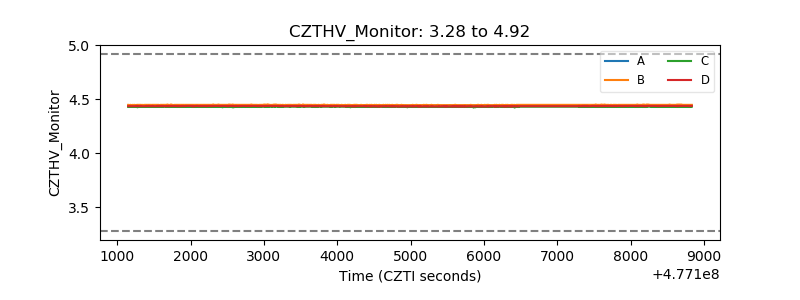 |
| D_VDD | 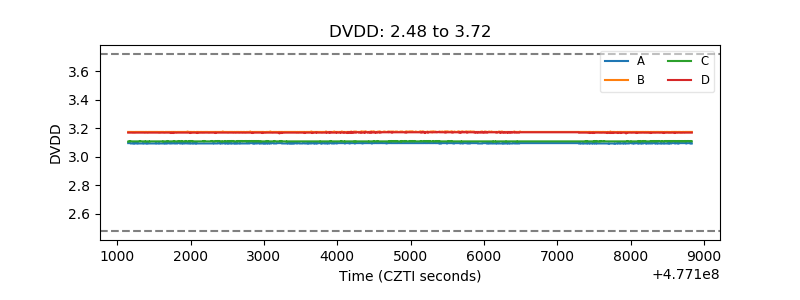 |
| Temperature 1 | 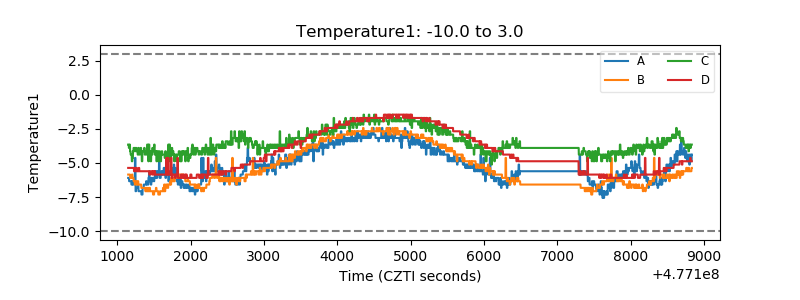 |
| Veto HV Monitor | 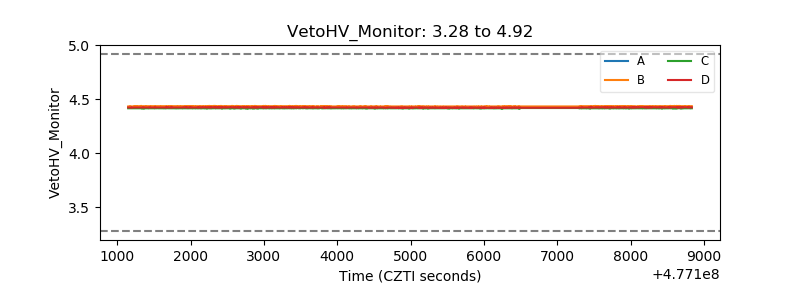 |
| Veto LLD | 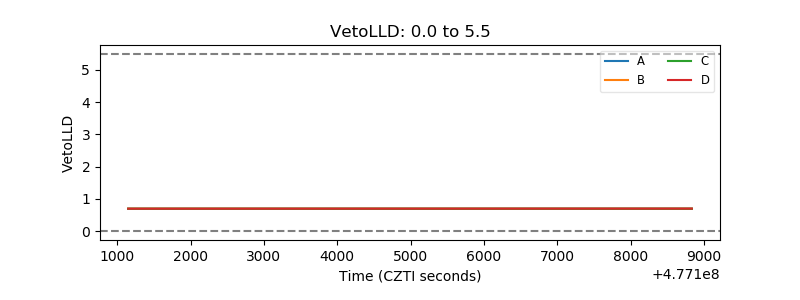 |
| Alpha Counter | 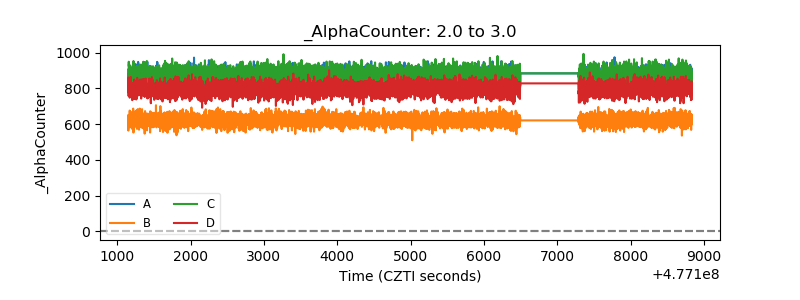 |
| _CPM_Rate | 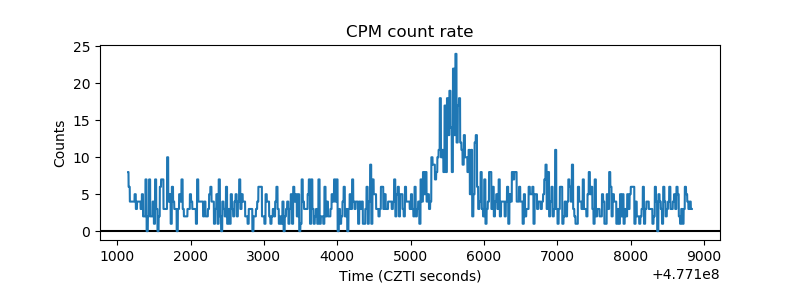 |
| CZT Counter | 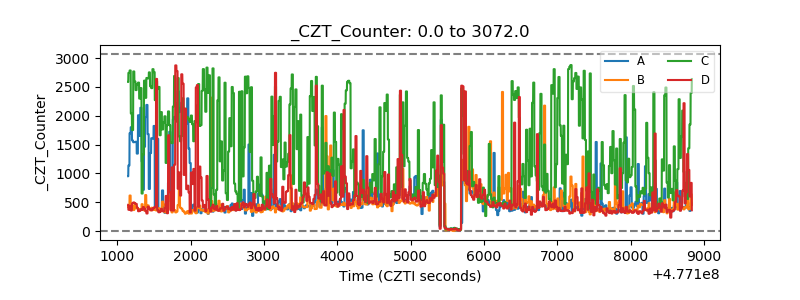 |
| +2.5 Volts monitor | 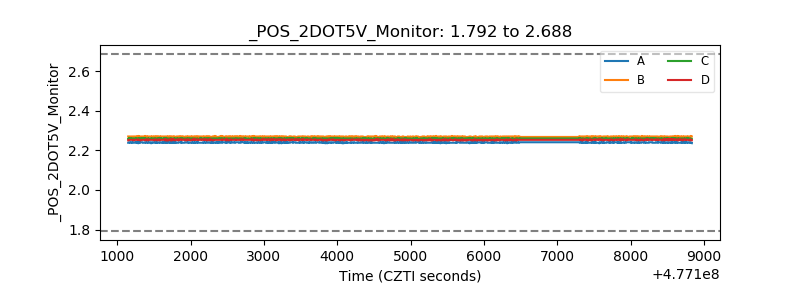 |
| +5 Volts monitor |  |
| _ROLL_ROT | 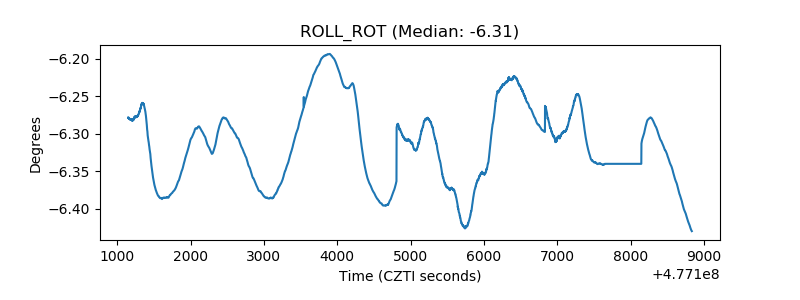 |
| _Roll_DEC | 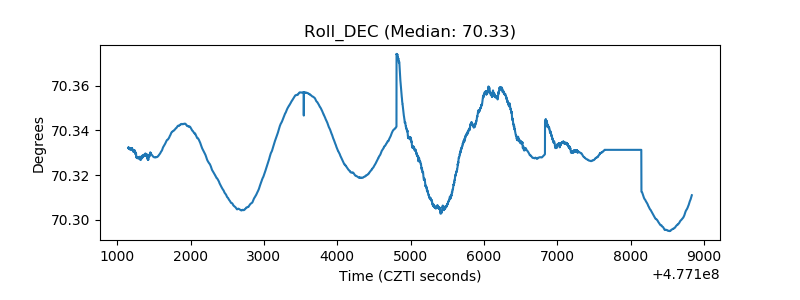 |
| _Roll_RA | 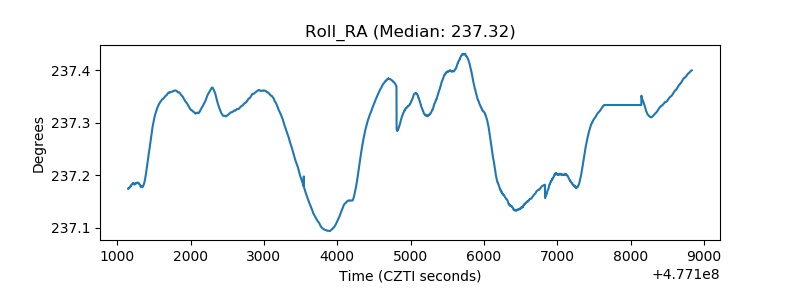 |
| Veto Counter | 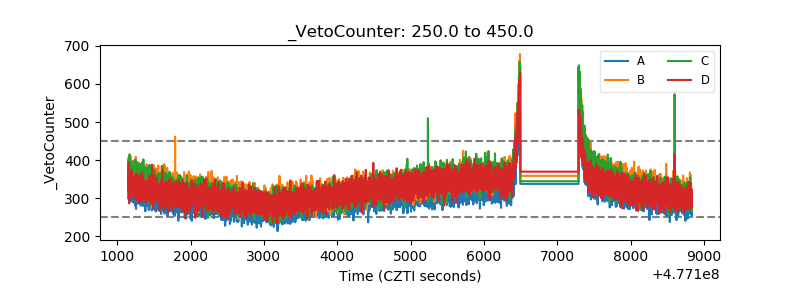 |