| Param | Original file | Final file |
|---|---|---|
| Filename | modeM0/AS1C07_001T01_9000006450_50910cztM0_level2.fits | modeM0/AS1C07_001T01_9000006450_50910cztM0_level2_quad_clean.evt |
| Size (bytes) | 644,250,240 | 75,660,480 |
| Size | 614.4 MB | 72.2 MB |
| Events in quadrant A | 12,237,173 | 251,911 |
| Events in quadrant B | 4,283,222 | 581,858 |
| Events in quadrant C | 3,359,487 | 541,589 |
| Events in quadrant D | 3,498,193 | 492,930 |
| Mode SS | |||
|---|---|---|---|
| Quadrant | BADHDUFLAG | Total packets | Discarded packets |
| A | 0 | 122 | 0 |
| B | 0 | 122 | 0 |
| C | 0 | 122 | 0 |
| D | 0 | 122 | 0 |
| Mode M0 | |||
|---|---|---|---|
| Quadrant | BADHDUFLAG | Total packets | Discarded packets |
| A | 0 | 40531 | 1 |
| B | 0 | 17207 | 6 |
| C | 0 | 14084 | 1 |
| D | 0 | 15003 | 1 |
| Mode M9 | |||
|---|---|---|---|
| Quadrant | BADHDUFLAG | Total packets | Discarded packets |
| A | 0 | 10 | 0 |
| B | 0 | 10 | 0 |
| C | 0 | 10 | 0 |
| D | 0 | 10 | 0 |
| Quadrant | Total seconds | Saturated seconds | Saturation percentage |
|---|---|---|---|
| A | 6050 | 3710 | 61.322314% |
| B | 6050 | 445 | 7.355372% |
| C | 6050 | 85 | 1.404959% |
| D | 6050 | 224 | 3.702479% |
Noise dominated data is calculated using 1-second bins in cleaned event files. If a bin has >2000 counts, and if more than 50% of those come from <1% of pixels, then it is considered to be noise-dominated and hence unusable.
| Quadrant | # 1 sec bins | Bins with >0 counts | Bins with >2000 counts | High rate bins dominated by noise | Noise dominated (total time) | Noise dominated (detector-on time) | Marked lightcurve |
|---|---|---|---|---|---|---|---|
| A | 7025 | 6050 | 3462 | 3462 | 49.28% | 57.22% | 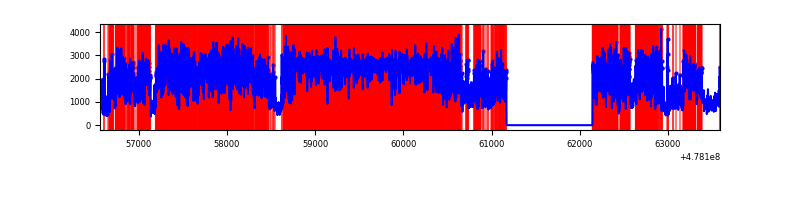 |
| B | 7025 | 6051 | 310 | 310 | 4.41% | 5.12% | 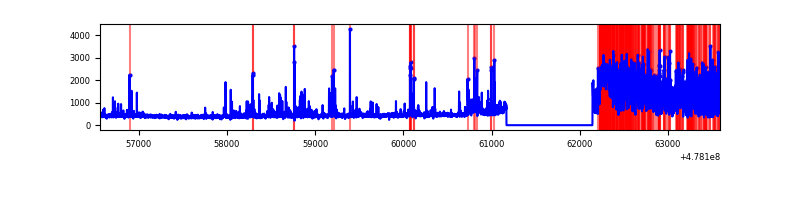 |
| C | 7025 | 6051 | 72 | 72 | 1.02% | 1.19% | 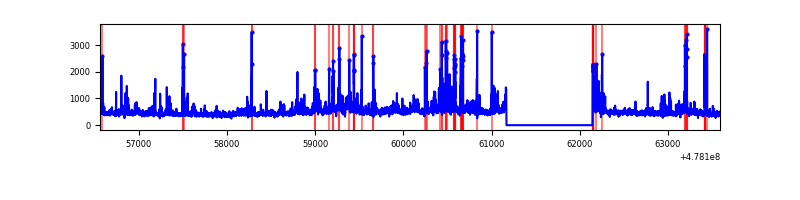 |
| D | 7025 | 6051 | 194 | 194 | 2.76% | 3.21% | 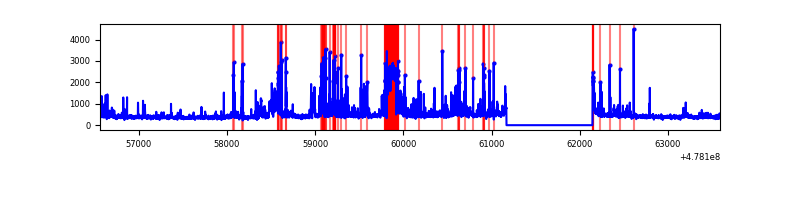 |
Top three noisy pixels from each quadrant. If the there are fewer than three noisy pixels in the level2.evt file, extra rows are filled as -1
| Pixel properties | Quadrant properties | ||||||
|---|---|---|---|---|---|---|---|
| Quadrant | DetID | PixID | Counts | Sigma | Mean | Median | Sigma |
| A | 4 | 4 | 9144801 | 73109.16 | 490 | 476 | 125.1 |
| A | 7 | 206 | 251813 | 2009.45 | 490 | 476 | 125.1 |
| A | 7 | 207 | 244630 | 1952.02 | 490 | 476 | 125.1 |
| B | 4 | 170 | 1510775 | 11455.13 | 613 | 594 | 131.8 |
| B | 10 | 247 | 75009 | 564.46 | 613 | 594 | 131.8 |
| B | 8 | 128 | 69205 | 520.43 | 613 | 594 | 131.8 |
| C | 3 | 233 | 175761 | 1044.21 | 606 | 601 | 167.7 |
| C | 12 | 247 | 164589 | 977.61 | 606 | 601 | 167.7 |
| C | 13 | 3 | 155478 | 923.3 | 606 | 601 | 167.7 |
| D | 2 | 249 | 597529 | 3564.65 | 591 | 569 | 167.5 |
| D | 0 | 113 | 117548 | 698.52 | 591 | 569 | 167.5 |
| D | 3 | 12 | 101116 | 600.4 | 591 | 569 | 167.5 |
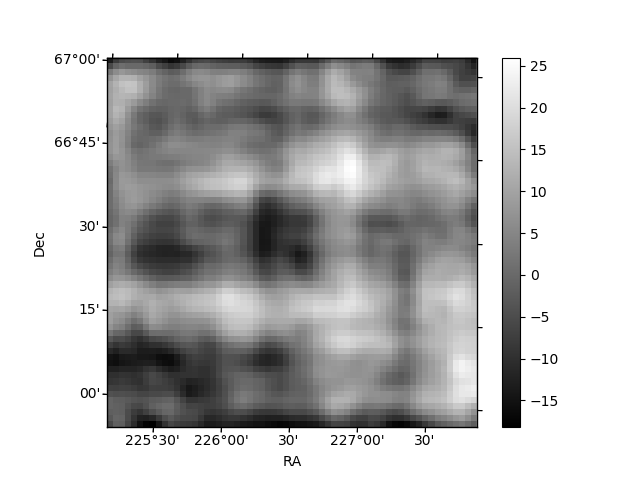
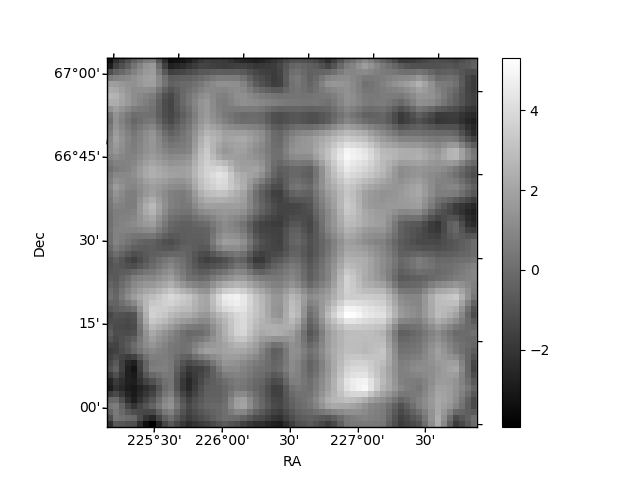
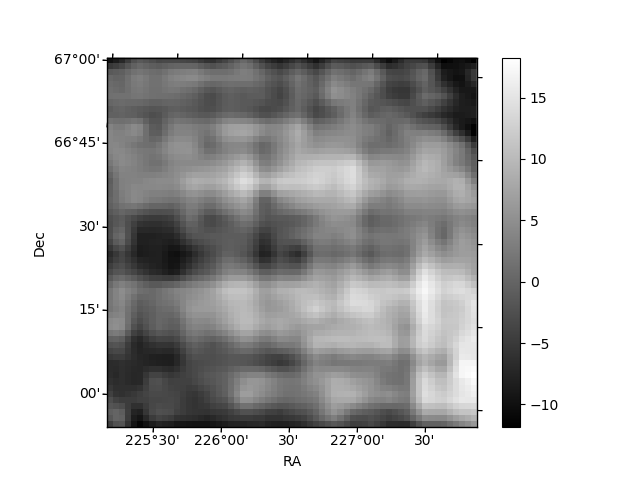
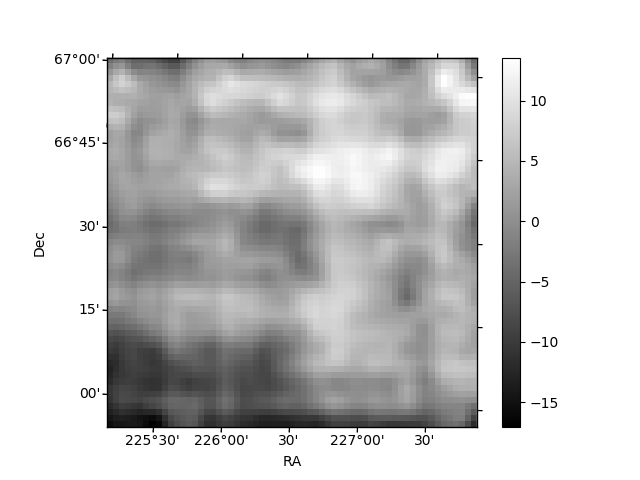
Histogram calculated using DETX and DETY for each event in the final _common_clean file
| Quadrant A | 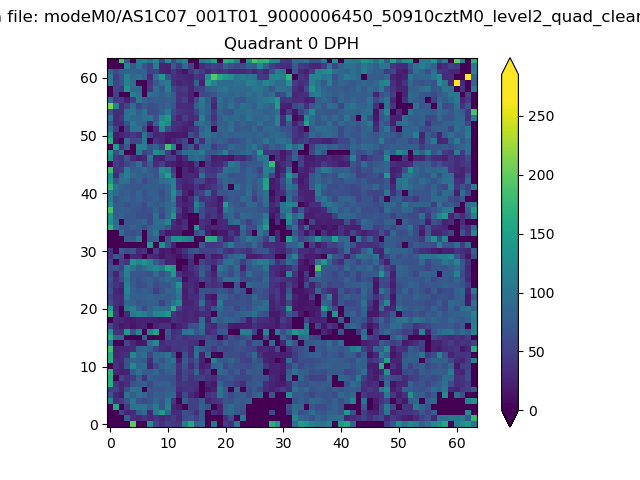 |
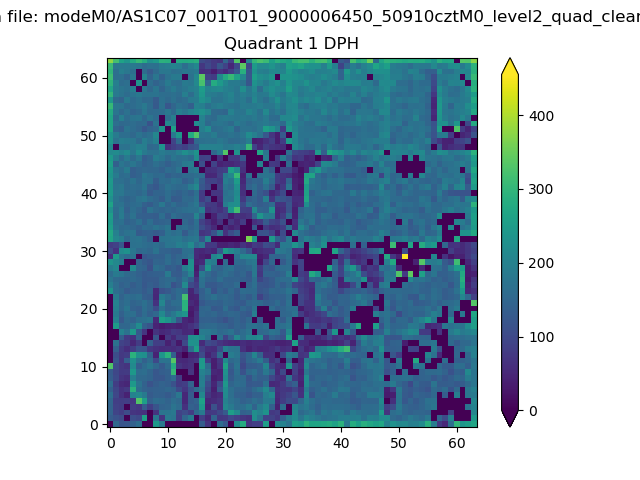 |
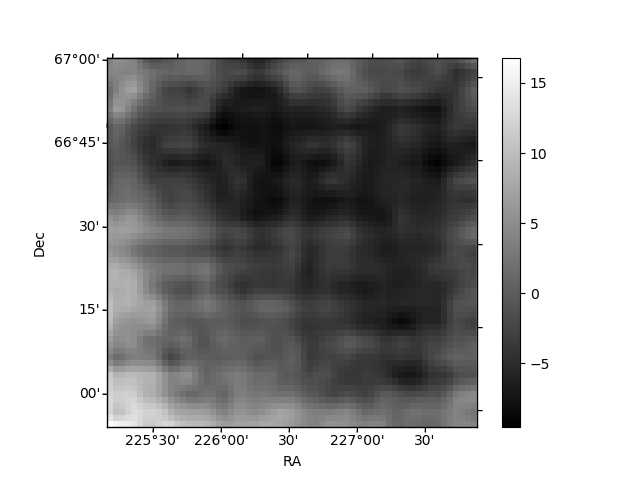
Quadrant B |
|---|---|---|---|
| Quadrant D | 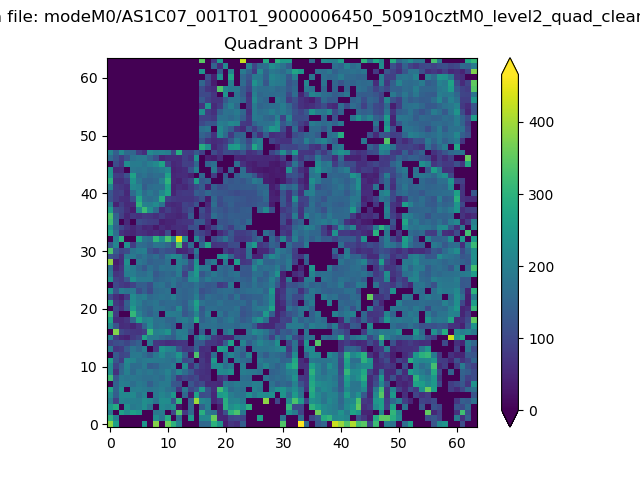 |
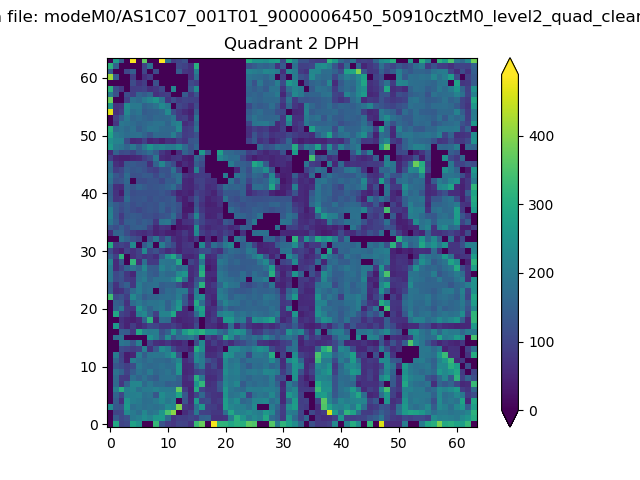 |
Quadrant C |
| Plot type | Count rate plots | Images |
|---|---|---|
| Comparison with Poisson distribution Blue bars denote a histogram of data divided into 1 sec bins. Red curve is a Poisson curve with rate = median count rate of data. |
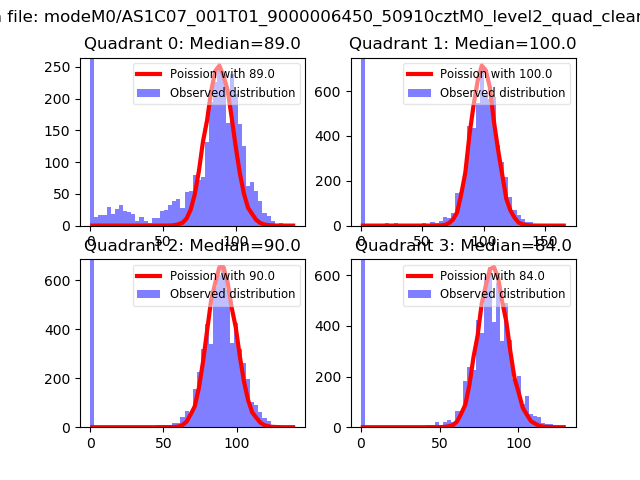 |
 |
| Quadrant-wise count rates Data is divided into 100 sec bins |
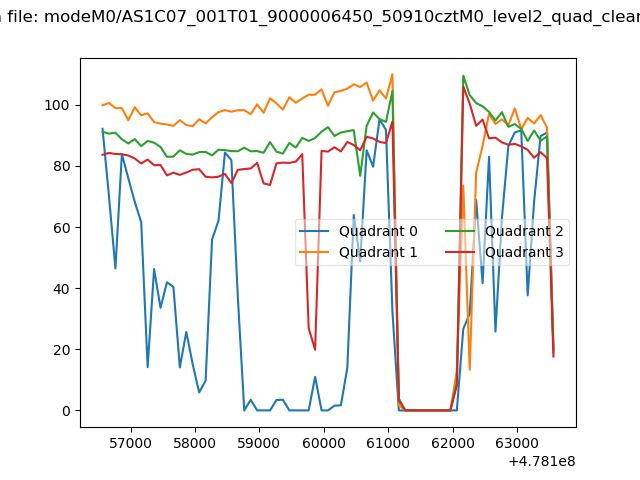 |
|
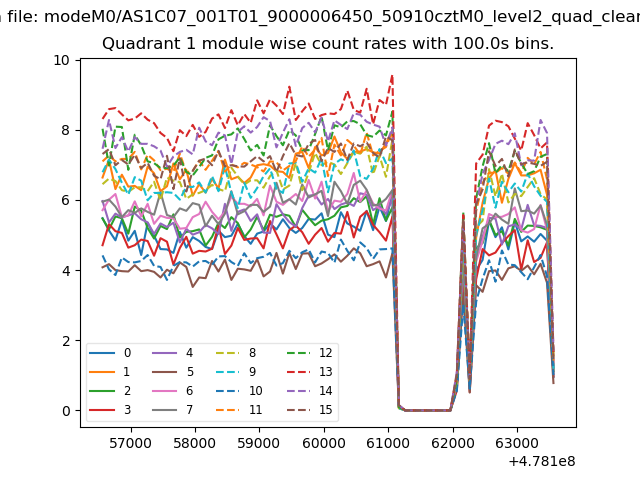
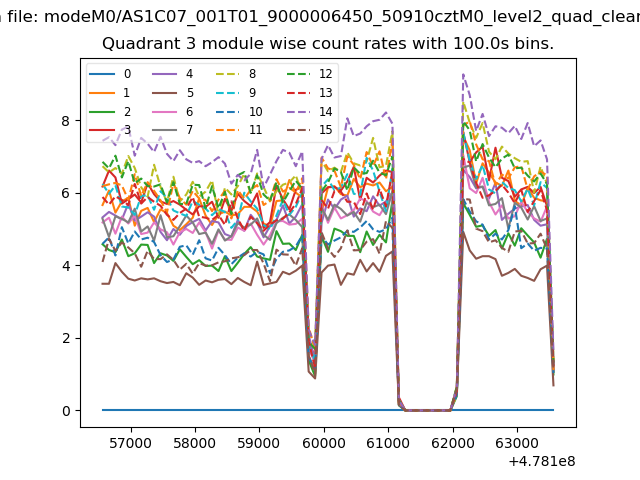
| Module-wise count rates for Quadrant A Data is divided into 100 sec bins |
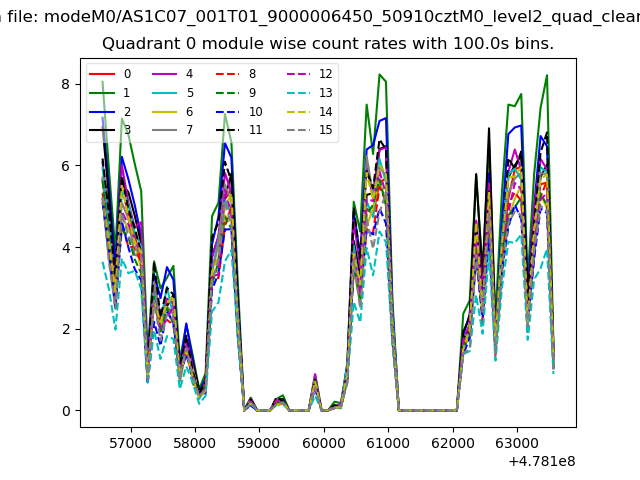 |
 |
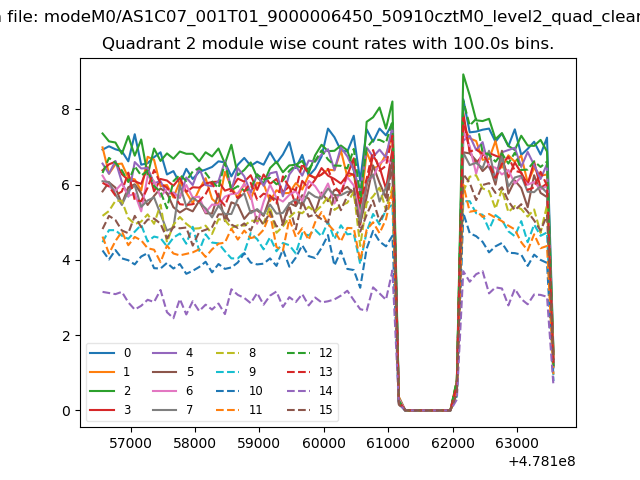
| Module-wise count rates for Quadrant B Data is divided into 100 sec bins |
 |
 |
| Module-wise count rates for Quadrant C Data is divided into 100 sec bins |
 |
 |
| Module-wise count rates for Quadrant D Data is divided into 100 sec bins |
 |
 |
| Parameter | Plot |
|---|---|
| CZT HV Monitor |  |
| D_VDD | 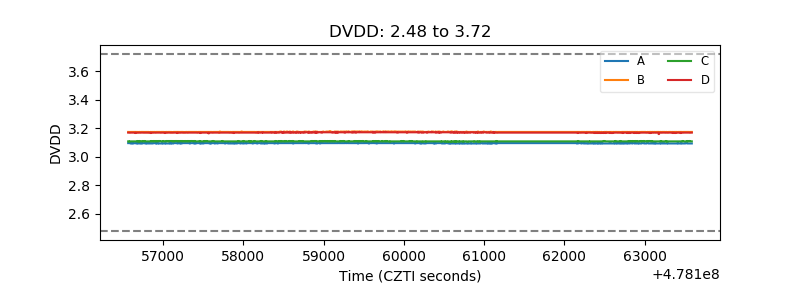 |
| Temperature 1 | 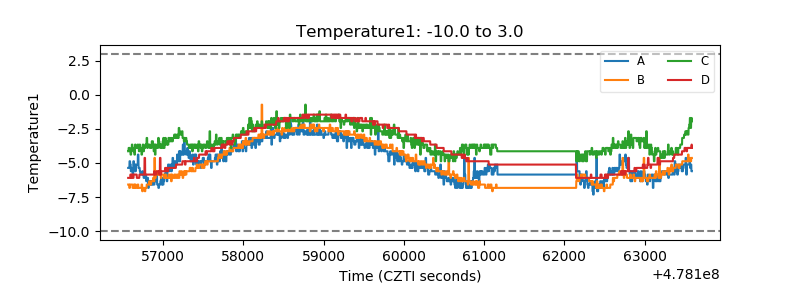 |
| Veto HV Monitor | 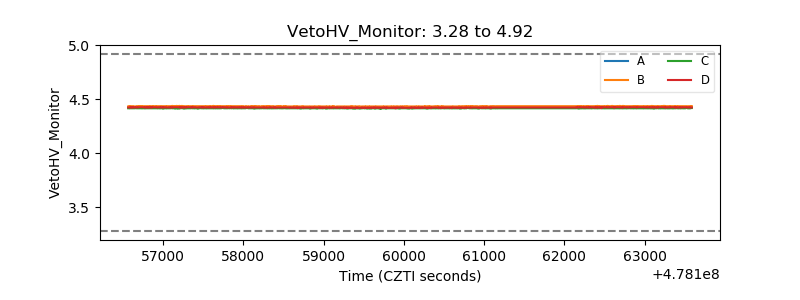 |
| Veto LLD | 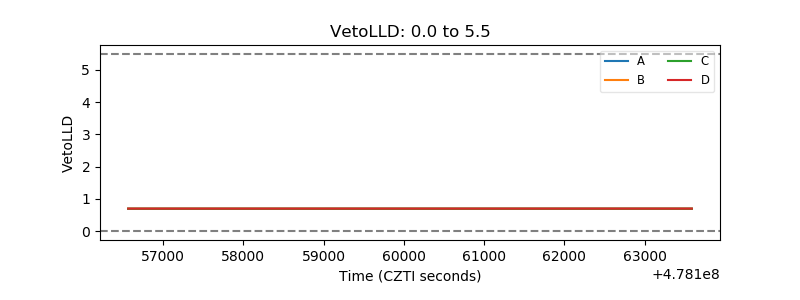 |
| Alpha Counter | 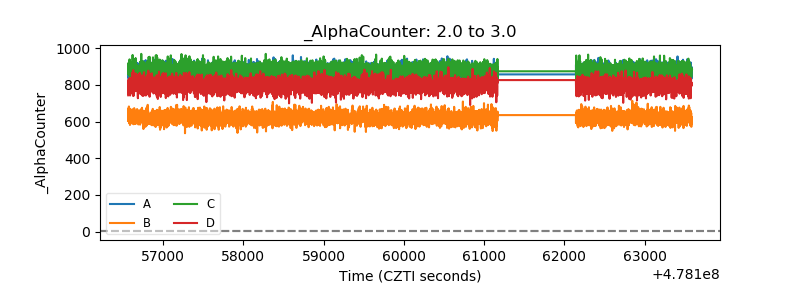 |
| _CPM_Rate | 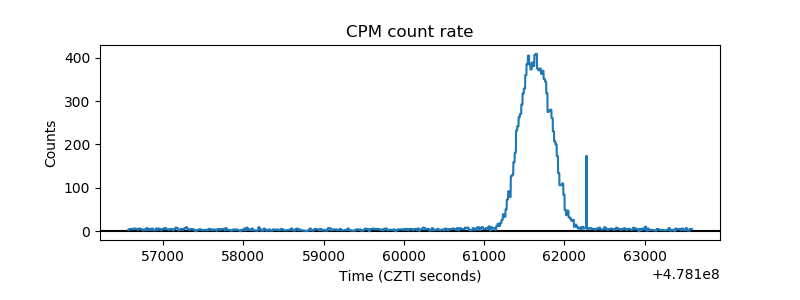 |
| CZT Counter | 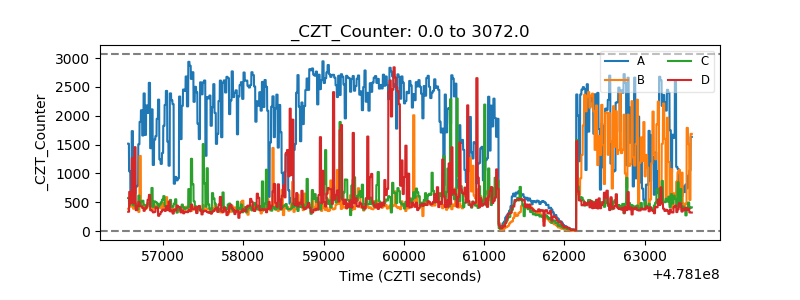 |
| +2.5 Volts monitor | 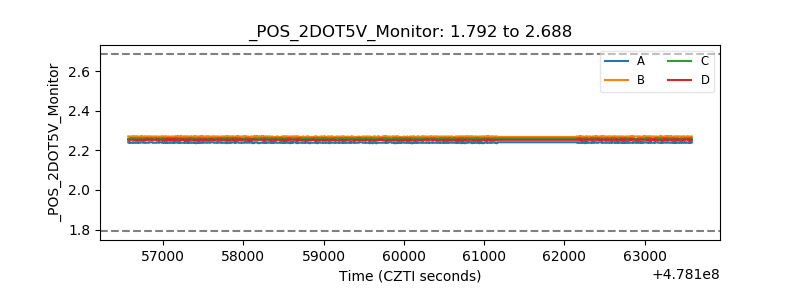 |
| +5 Volts monitor | 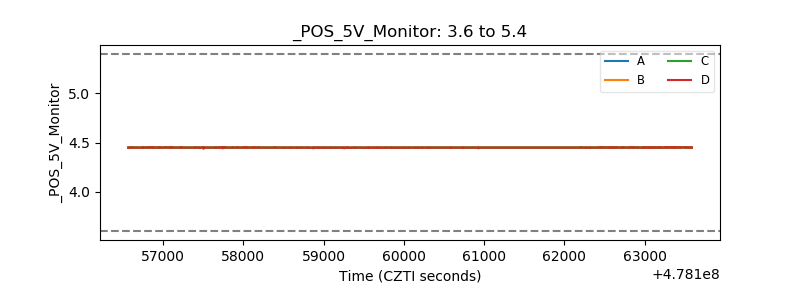 |
| _ROLL_ROT | 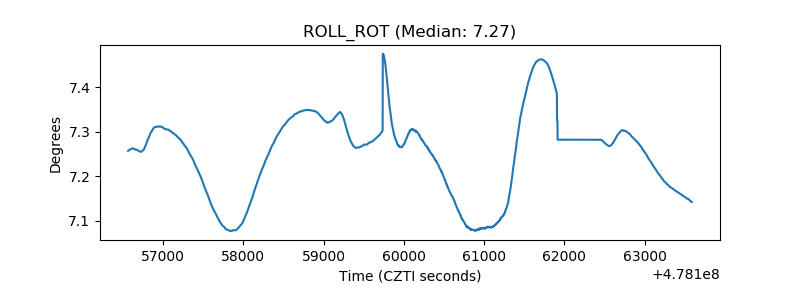 |
| _Roll_DEC |  |
| _Roll_RA | 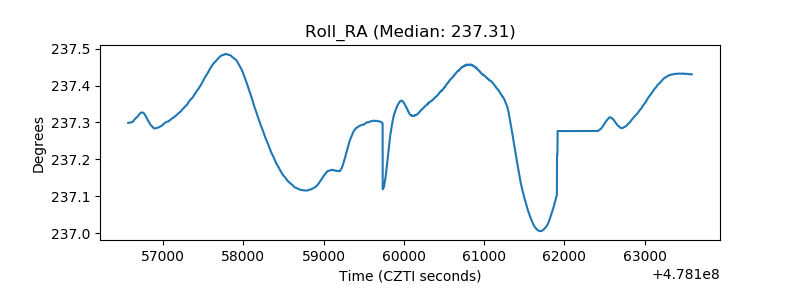 |
| Veto Counter | 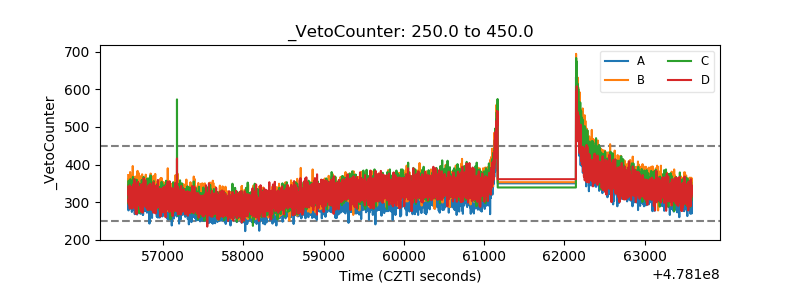 |