| Param | Original file | Final file |
|---|---|---|
| Filename | modeM0/AS1C07_001T01_9000006450_50916cztM0_level2.fits | modeM0/AS1C07_001T01_9000006450_50916cztM0_level2_quad_clean.evt |
| Size (bytes) | 681,739,200 | 77,310,720 |
| Size | 650.2 MB | 73.7 MB |
| Events in quadrant A | 10,625,734 | 361,034 |
| Events in quadrant B | 2,910,425 | 626,773 |
| Events in quadrant C | 4,557,603 | 536,037 |
| Events in quadrant D | 6,667,075 | 389,716 |
| Mode SS | |||
|---|---|---|---|
| Quadrant | BADHDUFLAG | Total packets | Discarded packets |
| A | 0 | 124 | 0 |
| B | 0 | 124 | 0 |
| C | 0 | 124 | 0 |
| D | 0 | 124 | 0 |
| Mode M0 | |||
|---|---|---|---|
| Quadrant | BADHDUFLAG | Total packets | Discarded packets |
| A | 0 | 35838 | 1 |
| B | 0 | 13132 | 1 |
| C | 0 | 17670 | 1 |
| D | 0 | 24010 | 2 |
| Mode M9 | |||
|---|---|---|---|
| Quadrant | BADHDUFLAG | Total packets | Discarded packets |
| A | 0 | 10 | 0 |
| B | 0 | 10 | 0 |
| C | 0 | 10 | 0 |
| D | 0 | 10 | 0 |
| Quadrant | Total seconds | Saturated seconds | Saturation percentage |
|---|---|---|---|
| A | 6118 | 2674 | 43.707094% |
| B | 6118 | 151 | 2.468127% |
| C | 6119 | 347 | 5.670861% |
| D | 6118 | 1702 | 27.819549% |
Noise dominated data is calculated using 1-second bins in cleaned event files. If a bin has >2000 counts, and if more than 50% of those come from <1% of pixels, then it is considered to be noise-dominated and hence unusable.
| Quadrant | # 1 sec bins | Bins with >0 counts | Bins with >2000 counts | High rate bins dominated by noise | Noise dominated (total time) | Noise dominated (detector-on time) | Marked lightcurve |
|---|---|---|---|---|---|---|---|
| A | 7067 | 6117 | 2400 | 2400 | 33.96% | 39.23% | 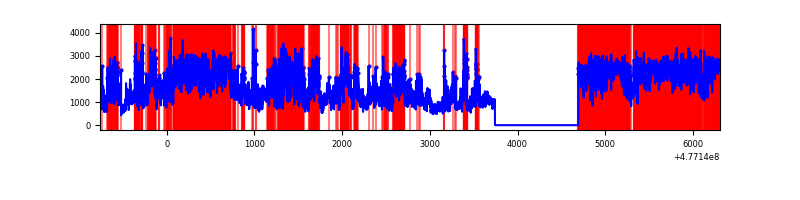 |
| B | 7068 | 6118 | 12 | 12 | 0.17% | 0.20% | 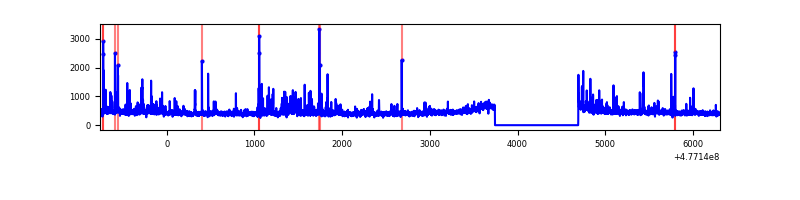 |
| C | 7069 | 6119 | 212 | 212 | 3.00% | 3.46% | 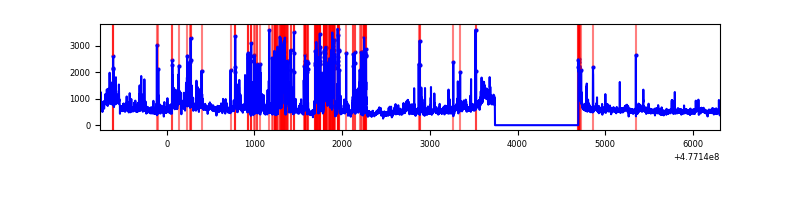 |
| D | 7068 | 6118 | 945 | 945 | 13.37% | 15.45% | 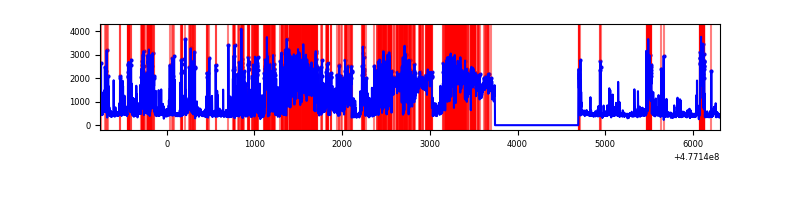 |
Top three noisy pixels from each quadrant. If the there are fewer than three noisy pixels in the level2.evt file, extra rows are filled as -1
| Pixel properties | Quadrant properties | ||||||
|---|---|---|---|---|---|---|---|
| Quadrant | DetID | PixID | Counts | Sigma | Mean | Median | Sigma |
| A | 4 | 4 | 6387685 | 45011.23 | 563 | 550 | 141.9 |
| A | 14 | 254 | 515282 | 3627.4 | 563 | 550 | 141.9 |
| A | 3 | 130 | 231090 | 1624.65 | 563 | 550 | 141.9 |
| B | 8 | 128 | 70088 | 503.37 | 649 | 626 | 138.0 |
| B | 10 | 237 | 38505 | 274.49 | 649 | 626 | 138.0 |
| B | 0 | 245 | 37631 | 268.16 | 649 | 626 | 138.0 |
| C | 12 | 247 | 779869 | 4544.11 | 630 | 624 | 171.5 |
| C | 4 | 5 | 754415 | 4395.68 | 630 | 624 | 171.5 |
| C | 0 | 145 | 79732 | 461.31 | 630 | 624 | 171.5 |
| D | 7 | 45 | 2867621 | 18888.91 | 543 | 523 | 151.8 |
| D | 2 | 249 | 490798 | 3230.01 | 543 | 523 | 151.8 |
| D | 6 | 42 | 473614 | 3116.8 | 543 | 523 | 151.8 |
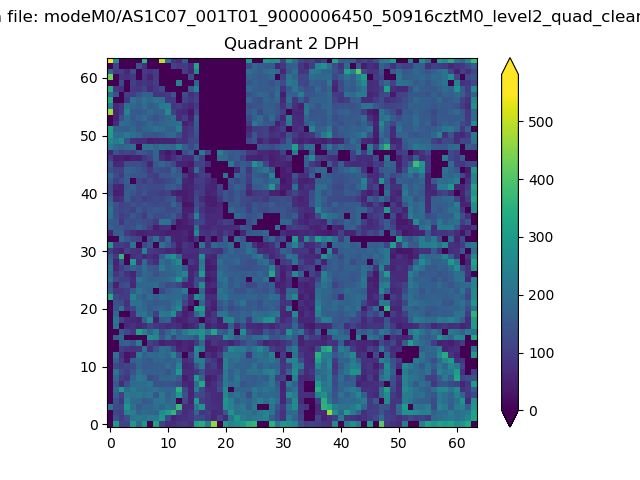
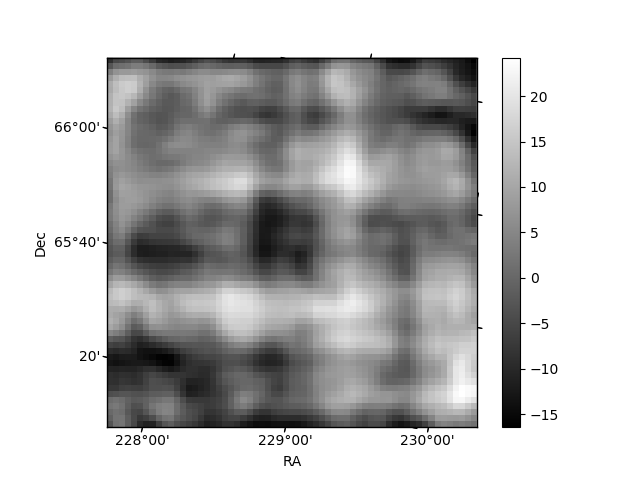
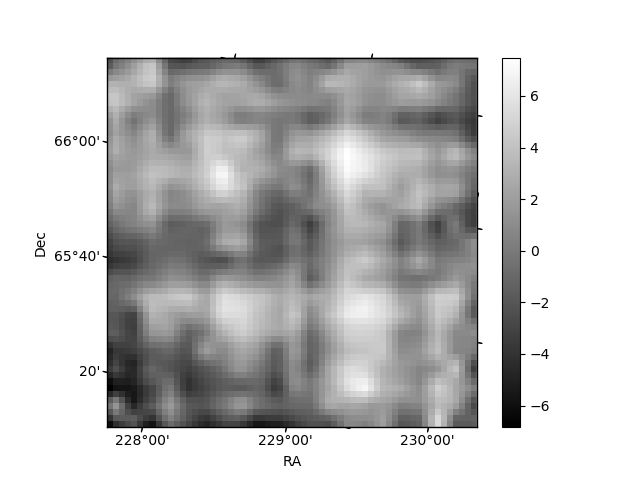
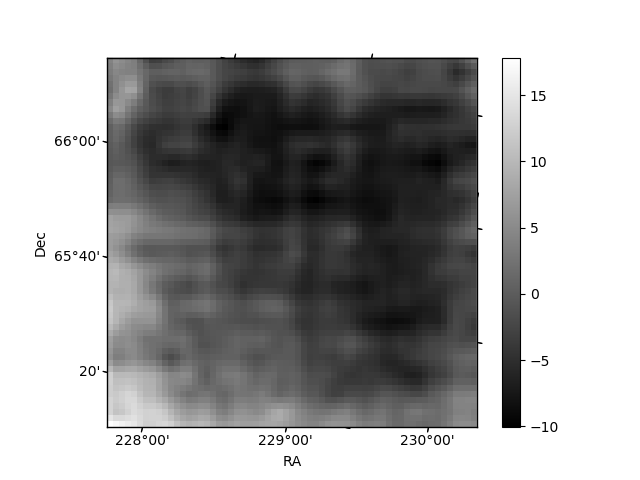
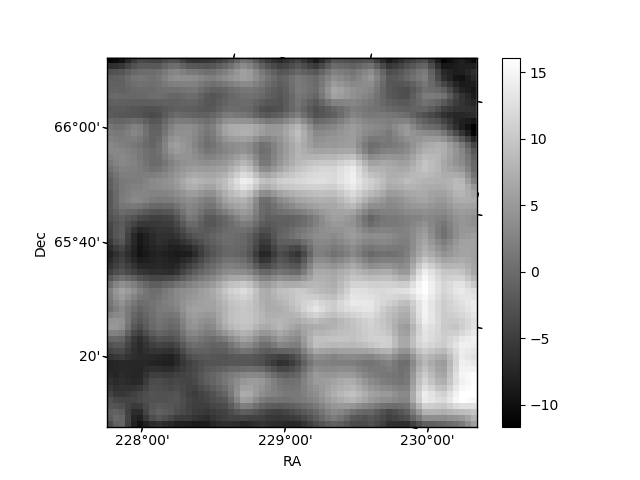
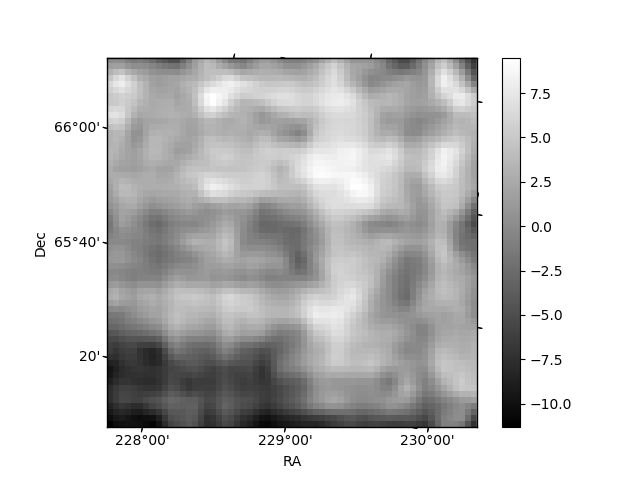
Histogram calculated using DETX and DETY for each event in the final _common_clean file
| Quadrant A | 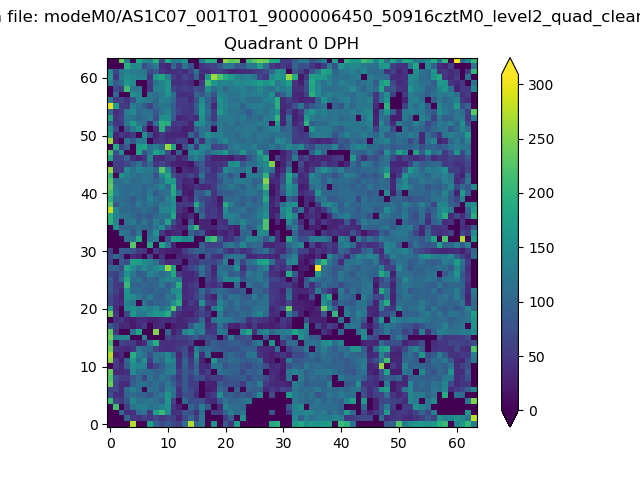 |
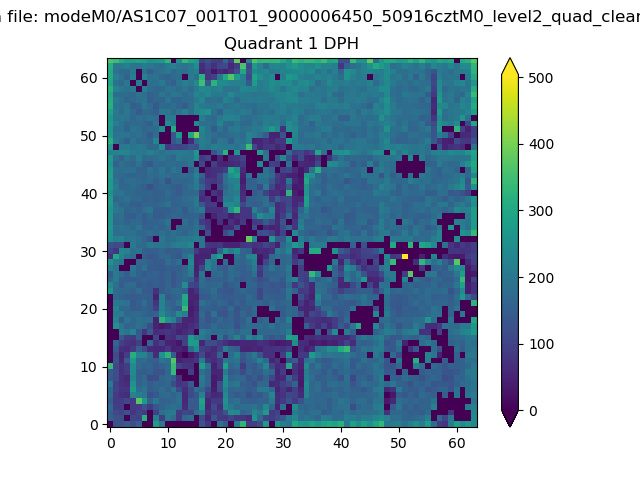 |
Quadrant B |
|---|---|---|---|
| Quadrant D | 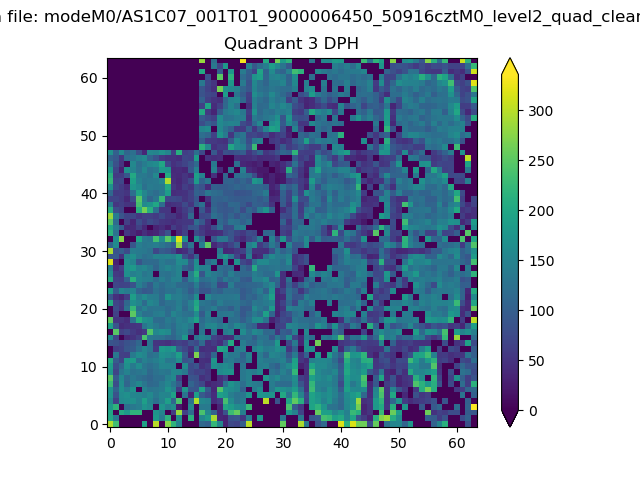 |
 |
Quadrant C |
| Plot type | Count rate plots | Images |
|---|---|---|
| Comparison with Poisson distribution Blue bars denote a histogram of data divided into 1 sec bins. Red curve is a Poisson curve with rate = median count rate of data. |
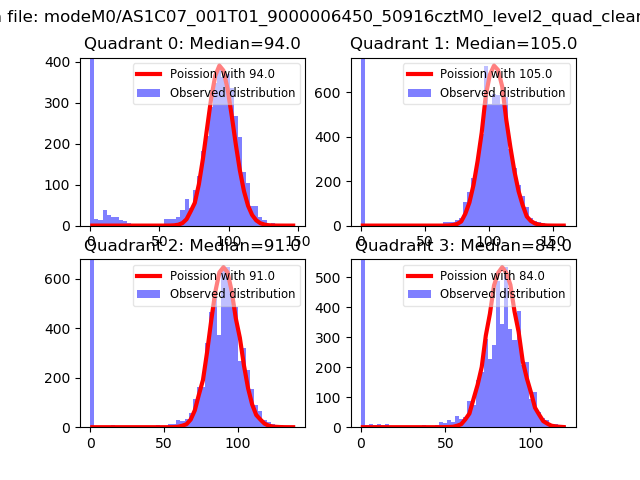 |
 |
| Quadrant-wise count rates Data is divided into 100 sec bins |
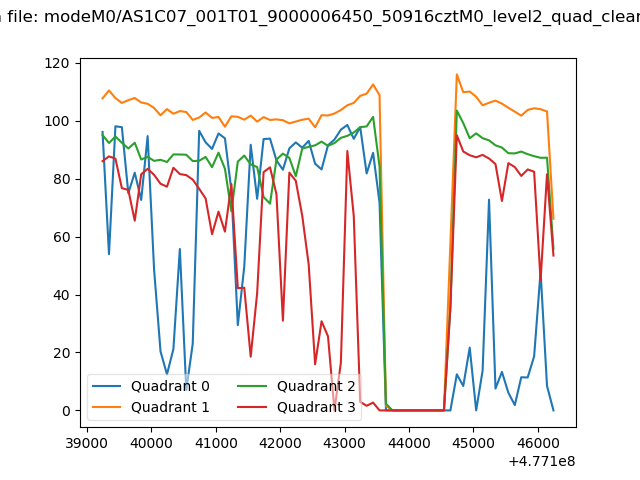 |
|
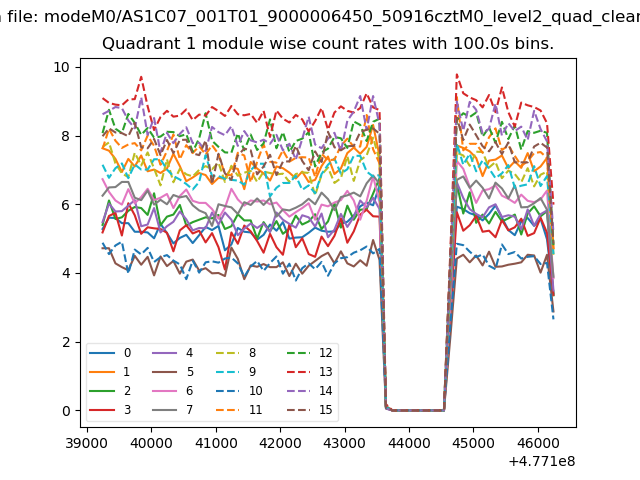
| Module-wise count rates for Quadrant A Data is divided into 100 sec bins |
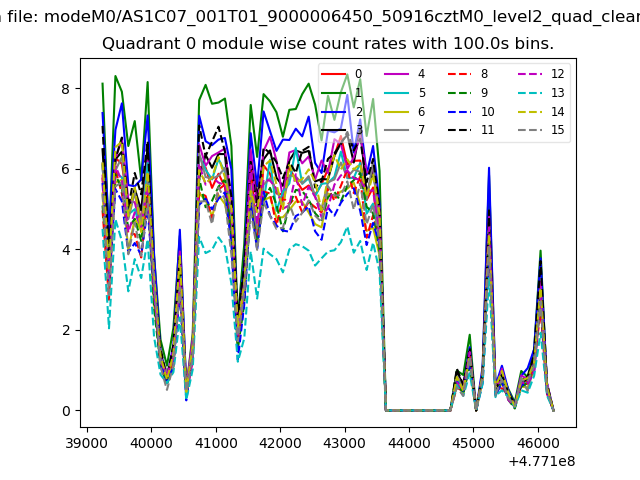 |
 |
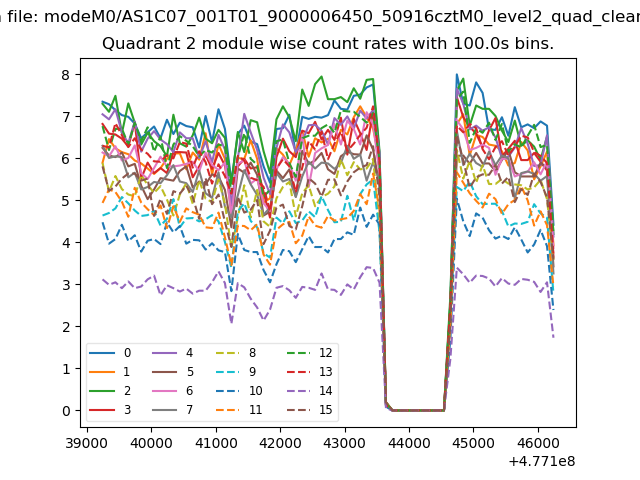
| Module-wise count rates for Quadrant B Data is divided into 100 sec bins |
 |
 |
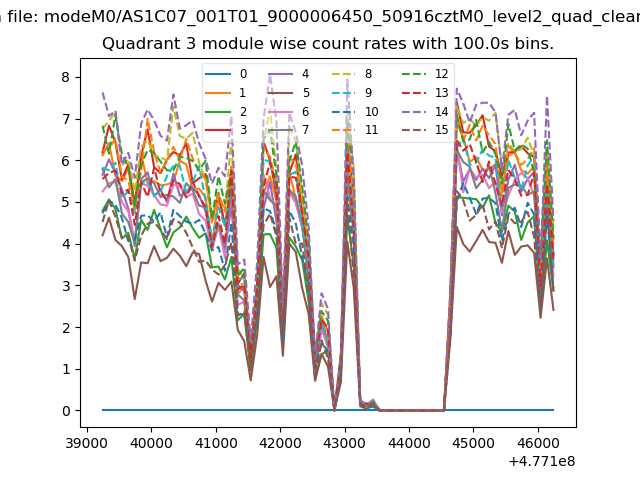
| Module-wise count rates for Quadrant C Data is divided into 100 sec bins |
 |
 |
| Module-wise count rates for Quadrant D Data is divided into 100 sec bins |
 |
 |
| Parameter | Plot |
|---|---|
| CZT HV Monitor | 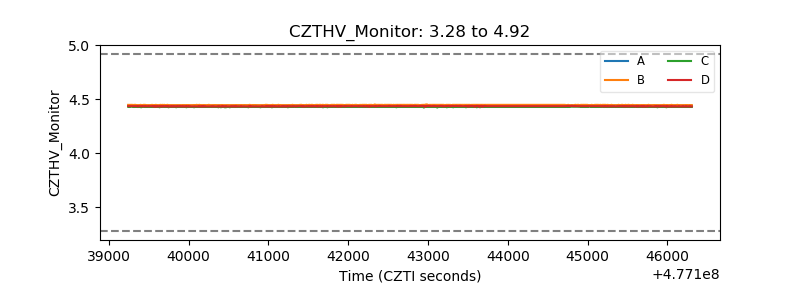 |
| D_VDD | 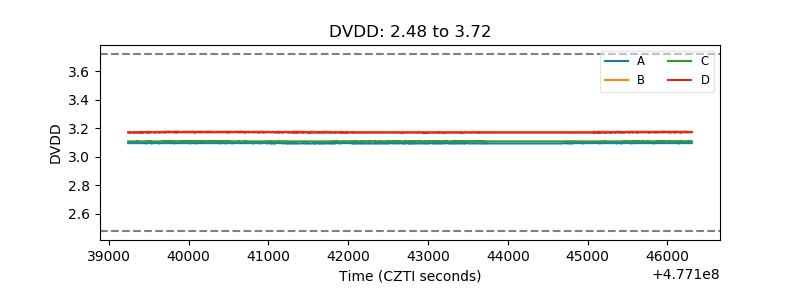 |
| Temperature 1 | 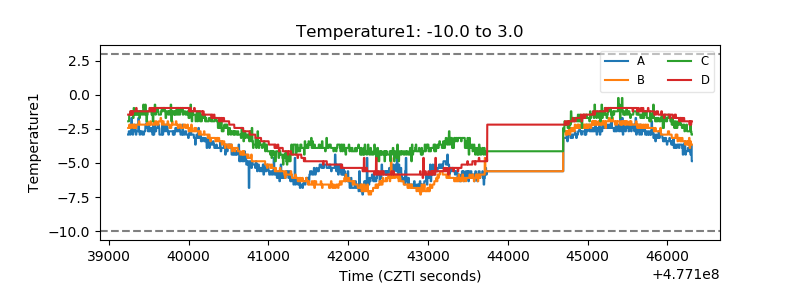 |
| Veto HV Monitor |  |
| Veto LLD | 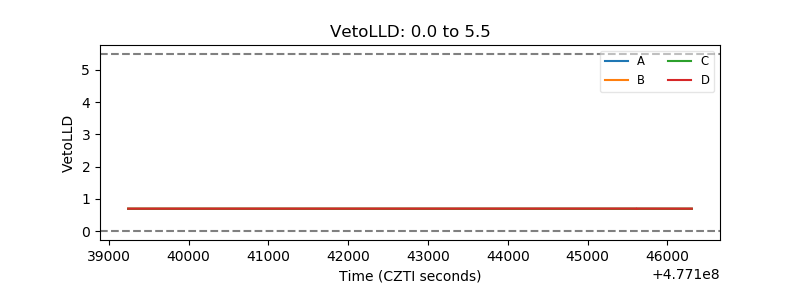 |
| Alpha Counter | 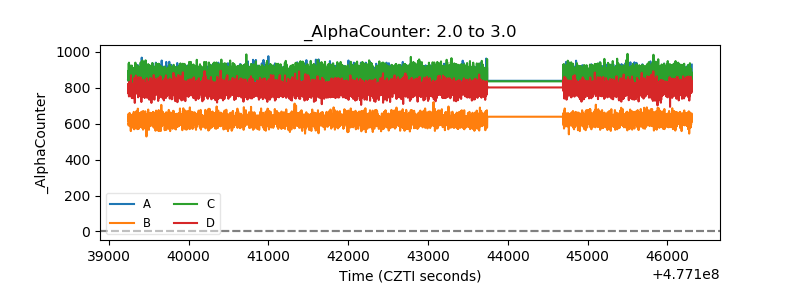 |
| _CPM_Rate | 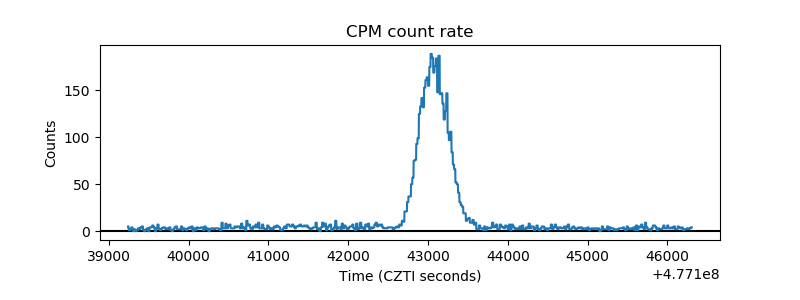 |
| CZT Counter | 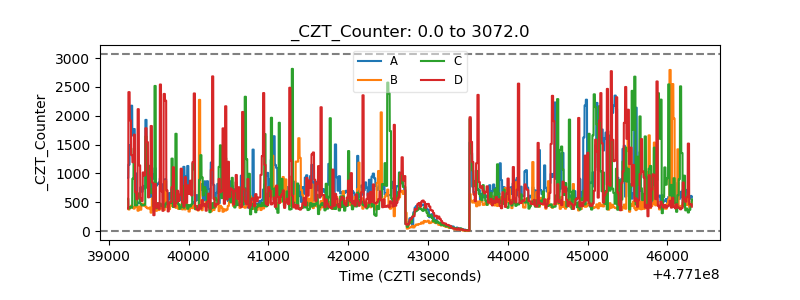 |
| +2.5 Volts monitor | 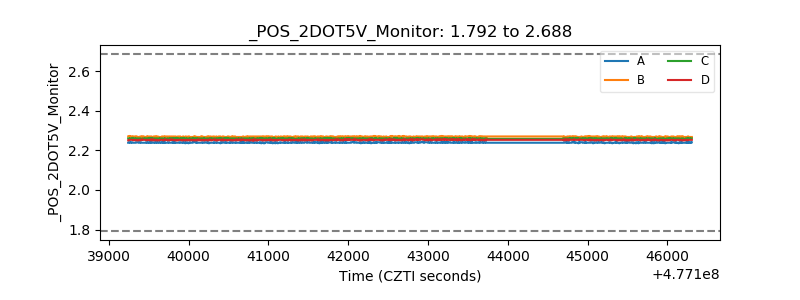 |
| +5 Volts monitor | 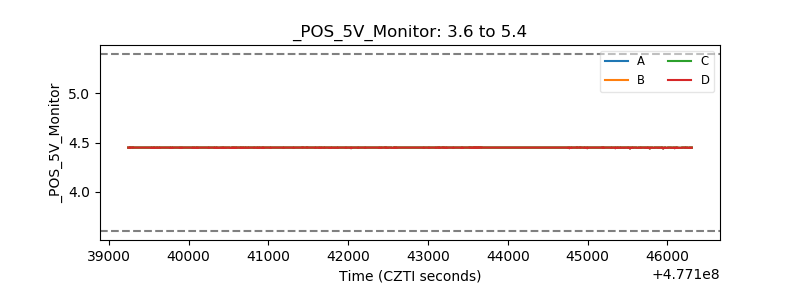 |
| _ROLL_ROT | 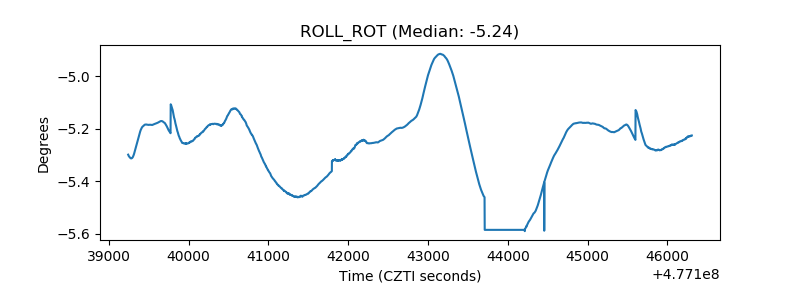 |
| _Roll_DEC | 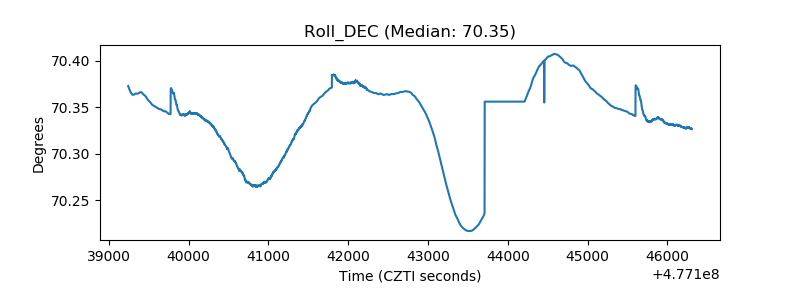 |
| _Roll_RA | 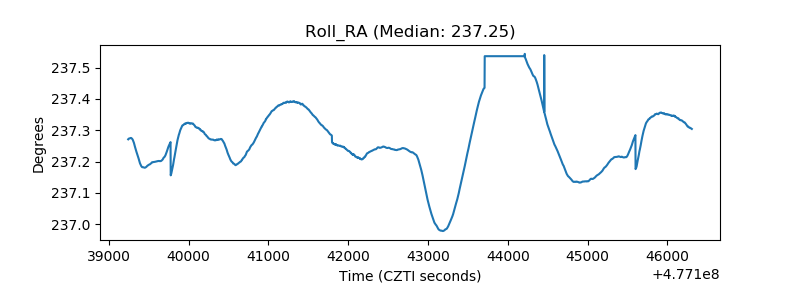 |
| Veto Counter | 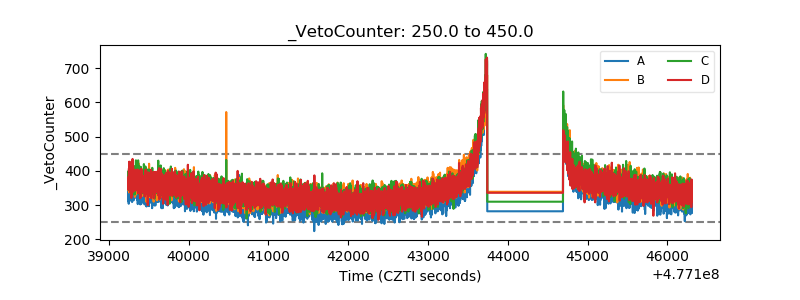 |