| Param | Original file | Final file |
|---|---|---|
| Filename | modeM0/AS1C07_001T01_9000006450_50917cztM0_level2.fits | modeM0/AS1C07_001T01_9000006450_50917cztM0_level2_quad_clean.evt |
| Size (bytes) | 760,098,240 | 85,092,480 |
| Size | 724.9 MB | 81.2 MB |
| Events in quadrant A | 13,667,682 | 276,664 |
| Events in quadrant B | 3,350,026 | 698,514 |
| Events in quadrant C | 4,736,275 | 608,441 |
| Events in quadrant D | 5,851,905 | 516,143 |
| Mode SS | |||
|---|---|---|---|
| Quadrant | BADHDUFLAG | Total packets | Discarded packets |
| A | 0 | 138 | 0 |
| B | 0 | 138 | 0 |
| C | 0 | 138 | 0 |
| D | 0 | 138 | 0 |
| Mode M0 | |||
|---|---|---|---|
| Quadrant | BADHDUFLAG | Total packets | Discarded packets |
| A | 0 | 45350 | 1 |
| B | 0 | 14956 | 1 |
| C | 0 | 18597 | 1 |
| D | 0 | 22205 | 1 |
| Mode M9 | |||
|---|---|---|---|
| Quadrant | BADHDUFLAG | Total packets | Discarded packets |
| A | 0 | 6 | 0 |
| B | 0 | 6 | 0 |
| C | 0 | 6 | 0 |
| D | 0 | 6 | 0 |
| Quadrant | Total seconds | Saturated seconds | Saturation percentage |
|---|---|---|---|
| A | 6840 | 4127 | 60.336257% |
| B | 6841 | 101 | 1.476392% |
| C | 6841 | 228 | 3.332846% |
| D | 6841 | 873 | 12.761292% |
Noise dominated data is calculated using 1-second bins in cleaned event files. If a bin has >2000 counts, and if more than 50% of those come from <1% of pixels, then it is considered to be noise-dominated and hence unusable.
| Quadrant | # 1 sec bins | Bins with >0 counts | Bins with >2000 counts | High rate bins dominated by noise | Noise dominated (total time) | Noise dominated (detector-on time) | Marked lightcurve |
|---|---|---|---|---|---|---|---|
| A | 7439 | 6839 | 3870 | 3870 | 52.02% | 56.59% | 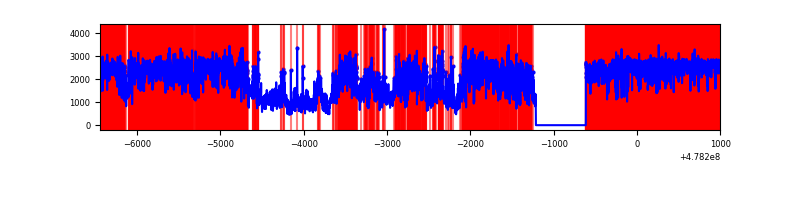 |
| B | 7441 | 6841 | 7 | 7 | 0.09% | 0.10% | 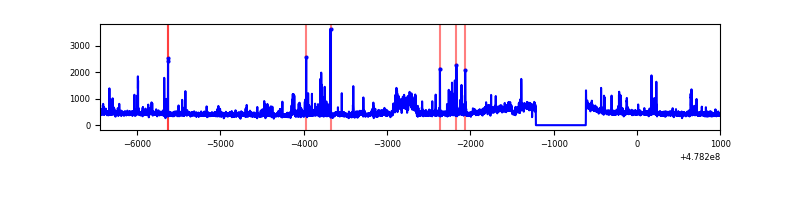 |
| C | 7441 | 6842 | 154 | 154 | 2.07% | 2.25% | 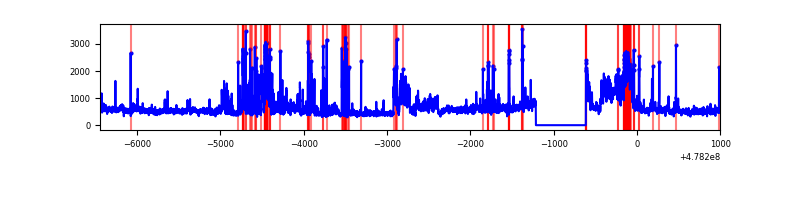 |
| D | 7441 | 6841 | 562 | 562 | 7.55% | 8.22% | 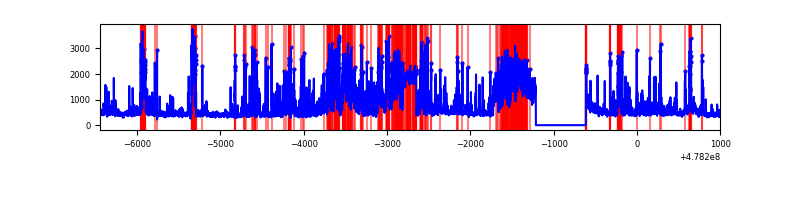 |
Top three noisy pixels from each quadrant. If the there are fewer than three noisy pixels in the level2.evt file, extra rows are filled as -1
| Pixel properties | Quadrant properties | ||||||
|---|---|---|---|---|---|---|---|
| Quadrant | DetID | PixID | Counts | Sigma | Mean | Median | Sigma |
| A | 4 | 4 | 6692986 | 51298.47 | 522 | 507 | 130.5 |
| A | 14 | 254 | 3662290 | 28067.9 | 522 | 507 | 130.5 |
| A | 4 | 3 | 235985 | 1804.96 | 522 | 507 | 130.5 |
| B | 7 | 252 | 230888 | 1500.98 | 719 | 693 | 153.4 |
| B | 8 | 128 | 54538 | 351.09 | 719 | 693 | 153.4 |
| B | 0 | 245 | 32838 | 209.6 | 719 | 693 | 153.4 |
| C | 5 | 10 | 732273 | 3792.18 | 700 | 691 | 192.9 |
| C | 12 | 247 | 569259 | 2947.19 | 700 | 691 | 192.9 |
| C | 13 | 3 | 146166 | 754.07 | 700 | 691 | 192.9 |
| D | 7 | 45 | 1526975 | 8225.43 | 666 | 642 | 185.6 |
| D | 2 | 249 | 489574 | 2634.86 | 666 | 642 | 185.6 |
| D | 8 | 176 | 306428 | 1647.88 | 666 | 642 | 185.6 |
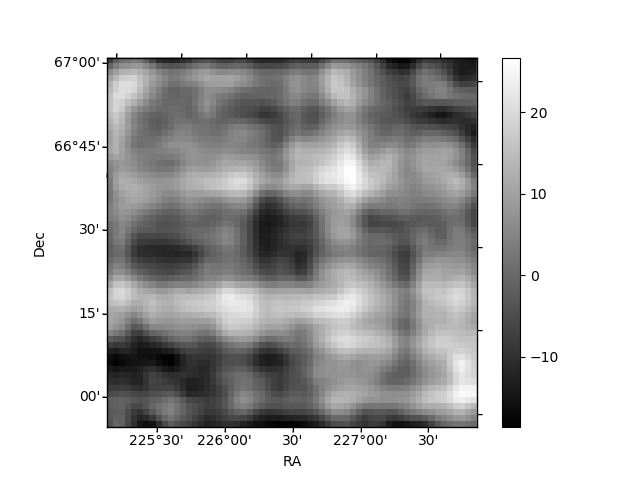
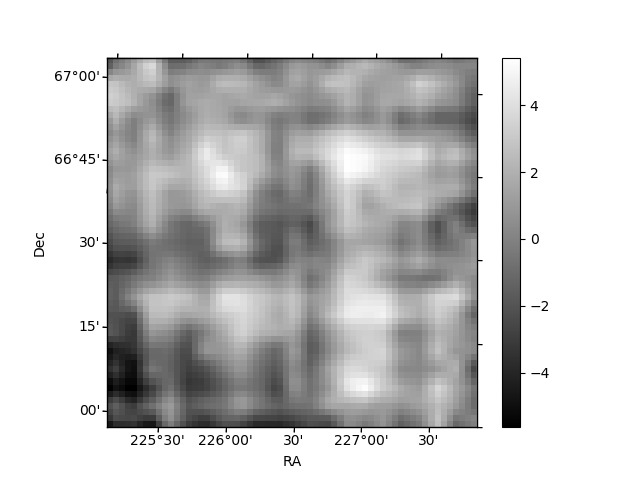
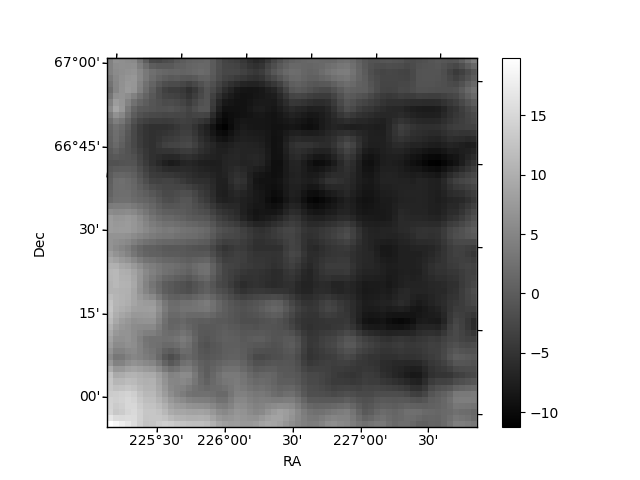
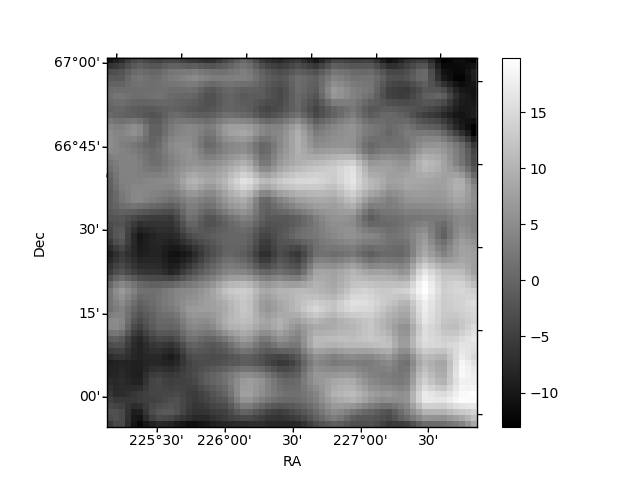
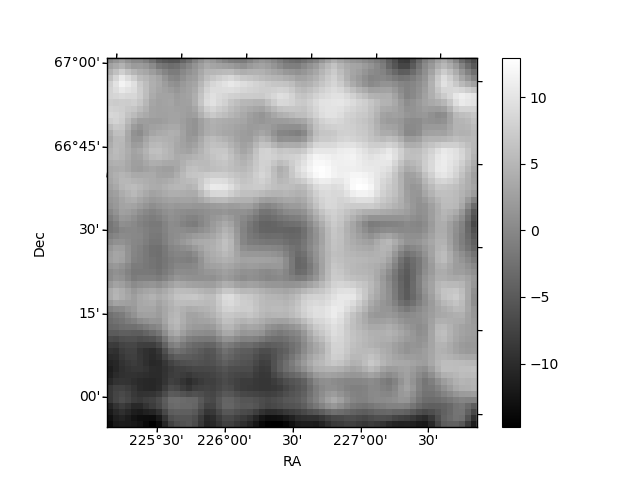
Histogram calculated using DETX and DETY for each event in the final _common_clean file
| Quadrant A | 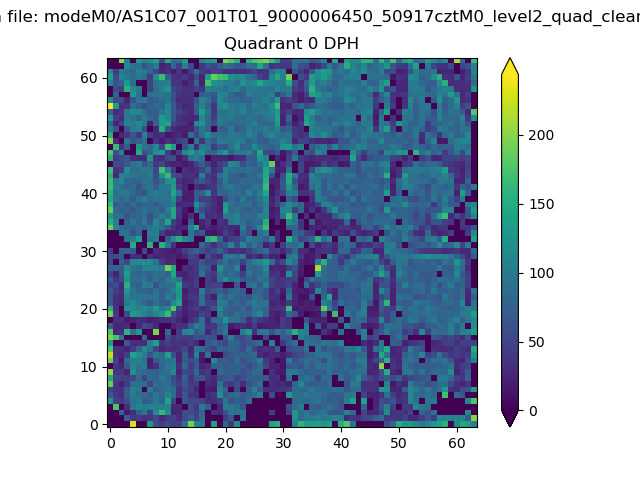 |
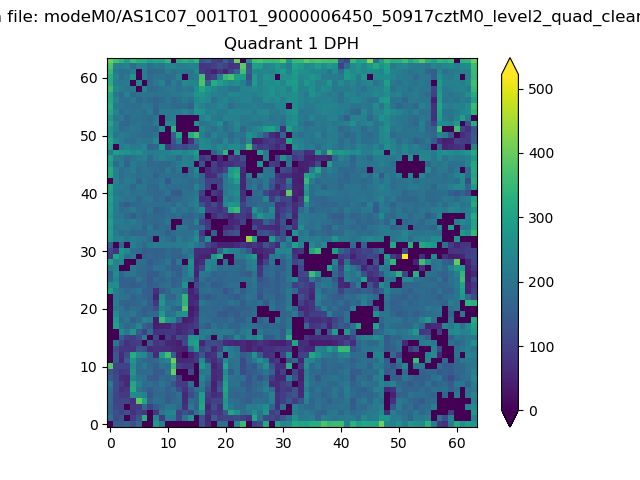 |
Quadrant B |
|---|---|---|---|
| Quadrant D | 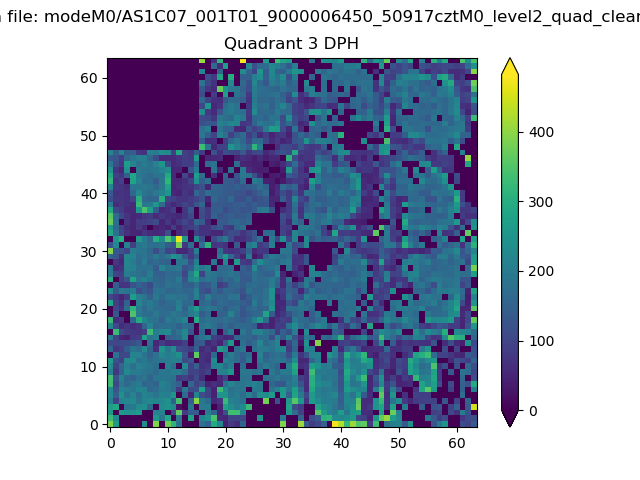 |
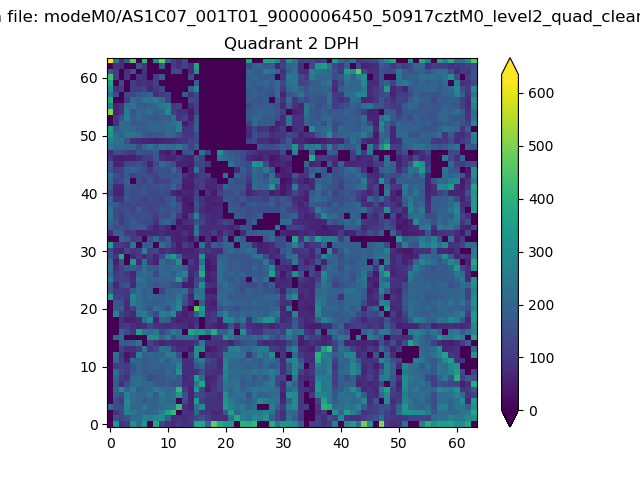 |
Quadrant C |
| Plot type | Count rate plots | Images |
|---|---|---|
| Comparison with Poisson distribution Blue bars denote a histogram of data divided into 1 sec bins. Red curve is a Poisson curve with rate = median count rate of data. |
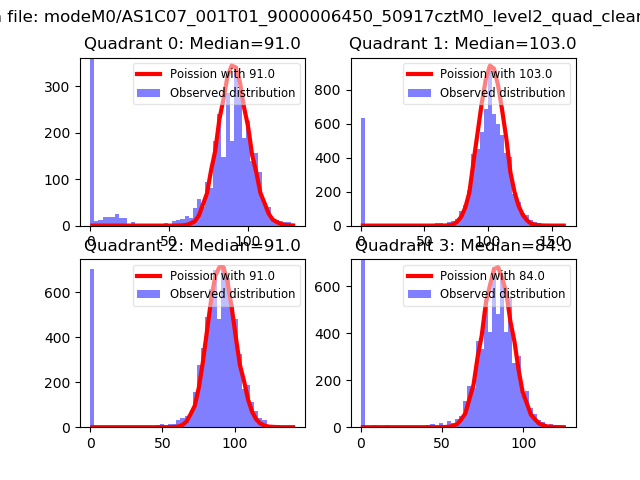 |
 |
| Quadrant-wise count rates Data is divided into 100 sec bins |
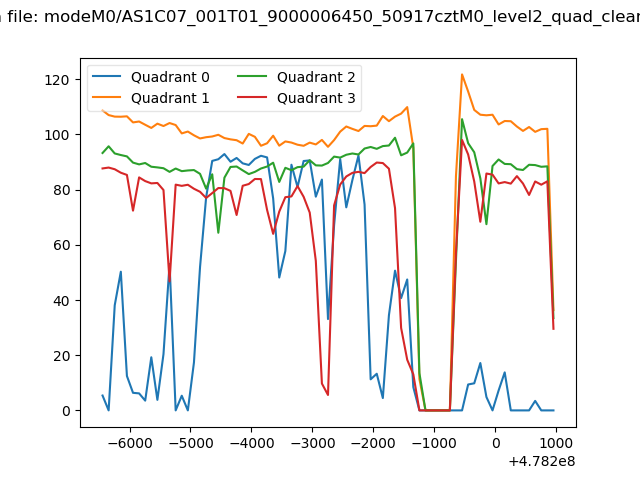 |
|
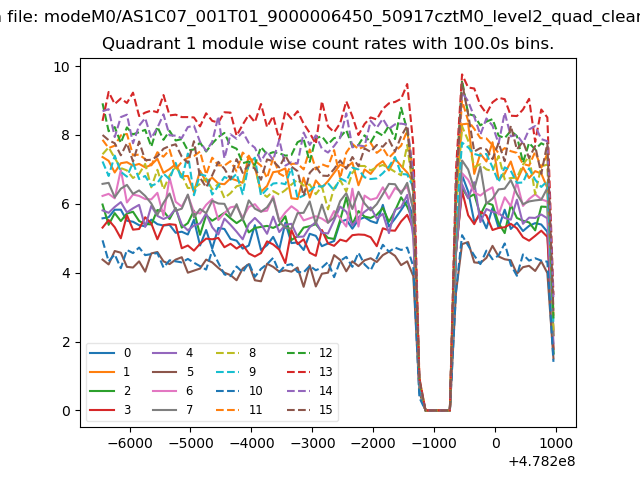
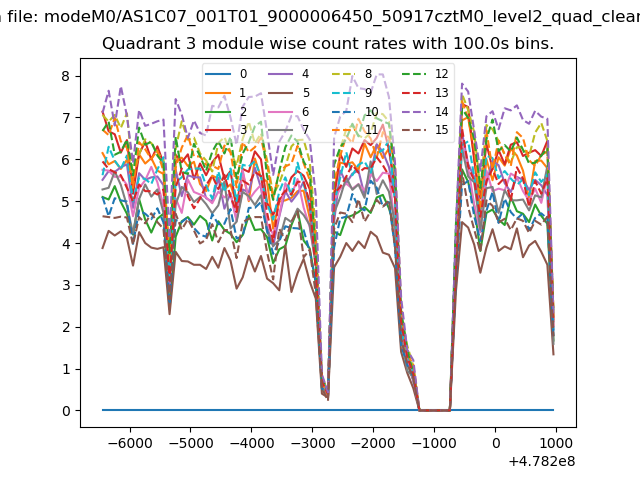
| Module-wise count rates for Quadrant A Data is divided into 100 sec bins |
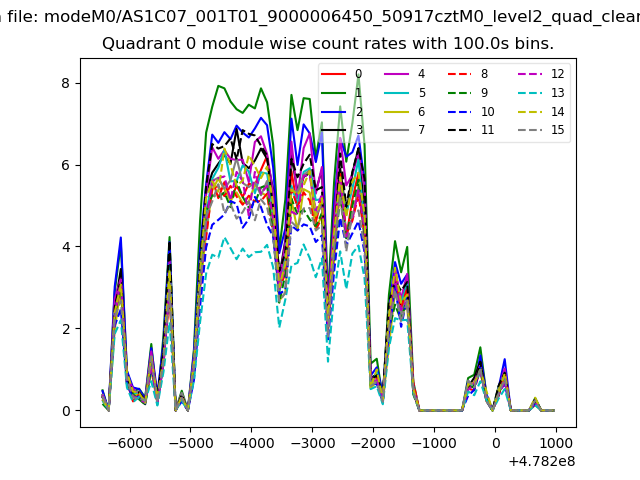 |
 |
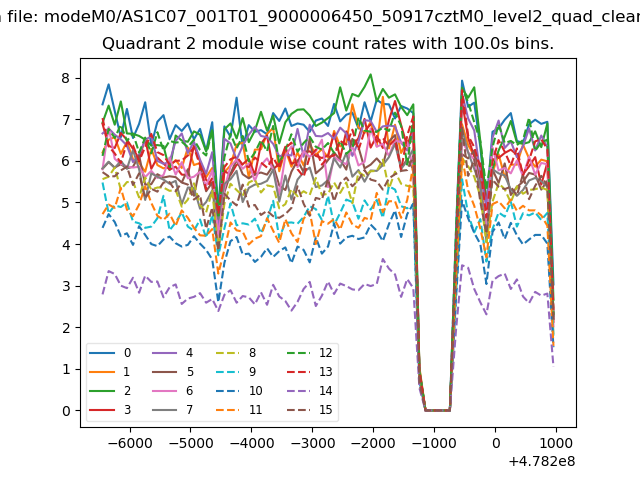
| Module-wise count rates for Quadrant B Data is divided into 100 sec bins |
 |
 |
| Module-wise count rates for Quadrant C Data is divided into 100 sec bins |
 |
 |
| Module-wise count rates for Quadrant D Data is divided into 100 sec bins |
 |
 |
| Parameter | Plot |
|---|---|
| CZT HV Monitor | 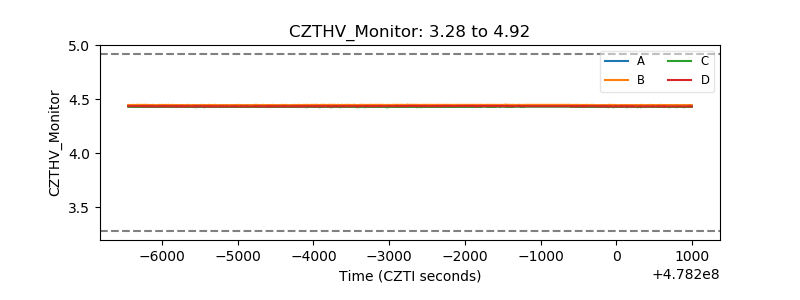 |
| D_VDD | 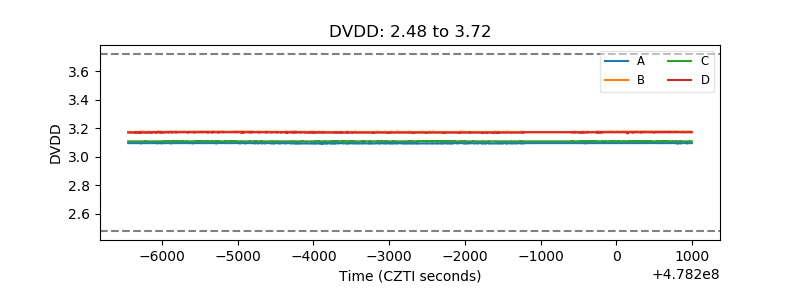 |
| Temperature 1 | 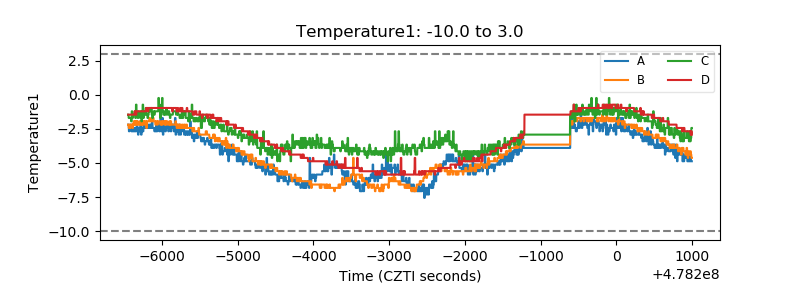 |
| Veto HV Monitor | 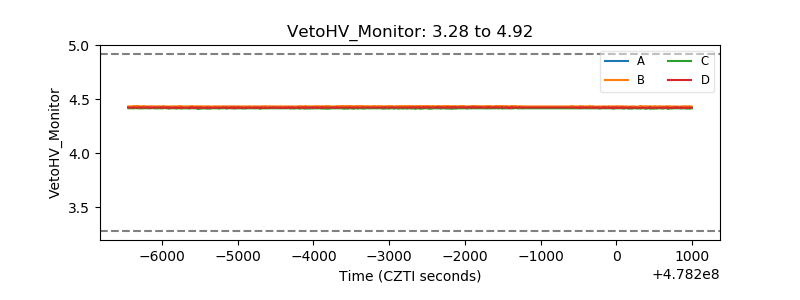 |
| Veto LLD | 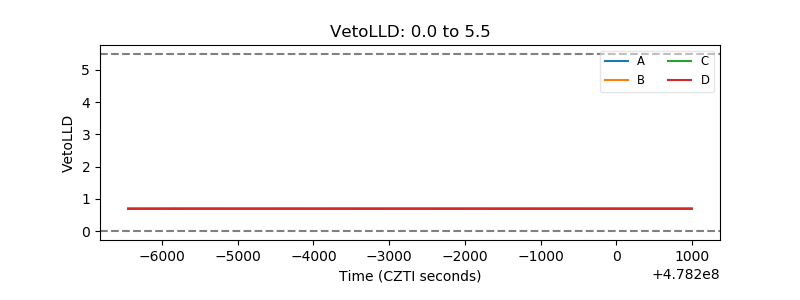 |
| Alpha Counter | 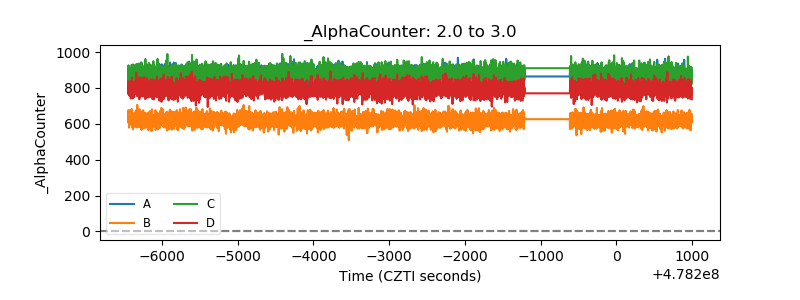 |
| _CPM_Rate | 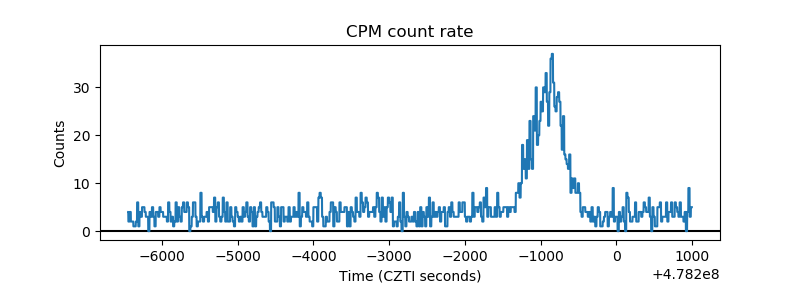 |
| CZT Counter | 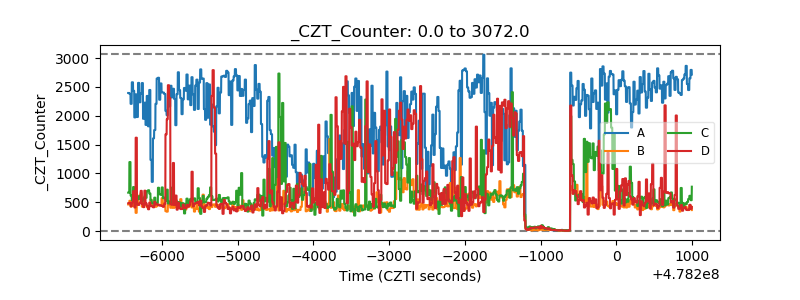 |
| +2.5 Volts monitor | 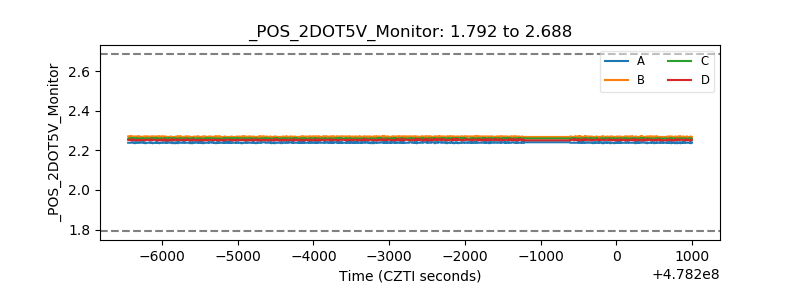 |
| +5 Volts monitor | 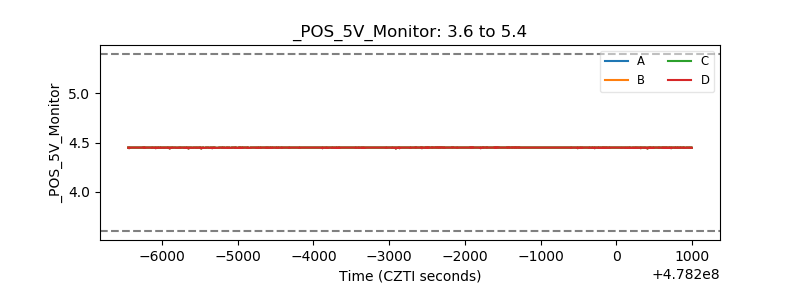 |
| _ROLL_ROT | 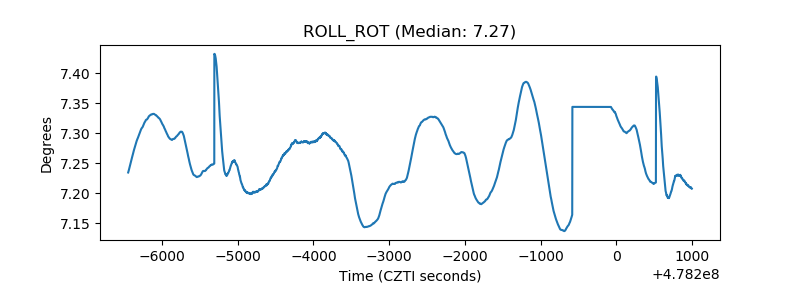 |
| _Roll_DEC | 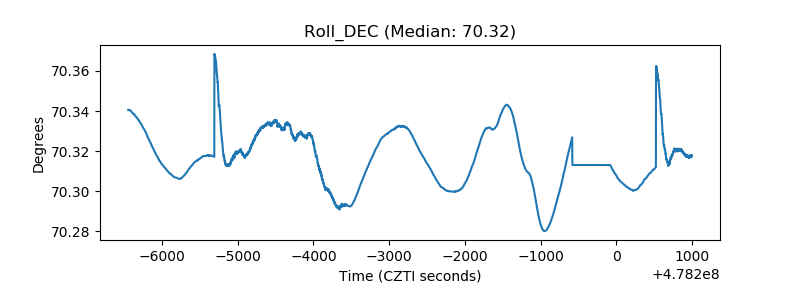 |
| _Roll_RA | 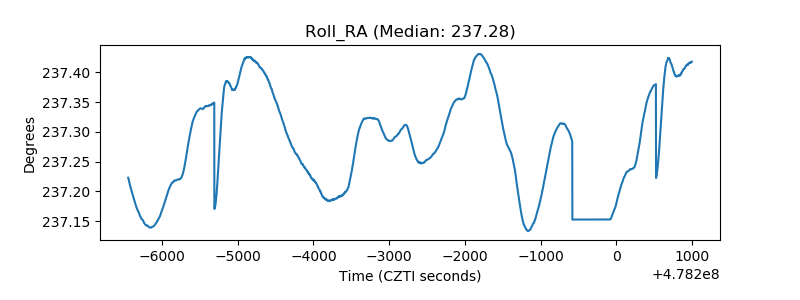 |
| Veto Counter | 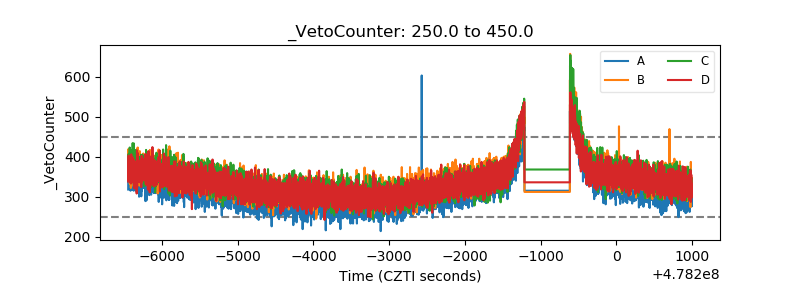 |