| Param | Original file | Final file |
|---|---|---|
| Filename | modeM0/AS1C07_001T01_9000006450_50918cztM0_level2.fits | modeM0/AS1C07_001T01_9000006450_50918cztM0_level2_quad_clean.evt |
| Size (bytes) | 1,021,435,200 | 80,184,960 |
| Size | 974.1 MB | 76.5 MB |
| Events in quadrant A | 16,599,875 | 146,503 |
| Events in quadrant B | 3,441,492 | 751,230 |
| Events in quadrant C | 7,370,525 | 591,143 |
| Events in quadrant D | 9,827,854 | 425,384 |
| Mode SS | |||
|---|---|---|---|
| Quadrant | BADHDUFLAG | Total packets | Discarded packets |
| A | 0 | 148 | 0 |
| B | 0 | 148 | 0 |
| C | 0 | 148 | 0 |
| D | 0 | 148 | 0 |
| Mode M0 | |||
|---|---|---|---|
| Quadrant | BADHDUFLAG | Total packets | Discarded packets |
| A | 0 | 54343 | 0 |
| B | 0 | 15633 | 0 |
| C | 0 | 27003 | 0 |
| D | 0 | 34297 | 0 |
| Quadrant | Total seconds | Saturated seconds | Saturation percentage |
|---|---|---|---|
| A | 7373 | 6070 | 82.327411% |
| B | 7374 | 39 | 0.528885% |
| C | 7374 | 971 | 13.167887% |
| D | 7374 | 2571 | 34.865745% |
Noise dominated data is calculated using 1-second bins in cleaned event files. If a bin has >2000 counts, and if more than 50% of those come from <1% of pixels, then it is considered to be noise-dominated and hence unusable.
| Quadrant | # 1 sec bins | Bins with >0 counts | Bins with >2000 counts | High rate bins dominated by noise | Noise dominated (total time) | Noise dominated (detector-on time) | Marked lightcurve |
|---|---|---|---|---|---|---|---|
| A | 7372 | 7372 | 5442 | 5442 | 73.82% | 73.82% | 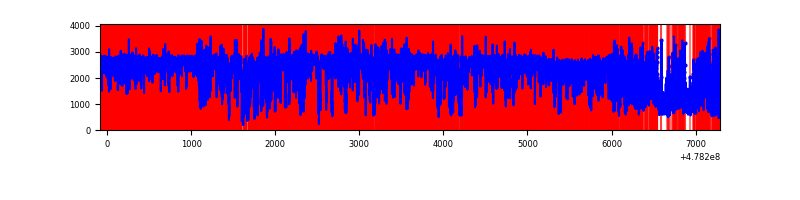 |
| B | 7374 | 7374 | 14 | 14 | 0.19% | 0.19% | 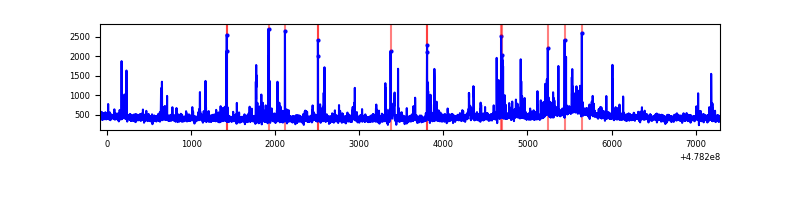 |
| C | 7374 | 7374 | 865 | 865 | 11.73% | 11.73% | 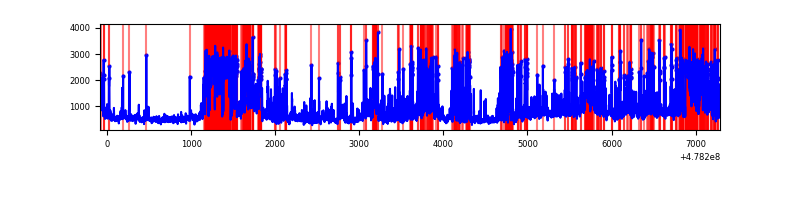 |
| D | 7374 | 7374 | 2165 | 2165 | 29.36% | 29.36% | 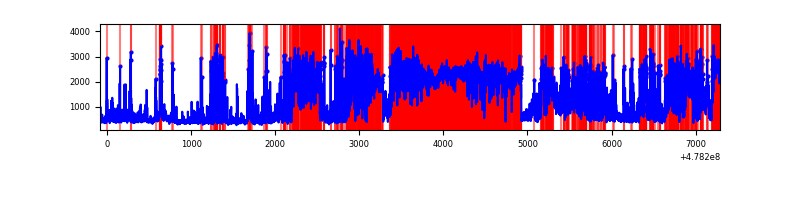 |
Top three noisy pixels from each quadrant. If the there are fewer than three noisy pixels in the level2.evt file, extra rows are filled as -1
| Pixel properties | Quadrant properties | ||||||
|---|---|---|---|---|---|---|---|
| Quadrant | DetID | PixID | Counts | Sigma | Mean | Median | Sigma |
| A | 14 | 254 | 12677026 | 131433.66 | 378 | 368 | 96.4 |
| A | 4 | 4 | 1119235 | 11600.6 | 378 | 368 | 96.4 |
| A | 12 | 80 | 283663 | 2937.25 | 378 | 368 | 96.4 |
| B | 8 | 128 | 87081 | 520.9 | 775 | 747 | 165.7 |
| B | 0 | 216 | 49648 | 295.05 | 775 | 747 | 165.7 |
| B | 7 | 252 | 48540 | 288.36 | 775 | 747 | 165.7 |
| C | 3 | 233 | 1423375 | 7184.93 | 724 | 718 | 198.0 |
| C | 5 | 10 | 926357 | 4674.81 | 724 | 718 | 198.0 |
| C | 12 | 247 | 794450 | 4008.63 | 724 | 718 | 198.0 |
| D | 7 | 45 | 4246681 | 23127.66 | 650 | 626 | 183.6 |
| D | 8 | 176 | 668681 | 3638.8 | 650 | 626 | 183.6 |
| D | 3 | 12 | 630495 | 3430.81 | 650 | 626 | 183.6 |
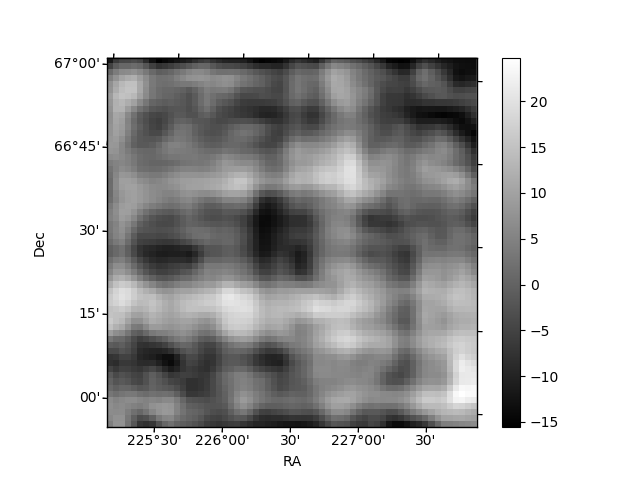
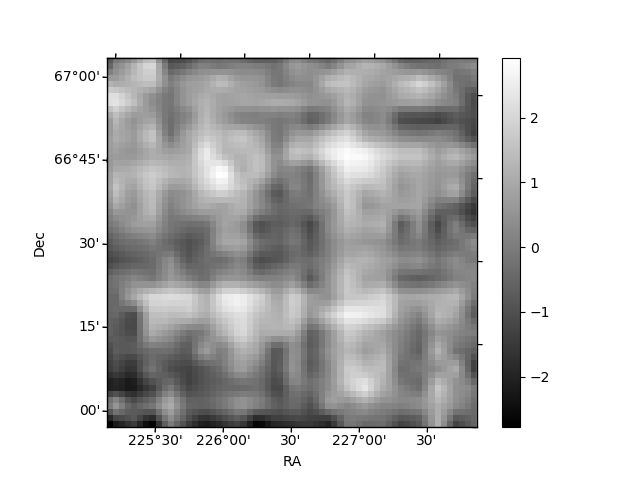
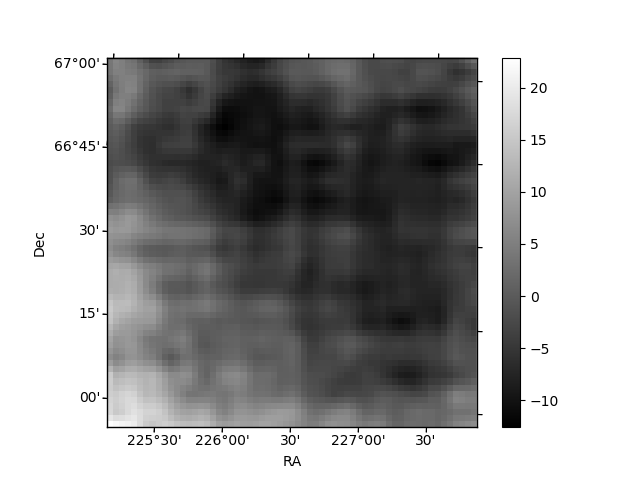
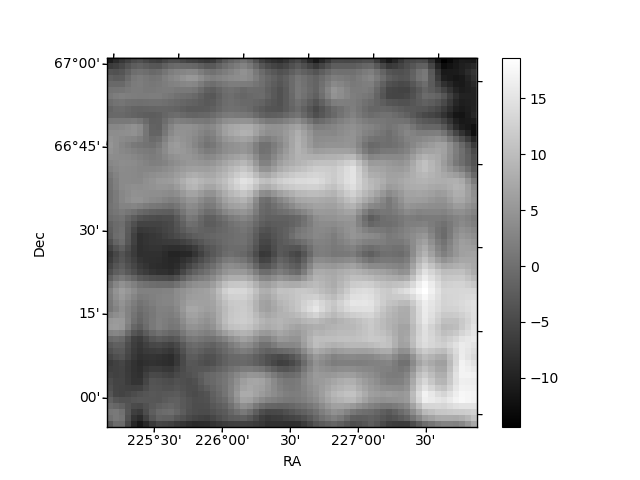
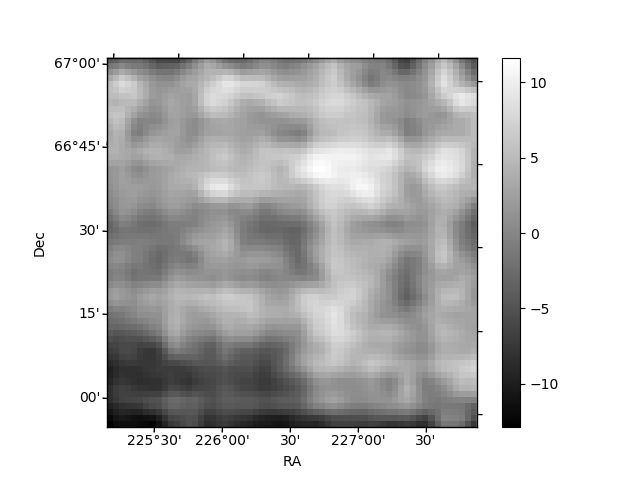
Histogram calculated using DETX and DETY for each event in the final _common_clean file
| Quadrant A | 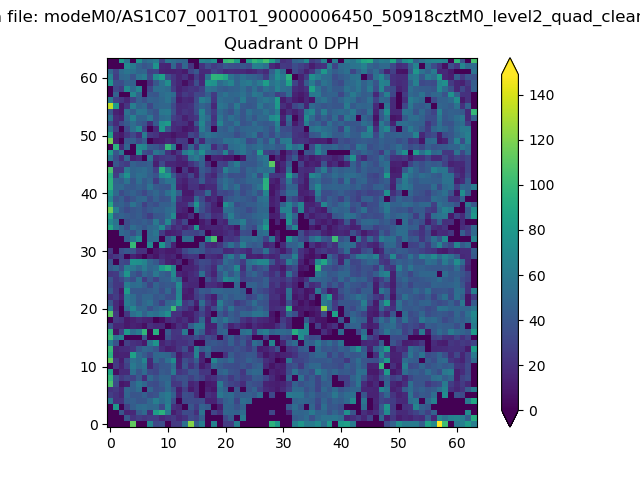 |
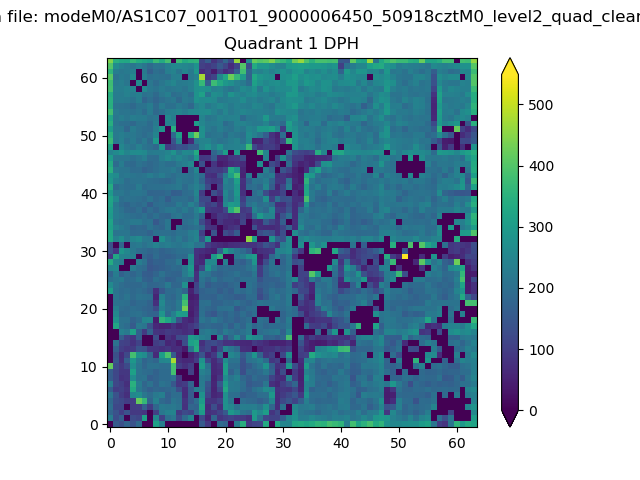 |
Quadrant B |
|---|---|---|---|
| Quadrant D | 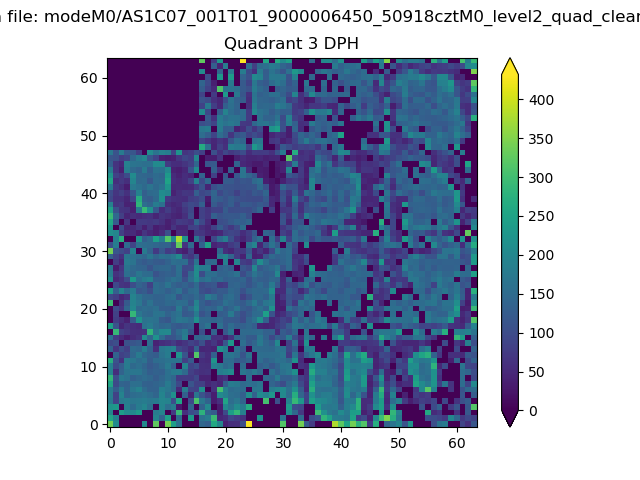 |
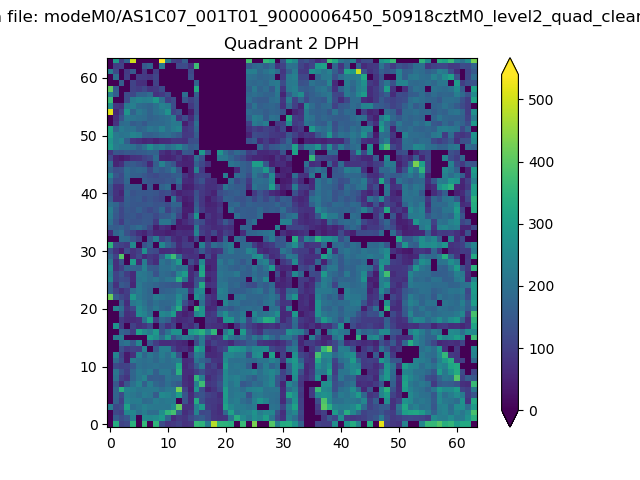 |
Quadrant C |
| Plot type | Count rate plots | Images |
|---|---|---|
| Comparison with Poisson distribution Blue bars denote a histogram of data divided into 1 sec bins. Red curve is a Poisson curve with rate = median count rate of data. |
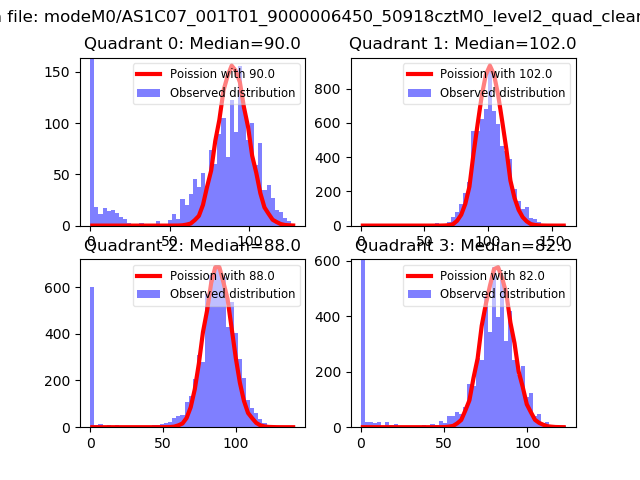 |
 |
| Quadrant-wise count rates Data is divided into 100 sec bins |
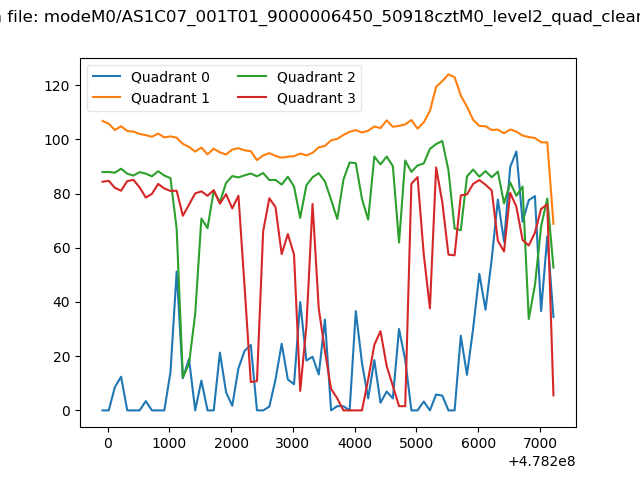 |
|
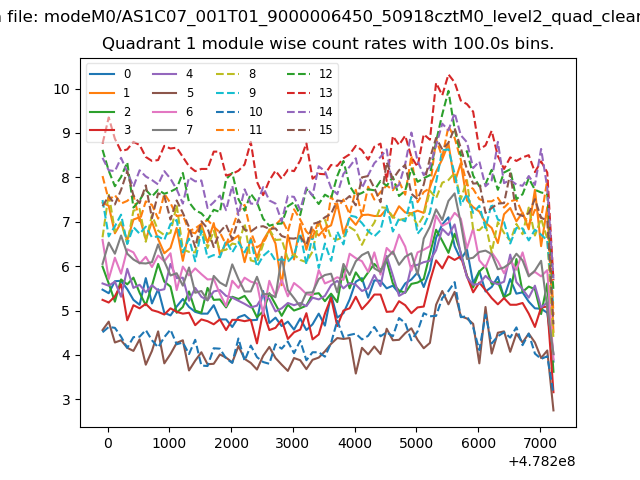
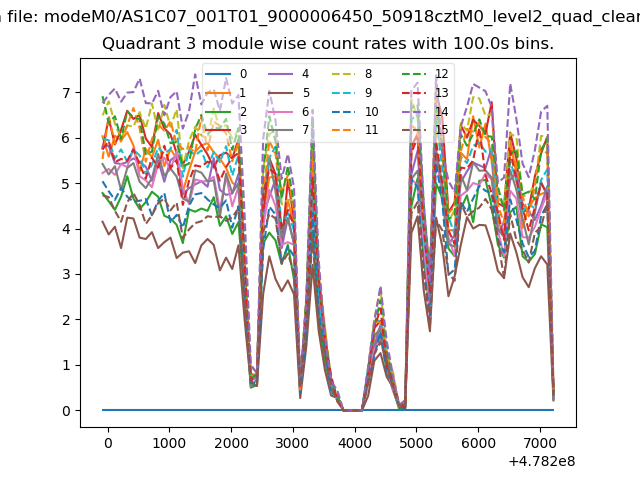
| Module-wise count rates for Quadrant A Data is divided into 100 sec bins |
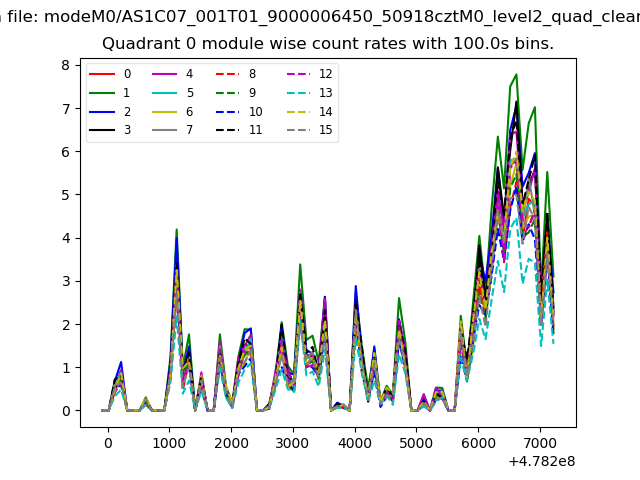 |
 |
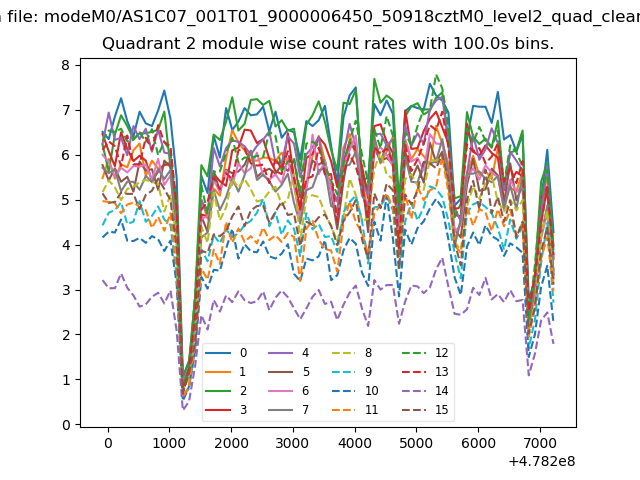
| Module-wise count rates for Quadrant B Data is divided into 100 sec bins |
 |
 |
| Module-wise count rates for Quadrant C Data is divided into 100 sec bins |
 |
 |
| Module-wise count rates for Quadrant D Data is divided into 100 sec bins |
 |
 |
| Parameter | Plot |
|---|---|
| CZT HV Monitor | 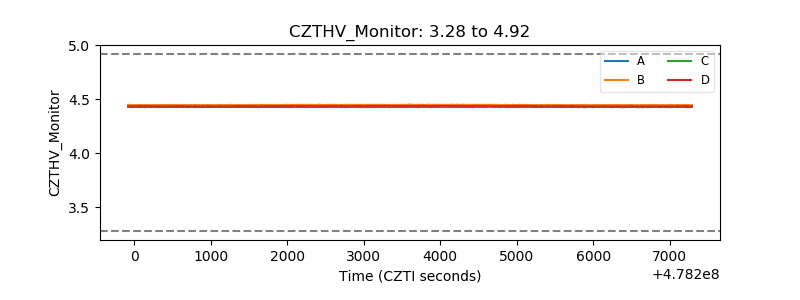 |
| D_VDD | 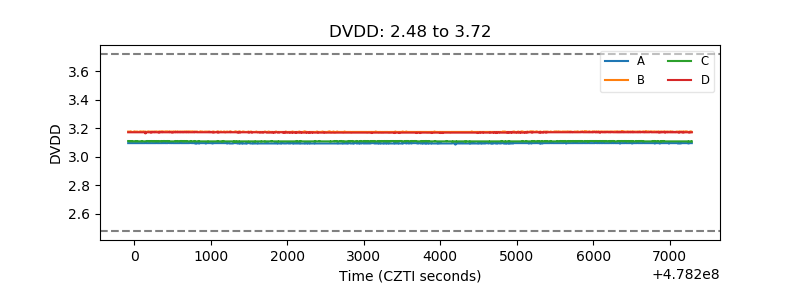 |
| Temperature 1 | 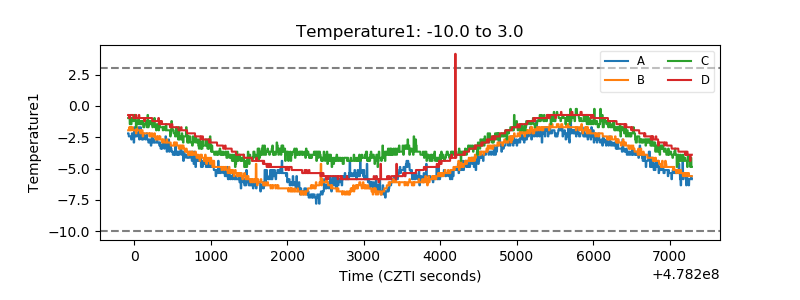 |
| Veto HV Monitor | 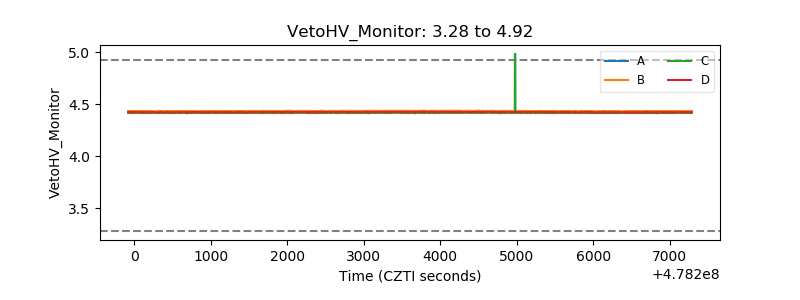 |
| Veto LLD | 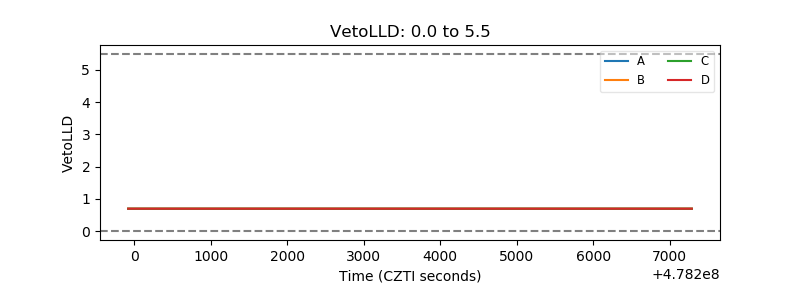 |
| Alpha Counter | 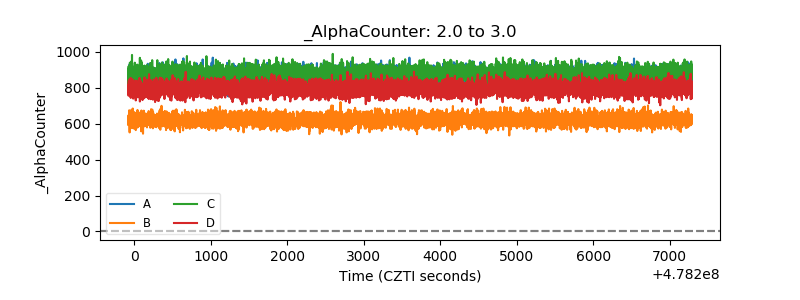 |
| _CPM_Rate | 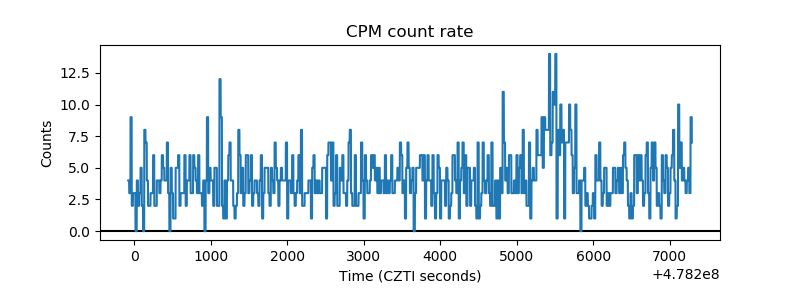 |
| CZT Counter | 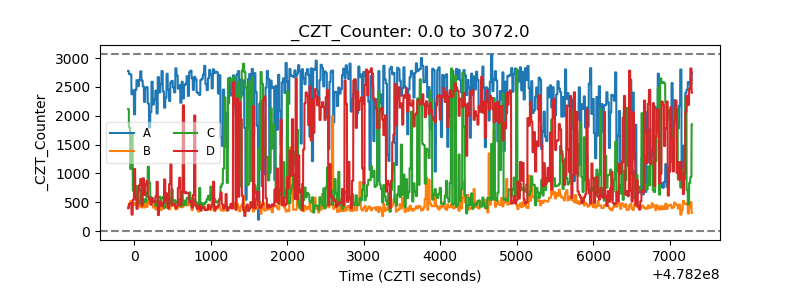 |
| +2.5 Volts monitor | 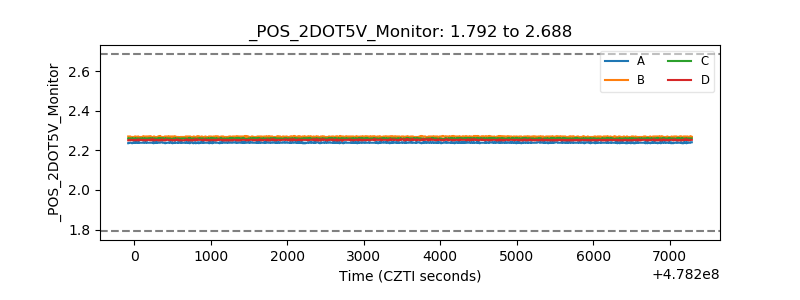 |
| +5 Volts monitor | 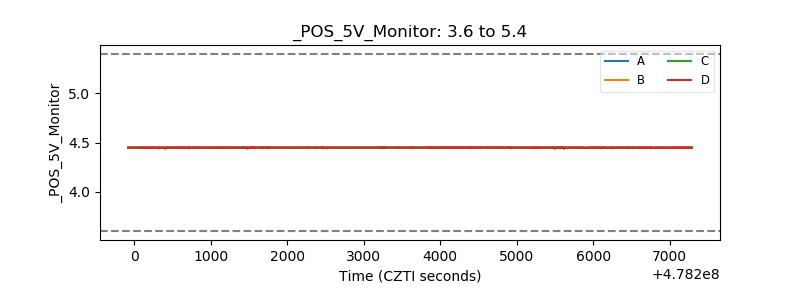 |
| _ROLL_ROT | 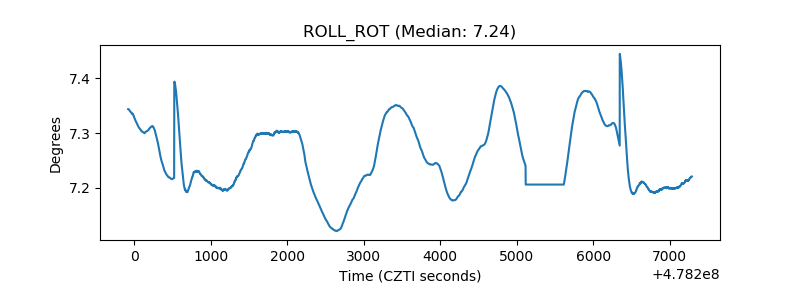 |
| _Roll_DEC | 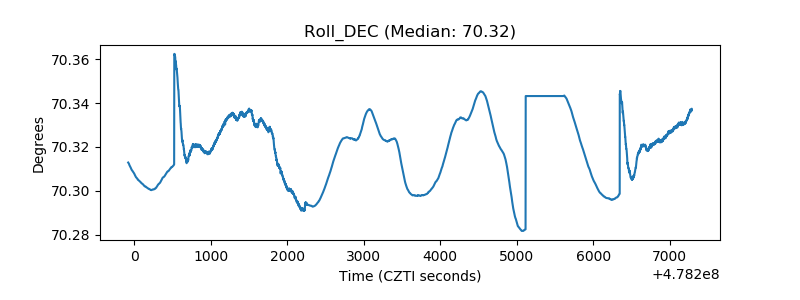 |
| _Roll_RA | 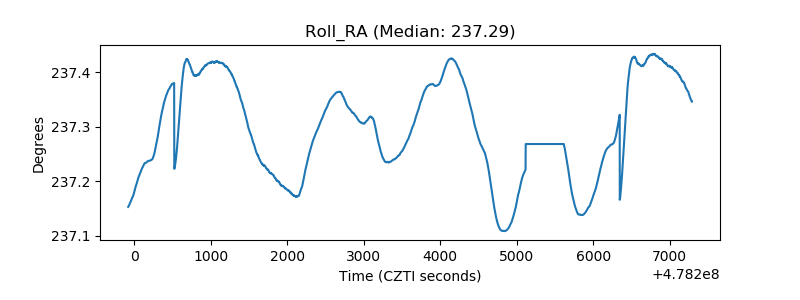 |
| Veto Counter | 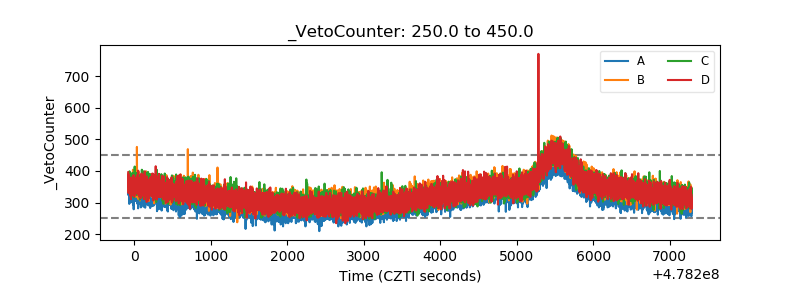 |