| Param | Original file | Final file |
|---|---|---|
| Filename | modeM0/AS1C07_001T01_9000006450_50919cztM0_level2.fits | modeM0/AS1C07_001T01_9000006450_50919cztM0_level2_quad_clean.evt |
| Size (bytes) | 1,087,015,680 | 90,483,840 |
| Size | 1.0 GB | 86.3 MB |
| Events in quadrant A | 15,868,968 | 294,878 |
| Events in quadrant B | 3,863,034 | 801,574 |
| Events in quadrant C | 10,136,052 | 531,314 |
| Events in quadrant D | 9,758,390 | 561,151 |
| Mode SS | |||
|---|---|---|---|
| Quadrant | BADHDUFLAG | Total packets | Discarded packets |
| A | 0 | 158 | 0 |
| B | 0 | 158 | 0 |
| C | 0 | 158 | 0 |
| D | 0 | 158 | 0 |
| Mode M0 | |||
|---|---|---|---|
| Quadrant | BADHDUFLAG | Total packets | Discarded packets |
| A | 0 | 52624 | 0 |
| B | 0 | 17186 | 1 |
| C | 0 | 35623 | 0 |
| D | 0 | 34429 | 0 |
| Quadrant | Total seconds | Saturated seconds | Saturation percentage |
|---|---|---|---|
| A | 7917 | 5212 | 65.833018% |
| B | 7916 | 46 | 0.581102% |
| C | 7917 | 2257 | 28.508273% |
| D | 7917 | 1605 | 20.272831% |
Noise dominated data is calculated using 1-second bins in cleaned event files. If a bin has >2000 counts, and if more than 50% of those come from <1% of pixels, then it is considered to be noise-dominated and hence unusable.
| Quadrant | # 1 sec bins | Bins with >0 counts | Bins with >2000 counts | High rate bins dominated by noise | Noise dominated (total time) | Noise dominated (detector-on time) | Marked lightcurve |
|---|---|---|---|---|---|---|---|
| A | 7917 | 7917 | 4553 | 4553 | 57.51% | 57.51% | 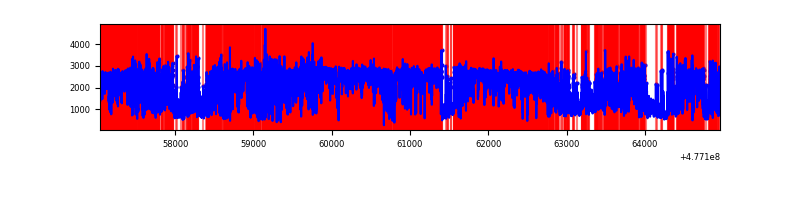 |
| B | 7916 | 7916 | 22 | 22 | 0.28% | 0.28% | 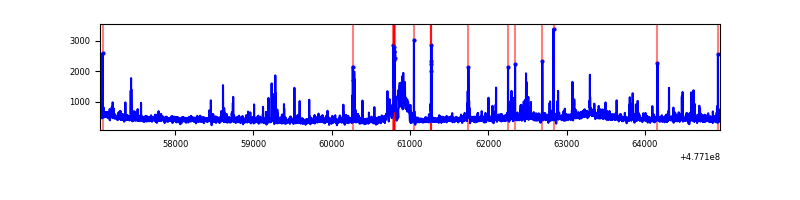 |
| C | 7917 | 7917 | 1926 | 1926 | 24.33% | 24.33% | 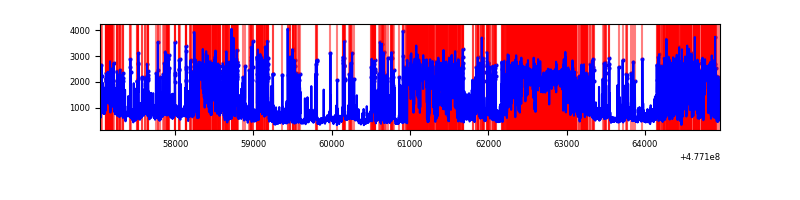 |
| D | 7917 | 7917 | 1282 | 1282 | 16.19% | 16.19% | 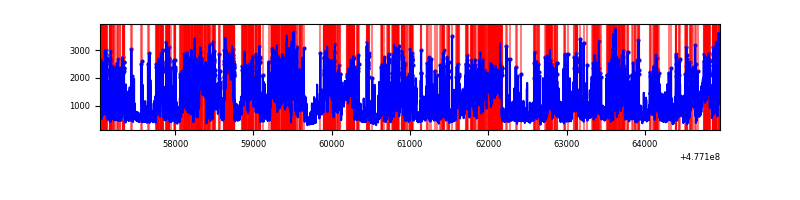 |
Top three noisy pixels from each quadrant. If the there are fewer than three noisy pixels in the level2.evt file, extra rows are filled as -1
| Pixel properties | Quadrant properties | ||||||
|---|---|---|---|---|---|---|---|
| Quadrant | DetID | PixID | Counts | Sigma | Mean | Median | Sigma |
| A | 14 | 254 | 11434305 | 88956.65 | 501 | 486 | 128.5 |
| A | 4 | 4 | 1413453 | 10993.07 | 501 | 486 | 128.5 |
| A | 4 | 3 | 165302 | 1282.29 | 501 | 486 | 128.5 |
| B | 0 | 213 | 138258 | 780.41 | 834 | 804 | 176.1 |
| B | 7 | 252 | 99145 | 558.34 | 834 | 804 | 176.1 |
| B | 8 | 128 | 74278 | 417.16 | 834 | 804 | 176.1 |
| C | 4 | 210 | 2734126 | 13971.02 | 708 | 702 | 195.6 |
| C | 5 | 10 | 1785675 | 9123.32 | 708 | 702 | 195.6 |
| C | 12 | 247 | 855267 | 4367.83 | 708 | 702 | 195.6 |
| D | 7 | 45 | 2755321 | 12988.87 | 757 | 729 | 212.1 |
| D | 3 | 12 | 705655 | 3323.97 | 757 | 729 | 212.1 |
| D | 2 | 249 | 604206 | 2845.6 | 757 | 729 | 212.1 |
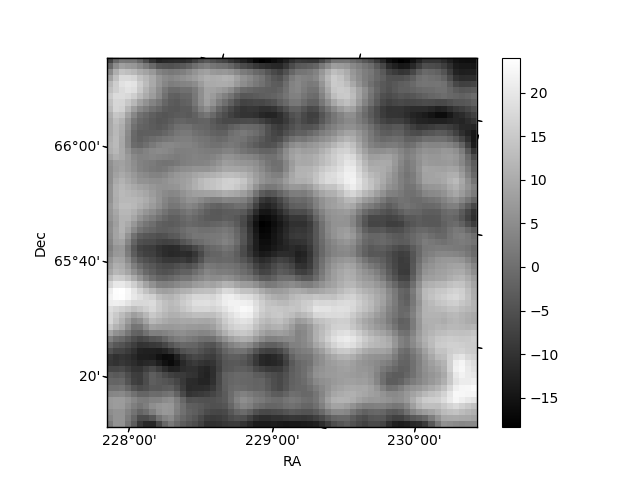
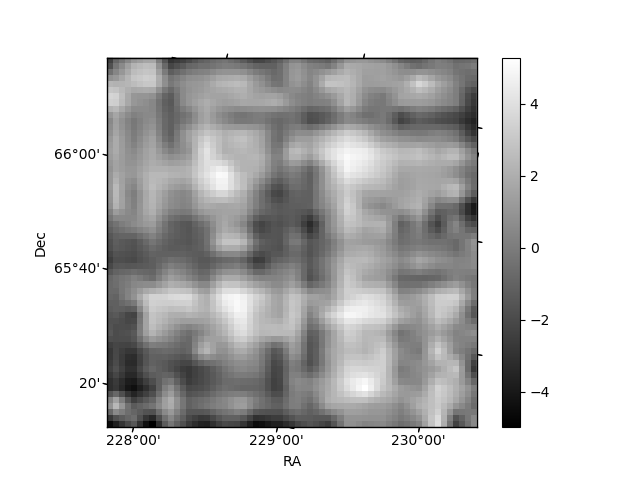
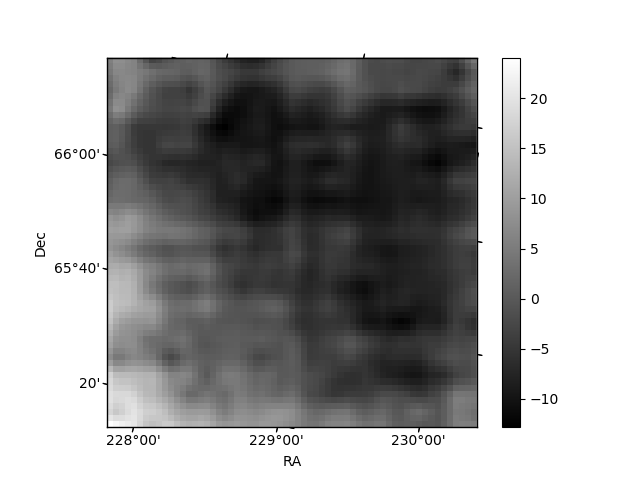
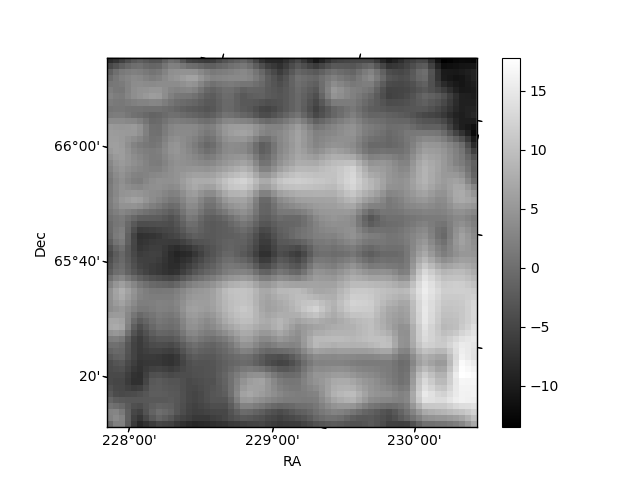
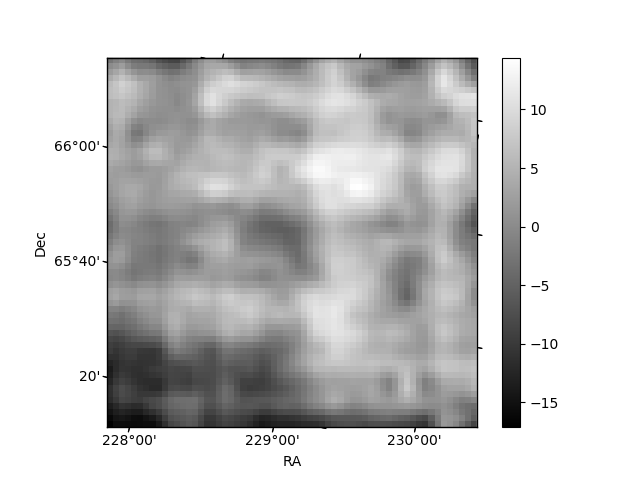
Histogram calculated using DETX and DETY for each event in the final _common_clean file
| Quadrant A | 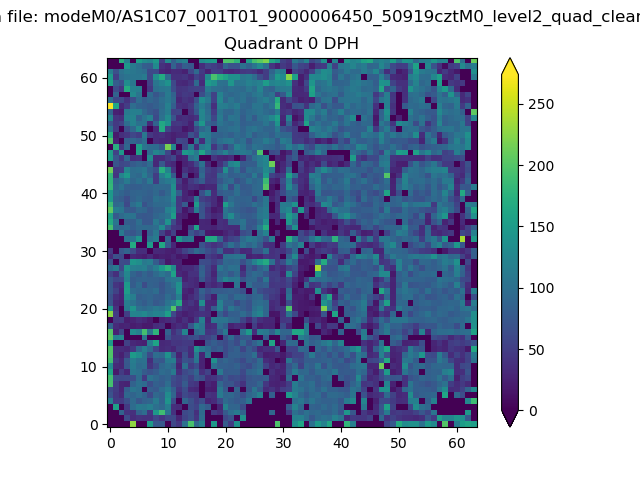 |
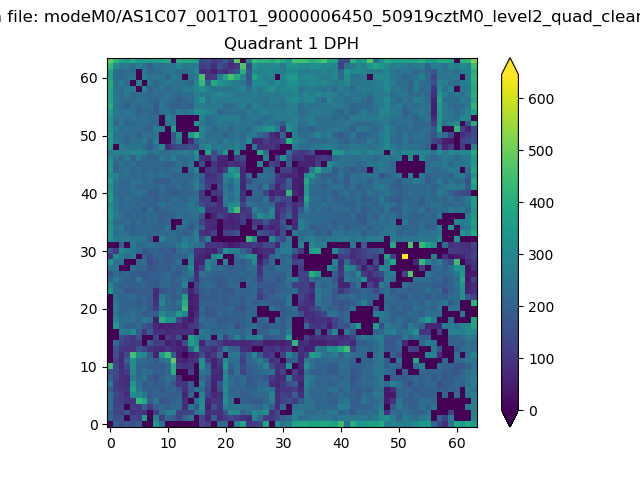 |
Quadrant B |
|---|---|---|---|
| Quadrant D | 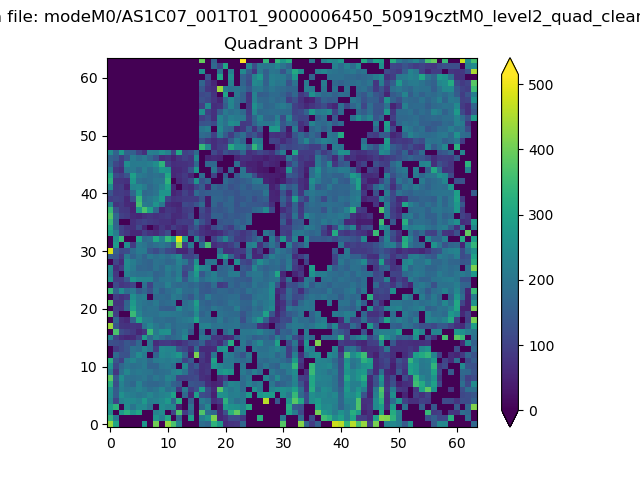 |
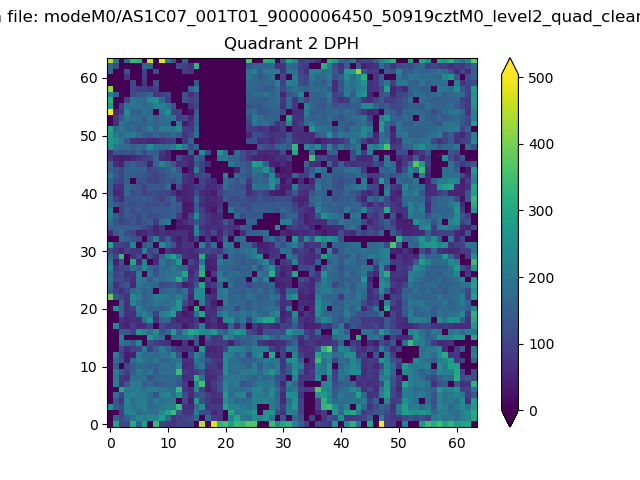 |
Quadrant C |
| Plot type | Count rate plots | Images |
|---|---|---|
| Comparison with Poisson distribution Blue bars denote a histogram of data divided into 1 sec bins. Red curve is a Poisson curve with rate = median count rate of data. |
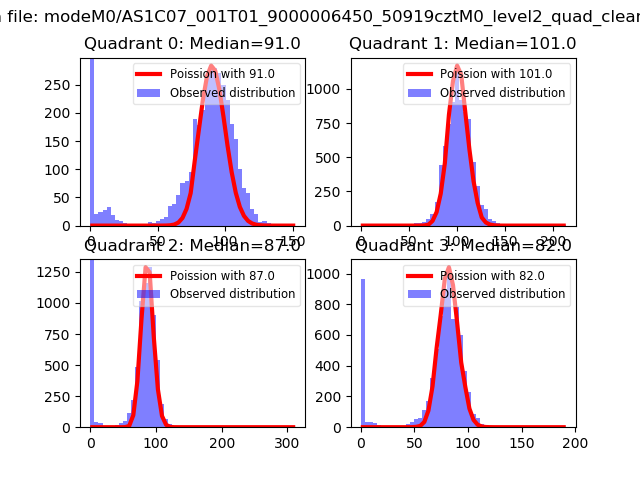 |
 |
| Quadrant-wise count rates Data is divided into 100 sec bins |
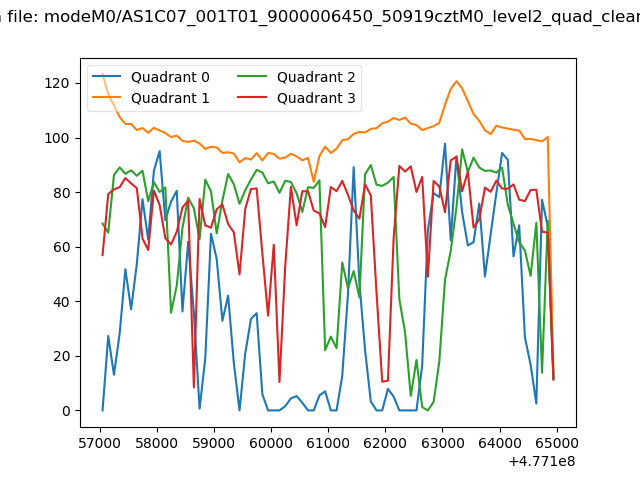 |
|
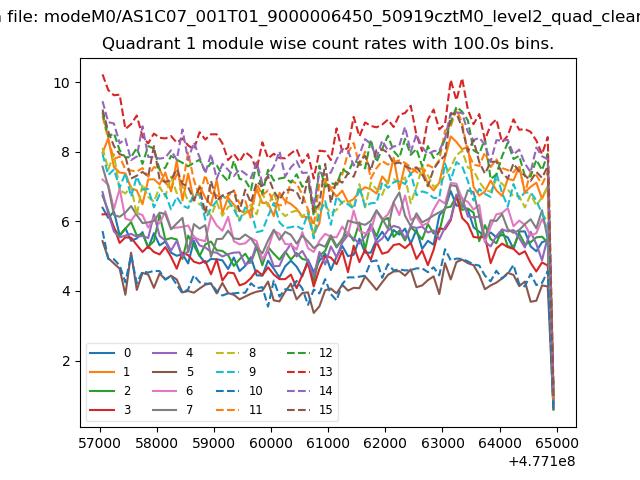
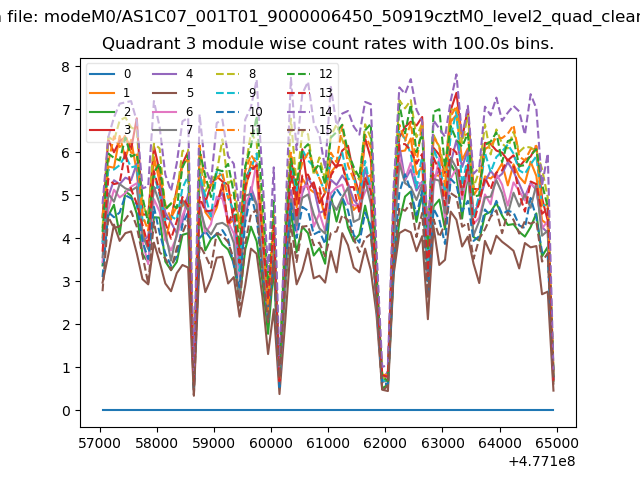
| Module-wise count rates for Quadrant A Data is divided into 100 sec bins |
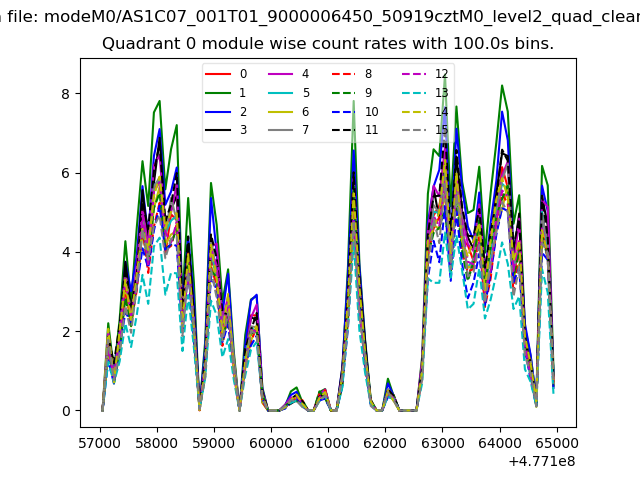 |
 |
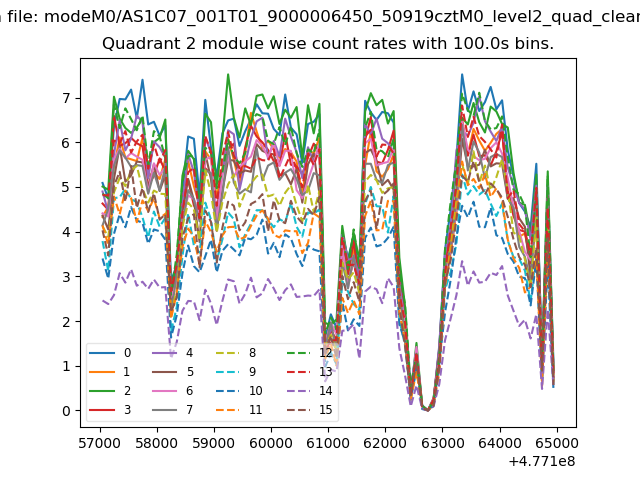
| Module-wise count rates for Quadrant B Data is divided into 100 sec bins |
 |
 |
| Module-wise count rates for Quadrant C Data is divided into 100 sec bins |
 |
 |
| Module-wise count rates for Quadrant D Data is divided into 100 sec bins |
 |
 |
| Parameter | Plot |
|---|---|
| CZT HV Monitor | 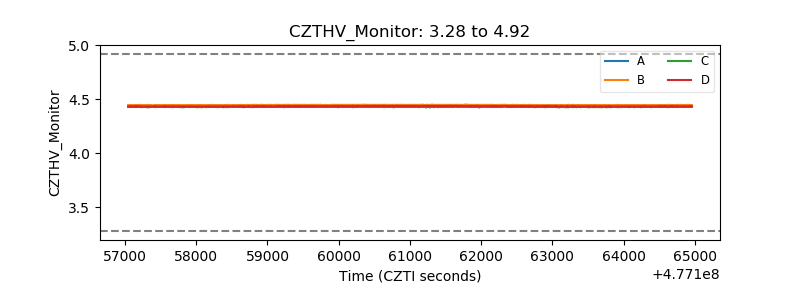 |
| D_VDD | 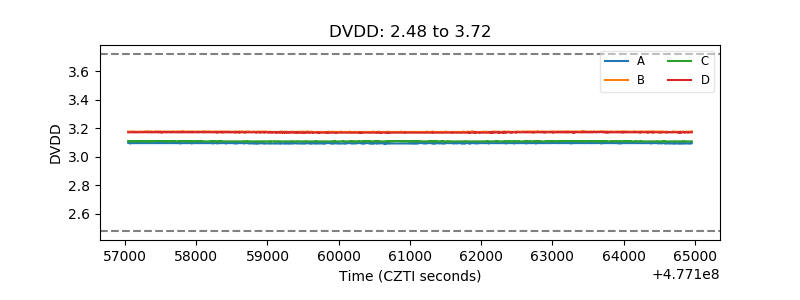 |
| Temperature 1 | 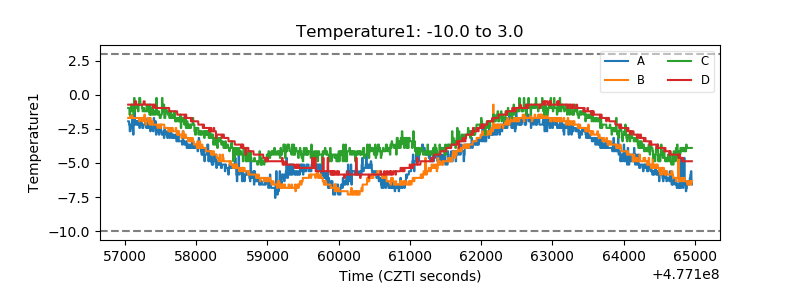 |
| Veto HV Monitor | 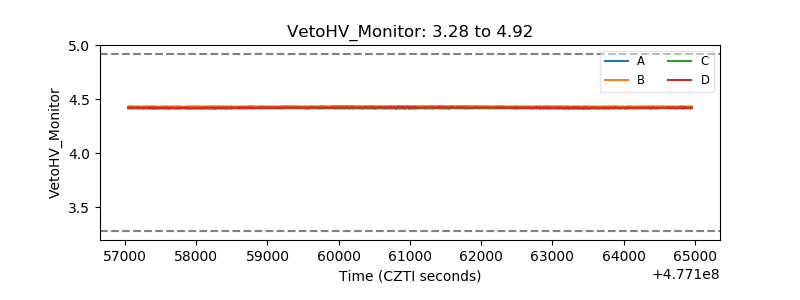 |
| Veto LLD | 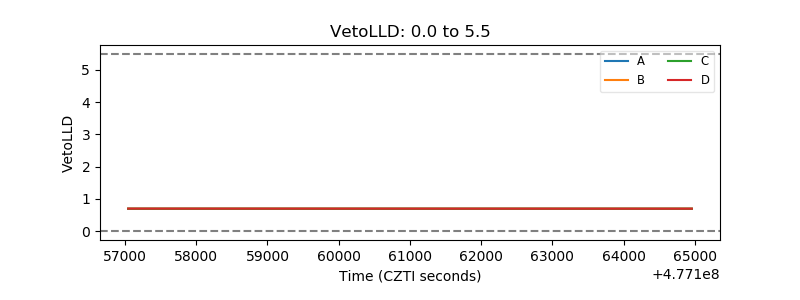 |
| Alpha Counter | 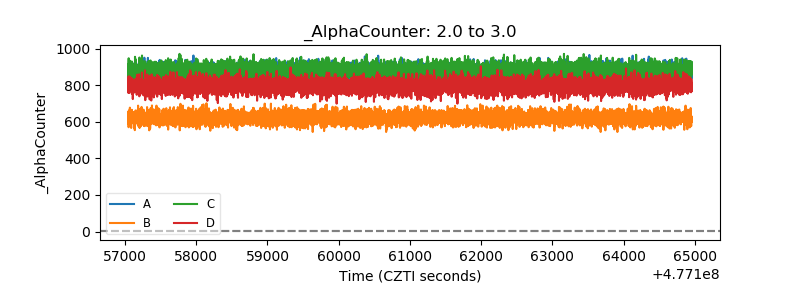 |
| _CPM_Rate | 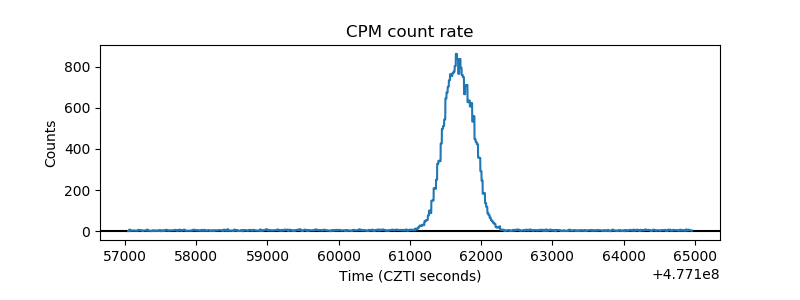 |
| CZT Counter | 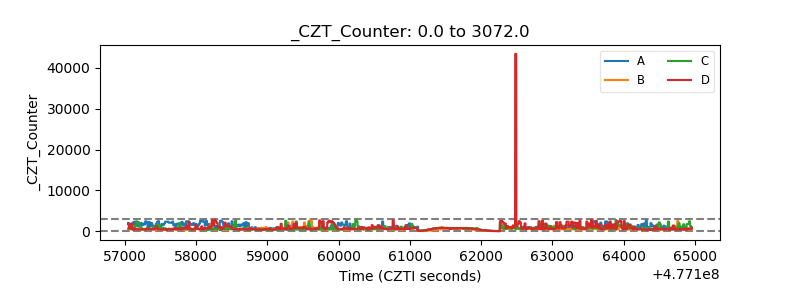 |
| +2.5 Volts monitor | 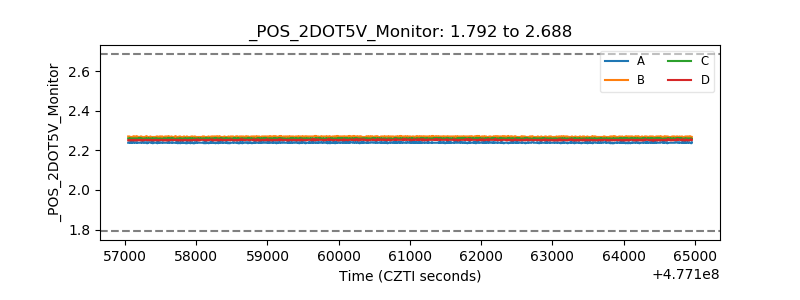 |
| +5 Volts monitor | 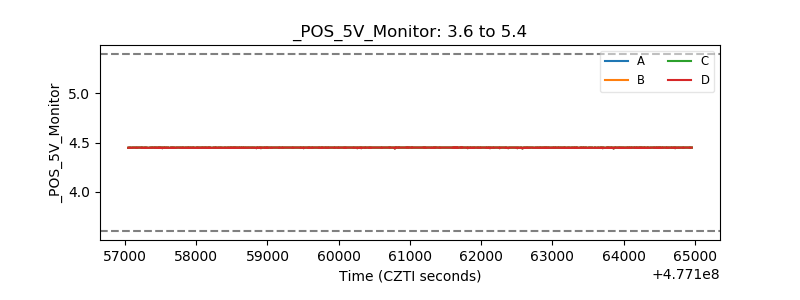 |
| _ROLL_ROT | 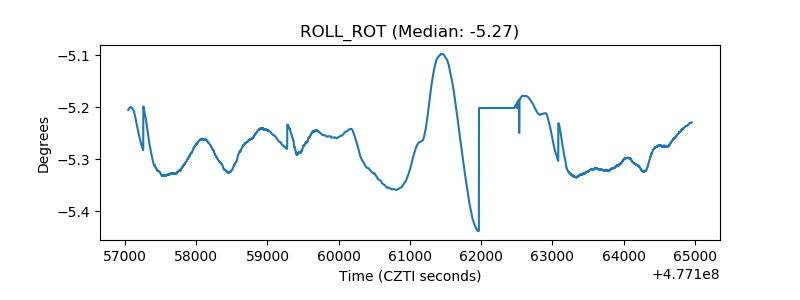 |
| _Roll_DEC | 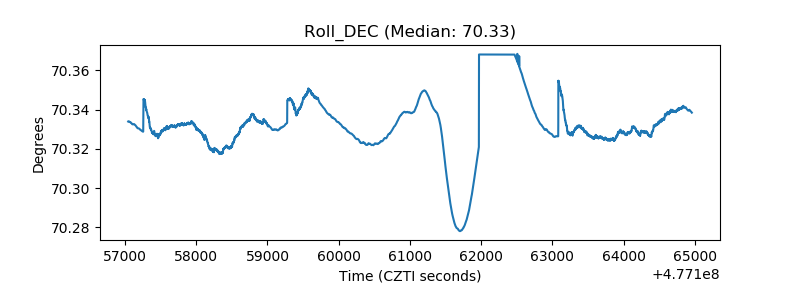 |
| _Roll_RA | 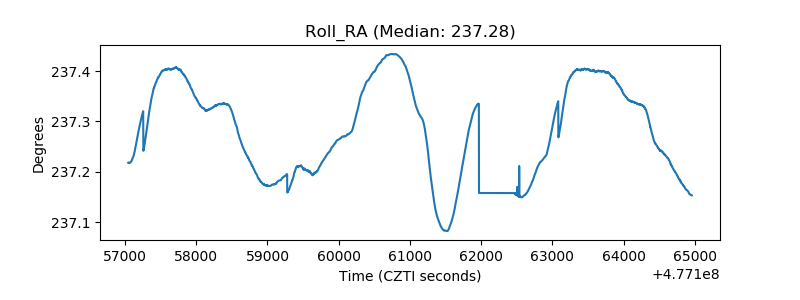 |
| Veto Counter | 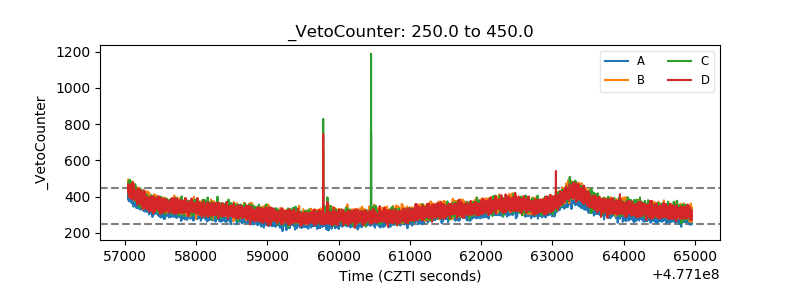 |