| Param | Original file | Final file |
|---|---|---|
| Filename | modeM0/AS1C07_001T01_9000006450_50923cztM0_level2.fits | modeM0/AS1C07_001T01_9000006450_50923cztM0_level2_quad_clean.evt |
| Size (bytes) | 2,430,008,640 | 208,788,480 |
| Size | 2.3 GB | 199.1 MB |
| Events in quadrant A | 39,689,262 | 631,583 |
| Events in quadrant B | 9,916,903 | 1,842,403 |
| Events in quadrant C | 21,496,520 | 1,223,348 |
| Events in quadrant D | 17,386,677 | 1,316,704 |
| Mode SS | |||
|---|---|---|---|
| Quadrant | BADHDUFLAG | Total packets | Discarded packets |
| A | 0 | 384 | 0 |
| B | 0 | 384 | 0 |
| C | 0 | 384 | 0 |
| D | 0 | 384 | 0 |
| Mode M0 | |||
|---|---|---|---|
| Quadrant | BADHDUFLAG | Total packets | Discarded packets |
| A | 0 | 131021 | 3 |
| B | 0 | 43534 | 3 |
| C | 0 | 76696 | 3 |
| D | 0 | 65230 | 3 |
| Mode M9 | |||
|---|---|---|---|
| Quadrant | BADHDUFLAG | Total packets | Discarded packets |
| A | 0 | 14 | 0 |
| B | 0 | 14 | 0 |
| C | 0 | 14 | 0 |
| D | 0 | 14 | 0 |
| Quadrant | Total seconds | Saturated seconds | Saturation percentage |
|---|---|---|---|
| A | 18962 | 12797 | 67.487607% |
| B | 18962 | 428 | 2.257146% |
| C | 18961 | 5057 | 26.670534% |
| D | 18961 | 2772 | 14.619482% |
Noise dominated data is calculated using 1-second bins in cleaned event files. If a bin has >2000 counts, and if more than 50% of those come from <1% of pixels, then it is considered to be noise-dominated and hence unusable.
| Quadrant | # 1 sec bins | Bins with >0 counts | Bins with >2000 counts | High rate bins dominated by noise | Noise dominated (total time) | Noise dominated (detector-on time) | Marked lightcurve |
|---|---|---|---|---|---|---|---|
| A | 20347 | 18962 | 11962 | 11962 | 58.79% | 63.08% | 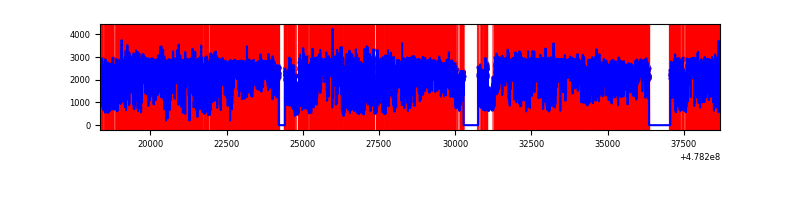 |
| B | 20347 | 18964 | 235 | 235 | 1.15% | 1.24% | 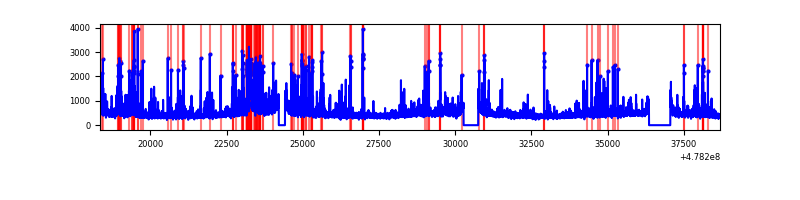 |
| C | 20346 | 18962 | 3923 | 3923 | 19.28% | 20.69% | 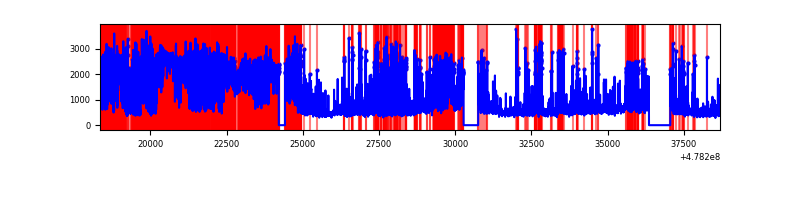 |
| D | 20346 | 18962 | 2661 | 2661 | 13.08% | 14.03% | 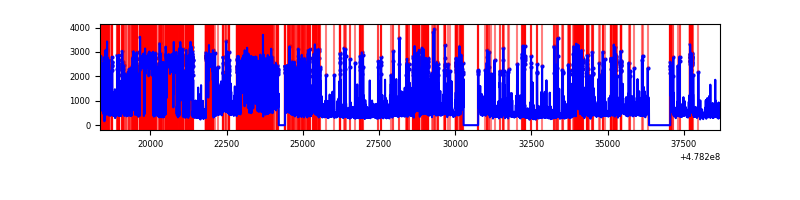 |
Top three noisy pixels from each quadrant. If the there are fewer than three noisy pixels in the level2.evt file, extra rows are filled as -1
| Pixel properties | Quadrant properties | ||||||
|---|---|---|---|---|---|---|---|
| Quadrant | DetID | PixID | Counts | Sigma | Mean | Median | Sigma |
| A | 14 | 254 | 26006966 | 78634.75 | 1296 | 1260 | 330.7 |
| A | 4 | 4 | 6145220 | 18577.8 | 1296 | 1260 | 330.7 |
| A | 8 | 249 | 394802 | 1189.97 | 1296 | 1260 | 330.7 |
| B | 2 | 249 | 468712 | 1123.82 | 1968 | 1895 | 415.4 |
| B | 10 | 44 | 344662 | 825.18 | 1968 | 1895 | 415.4 |
| B | 4 | 170 | 288993 | 691.17 | 1968 | 1895 | 415.4 |
| C | 4 | 210 | 5762541 | 12376.14 | 1661 | 1643 | 465.5 |
| C | 5 | 10 | 1914989 | 4110.44 | 1661 | 1643 | 465.5 |
| C | 12 | 247 | 1615290 | 3466.6 | 1661 | 1643 | 465.5 |
| D | 15 | 184 | 3308039 | 6547.83 | 1789 | 1727 | 504.9 |
| D | 2 | 249 | 1319305 | 2609.34 | 1789 | 1727 | 504.9 |
| D | 8 | 176 | 772815 | 1527.07 | 1789 | 1727 | 504.9 |
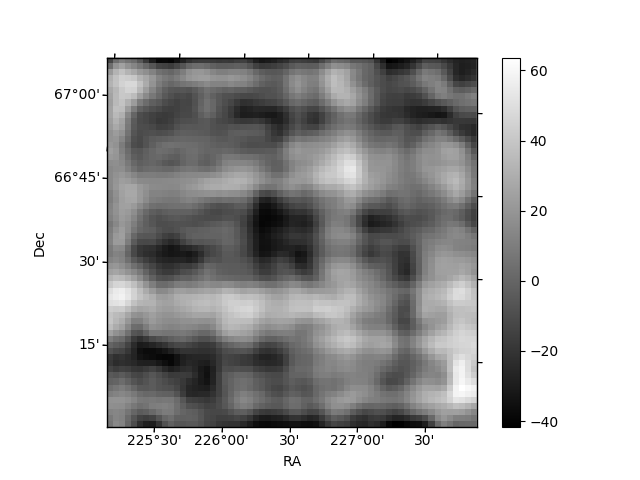
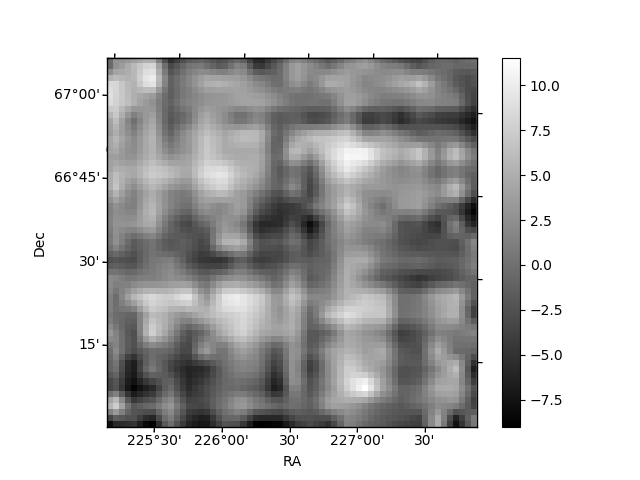
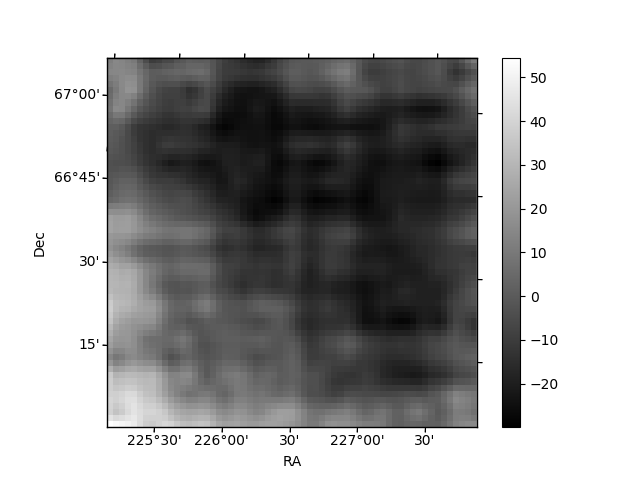
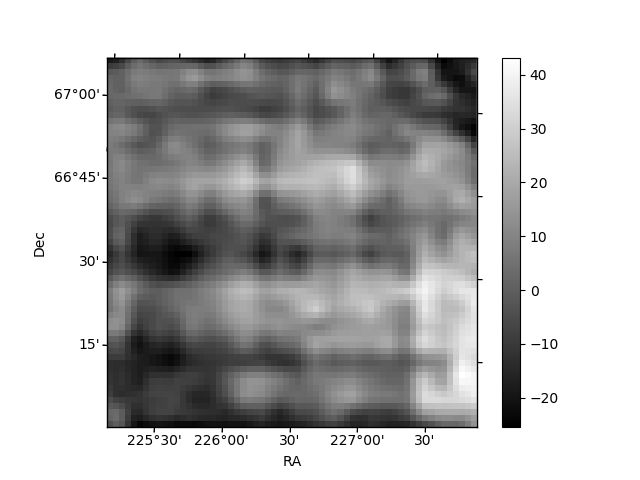
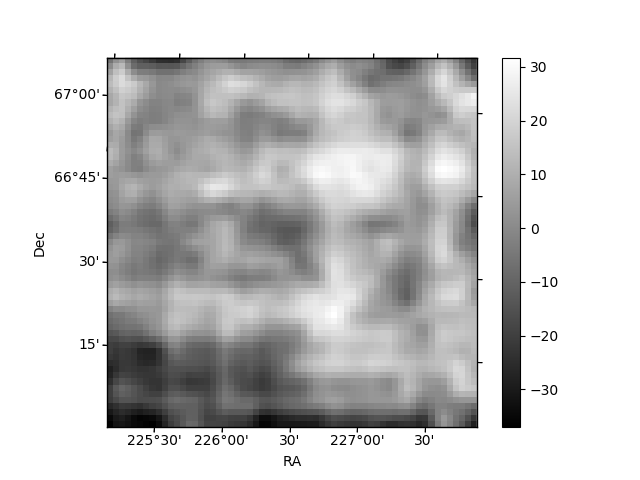
Histogram calculated using DETX and DETY for each event in the final _common_clean file
| Quadrant A | 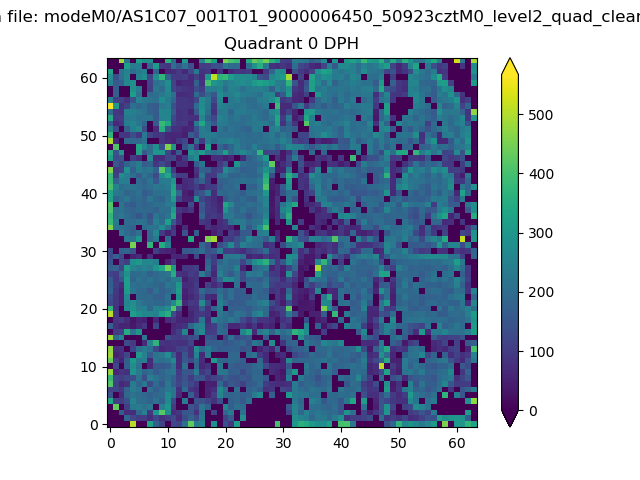 |
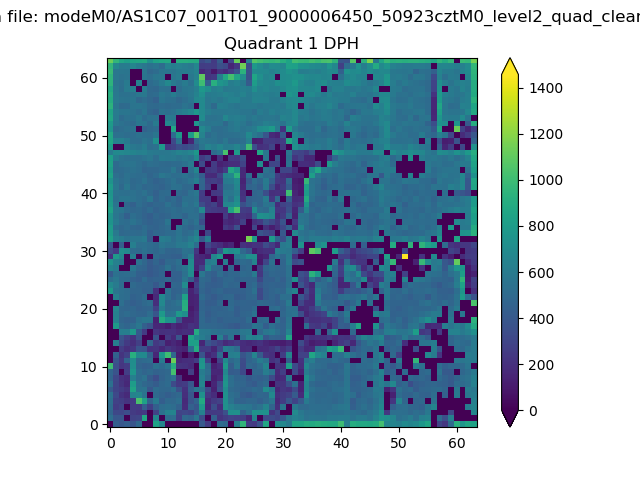 |
Quadrant B |
|---|---|---|---|
| Quadrant D | 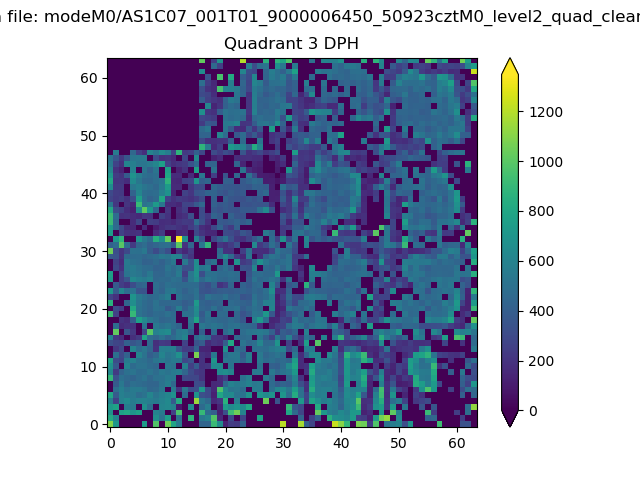 |
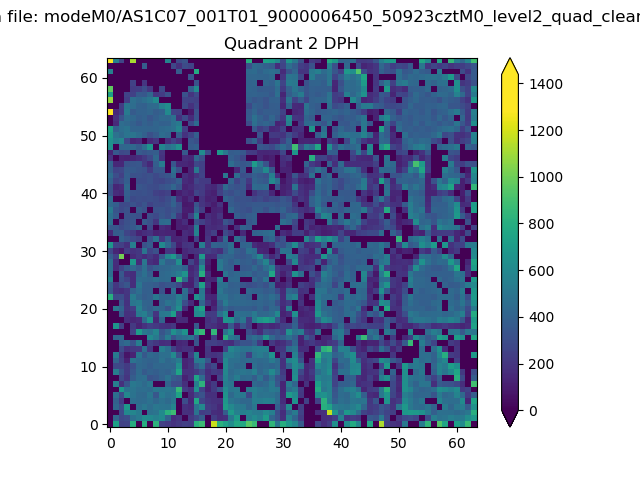 |
Quadrant C |
| Plot type | Count rate plots | Images |
|---|---|---|
| Comparison with Poisson distribution Blue bars denote a histogram of data divided into 1 sec bins. Red curve is a Poisson curve with rate = median count rate of data. |
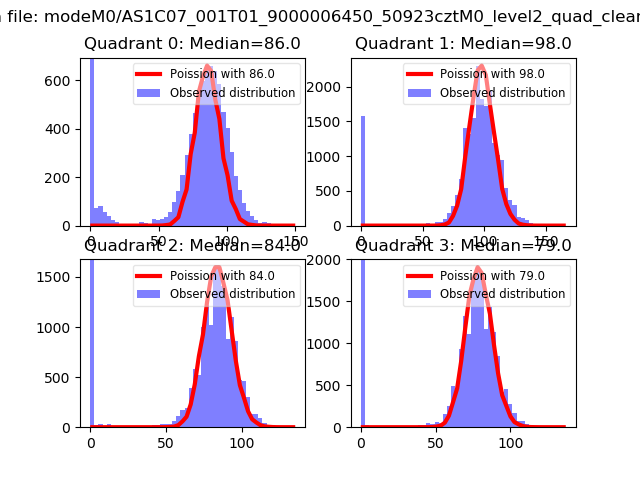 |
 |
| Quadrant-wise count rates Data is divided into 100 sec bins |
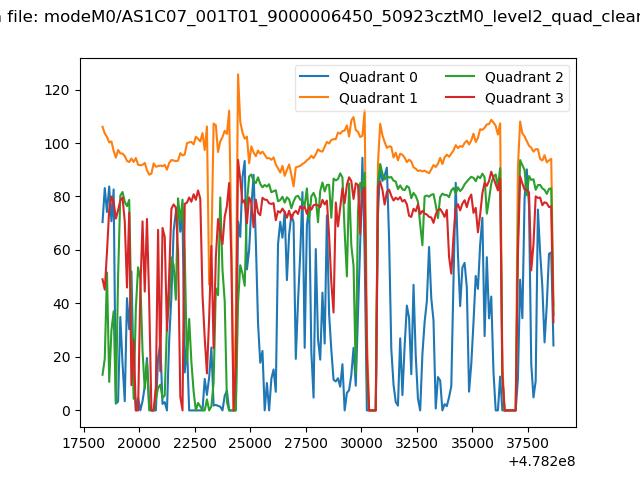 |
|
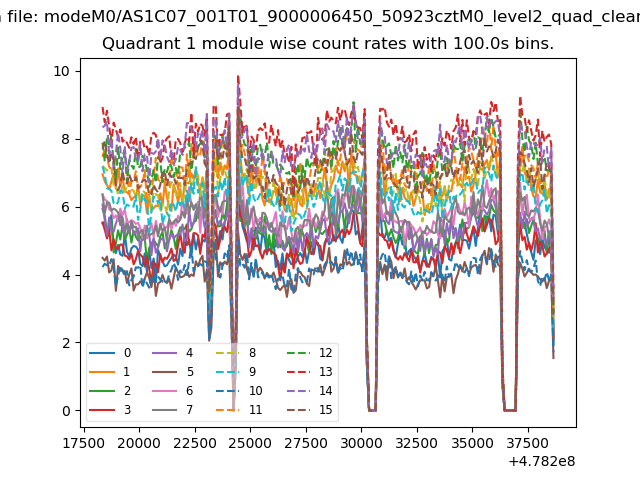
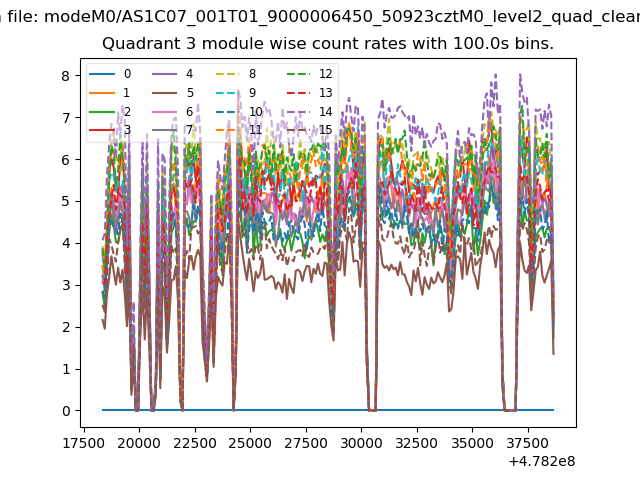
| Module-wise count rates for Quadrant A Data is divided into 100 sec bins |
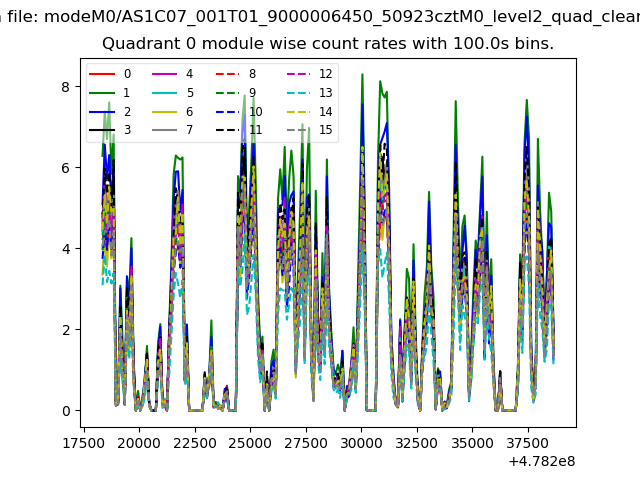 |
 |
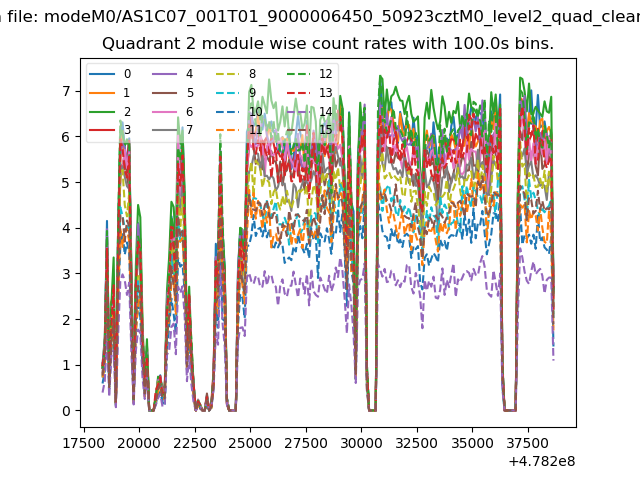
| Module-wise count rates for Quadrant B Data is divided into 100 sec bins |
 |
 |
| Module-wise count rates for Quadrant C Data is divided into 100 sec bins |
 |
 |
| Module-wise count rates for Quadrant D Data is divided into 100 sec bins |
 |
 |
| Parameter | Plot |
|---|---|
| CZT HV Monitor | 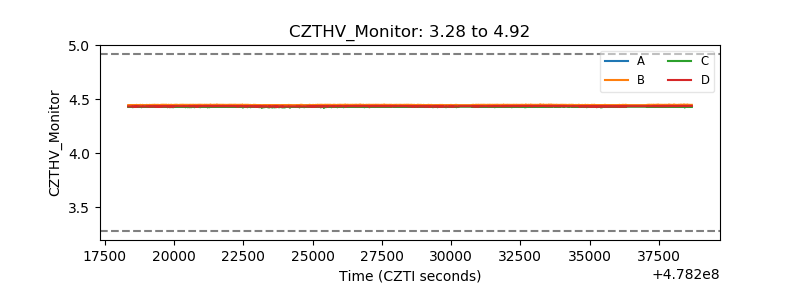 |
| D_VDD | 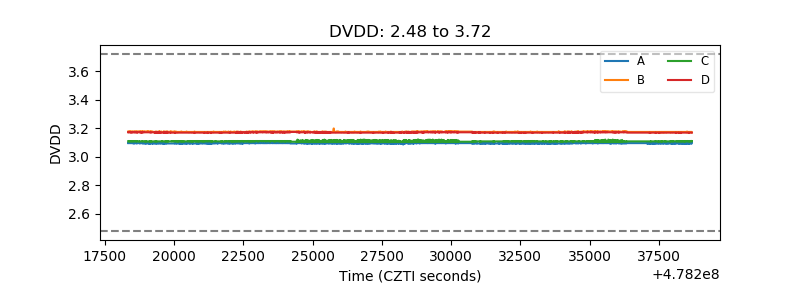 |
| Temperature 1 | 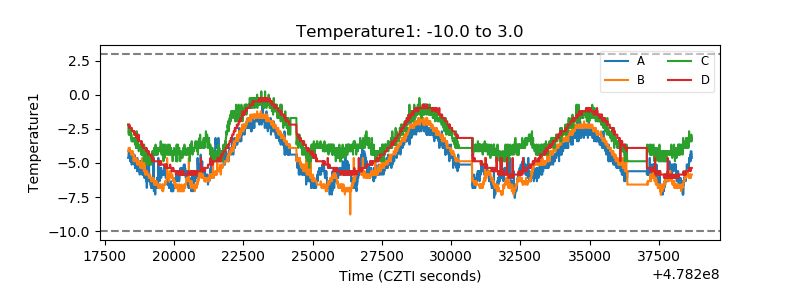 |
| Veto HV Monitor |  |
| Veto LLD | 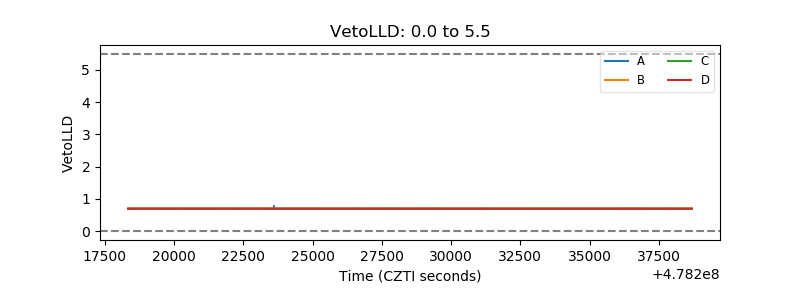 |
| Alpha Counter | 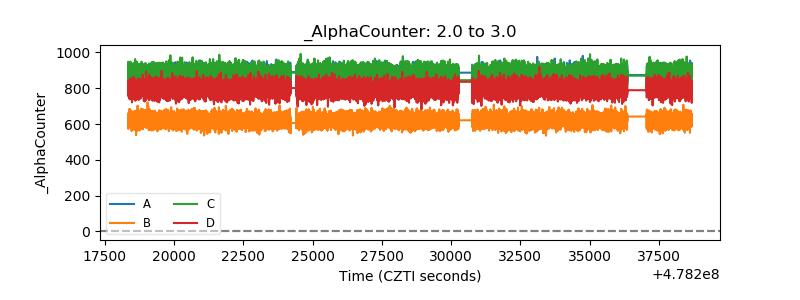 |
| _CPM_Rate | 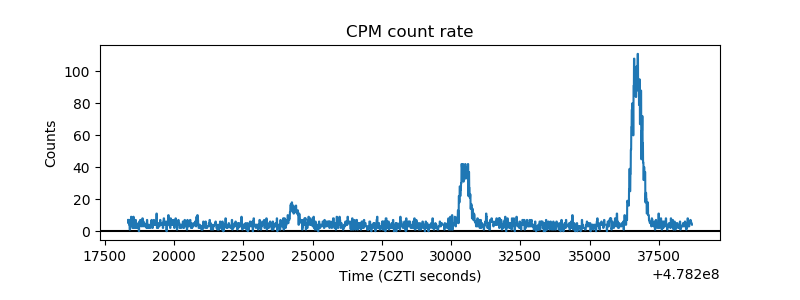 |
| CZT Counter | 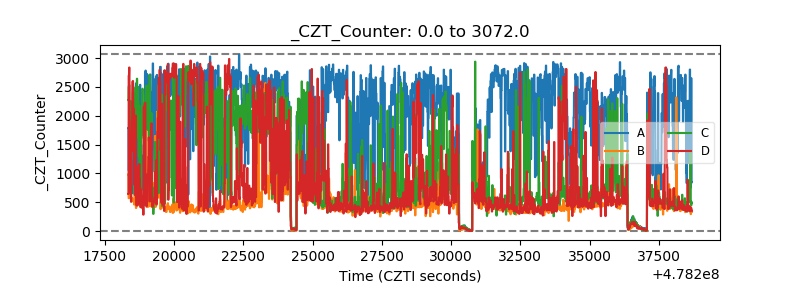 |
| +2.5 Volts monitor | 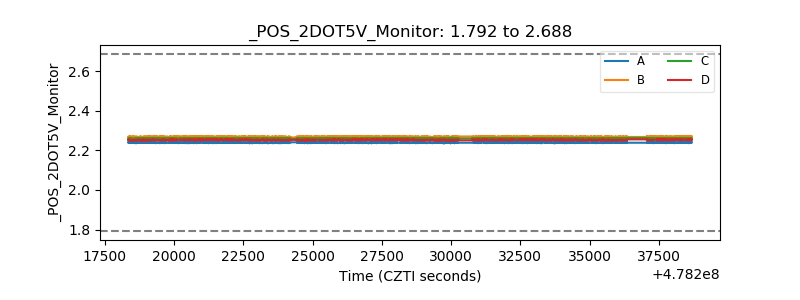 |
| +5 Volts monitor | 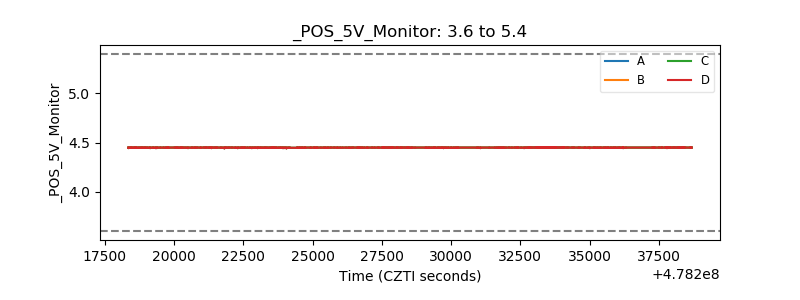 |
| _ROLL_ROT | 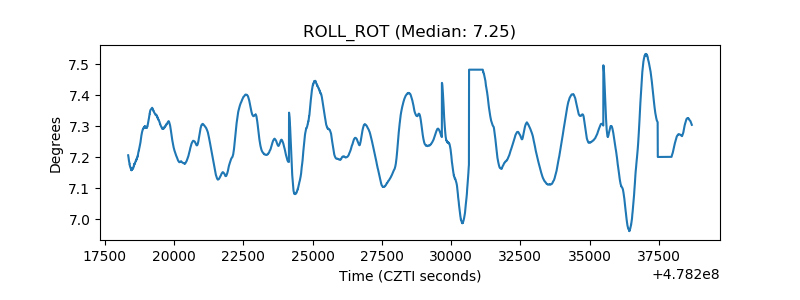 |
| _Roll_DEC | 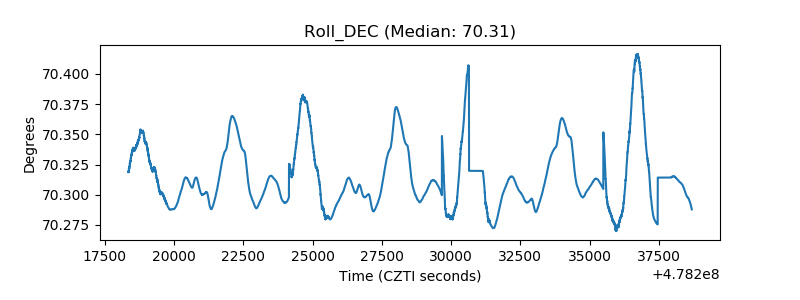 |
| _Roll_RA | 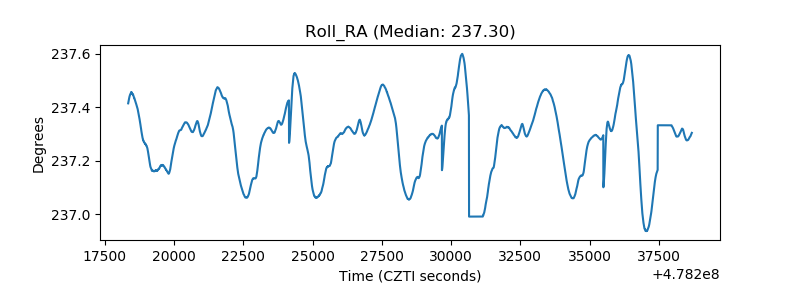 |
| Veto Counter | 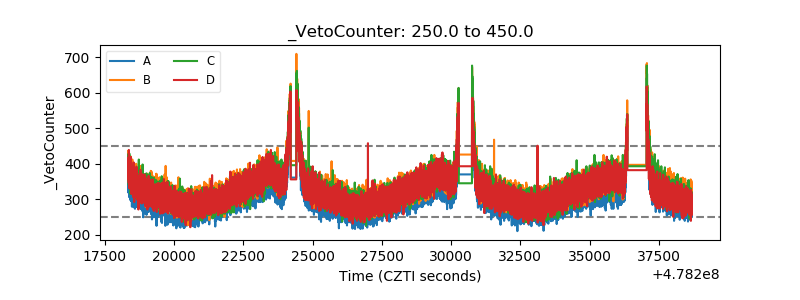 |