| Param | Original file | Final file |
|---|---|---|
| Filename | modeM0/AS1C07_001T01_9000006450_50924cztM0_level2.fits | modeM0/AS1C07_001T01_9000006450_50924cztM0_level2_quad_clean.evt |
| Size (bytes) | 638,864,640 | 74,145,600 |
| Size | 609.3 MB | 70.7 MB |
| Events in quadrant A | 12,975,304 | 212,520 |
| Events in quadrant B | 3,039,595 | 594,322 |
| Events in quadrant C | 3,753,646 | 528,424 |
| Events in quadrant D | 3,415,361 | 492,058 |
| Mode SS | |||
|---|---|---|---|
| Quadrant | BADHDUFLAG | Total packets | Discarded packets |
| A | 0 | 120 | 0 |
| B | 0 | 120 | 0 |
| C | 0 | 120 | 0 |
| D | 0 | 120 | 0 |
| Mode M0 | |||
|---|---|---|---|
| Quadrant | BADHDUFLAG | Total packets | Discarded packets |
| A | 0 | 42633 | 7 |
| B | 0 | 13505 | 1 |
| C | 0 | 14967 | 1 |
| D | 0 | 14546 | 1 |
| Mode M9 | |||
|---|---|---|---|
| Quadrant | BADHDUFLAG | Total packets | Discarded packets |
| A | 0 | 9 | 0 |
| B | 0 | 9 | 0 |
| C | 0 | 9 | 0 |
| D | 0 | 9 | 0 |
| Quadrant | Total seconds | Saturated seconds | Saturation percentage |
|---|---|---|---|
| A | 5980 | 4053 | 67.775920% |
| B | 5980 | 115 | 1.923077% |
| C | 5981 | 97 | 1.621802% |
| D | 5981 | 163 | 2.725297% |
Noise dominated data is calculated using 1-second bins in cleaned event files. If a bin has >2000 counts, and if more than 50% of those come from <1% of pixels, then it is considered to be noise-dominated and hence unusable.
| Quadrant | # 1 sec bins | Bins with >0 counts | Bins with >2000 counts | High rate bins dominated by noise | Noise dominated (total time) | Noise dominated (detector-on time) | Marked lightcurve |
|---|---|---|---|---|---|---|---|
| A | 6865 | 5980 | 3969 | 3969 | 57.82% | 66.37% | 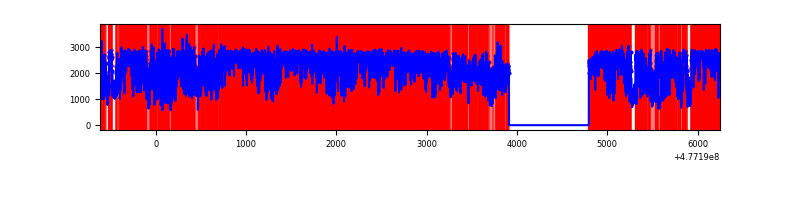 |
| B | 6865 | 5981 | 83 | 83 | 1.21% | 1.39% | 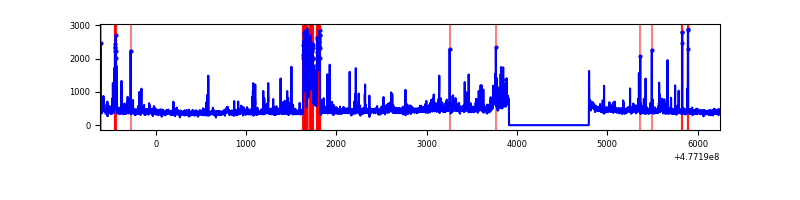 |
| C | 6866 | 5982 | 111 | 111 | 1.62% | 1.86% |  |
| D | 6866 | 5982 | 170 | 170 | 2.48% | 2.84% | 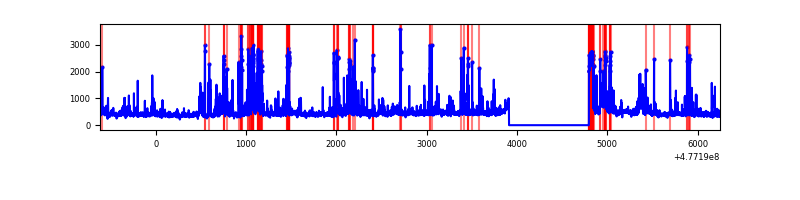 |
Top three noisy pixels from each quadrant. If the there are fewer than three noisy pixels in the level2.evt file, extra rows are filled as -1
| Pixel properties | Quadrant properties | ||||||
|---|---|---|---|---|---|---|---|
| Quadrant | DetID | PixID | Counts | Sigma | Mean | Median | Sigma |
| A | 14 | 254 | 7569960 | 71084.51 | 421 | 411 | 106.5 |
| A | 4 | 4 | 2254022 | 21163.33 | 421 | 411 | 106.5 |
| A | 3 | 14 | 944472 | 8865.54 | 421 | 411 | 106.5 |
| B | 10 | 61 | 231730 | 1746.87 | 613 | 591 | 132.3 |
| B | 3 | 249 | 96481 | 724.7 | 613 | 591 | 132.3 |
| B | 8 | 128 | 51159 | 382.17 | 613 | 591 | 132.3 |
| C | 12 | 247 | 401187 | 2456.34 | 596 | 590 | 163.1 |
| C | 13 | 3 | 237365 | 1451.84 | 596 | 590 | 163.1 |
| C | 5 | 10 | 225668 | 1380.11 | 596 | 590 | 163.1 |
| D | 8 | 176 | 359216 | 2175.68 | 586 | 566 | 164.8 |
| D | 2 | 249 | 353228 | 2139.35 | 586 | 566 | 164.8 |
| D | 3 | 12 | 70386 | 423.55 | 586 | 566 | 164.8 |
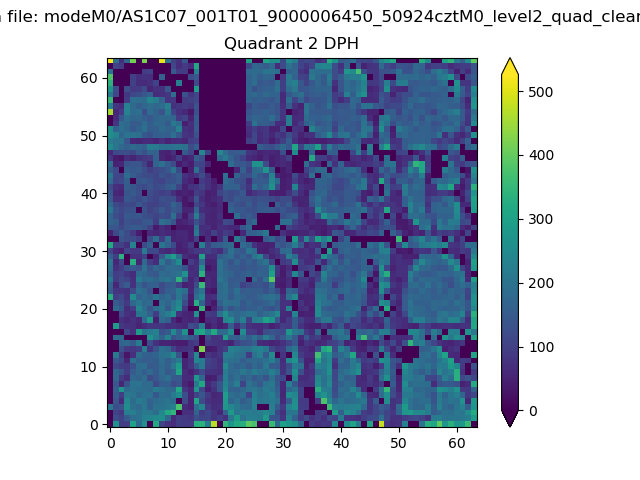
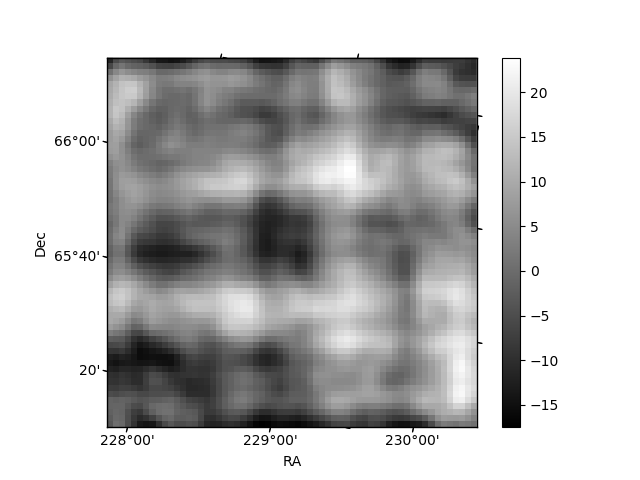
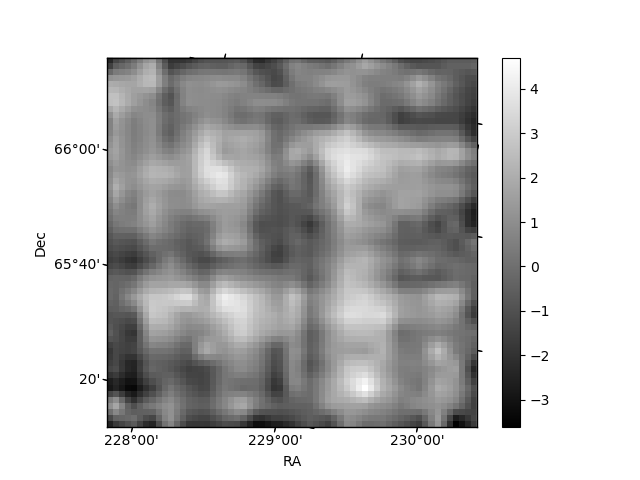
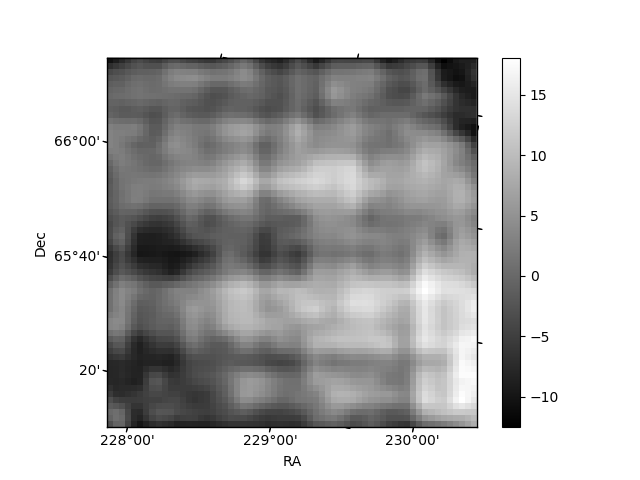
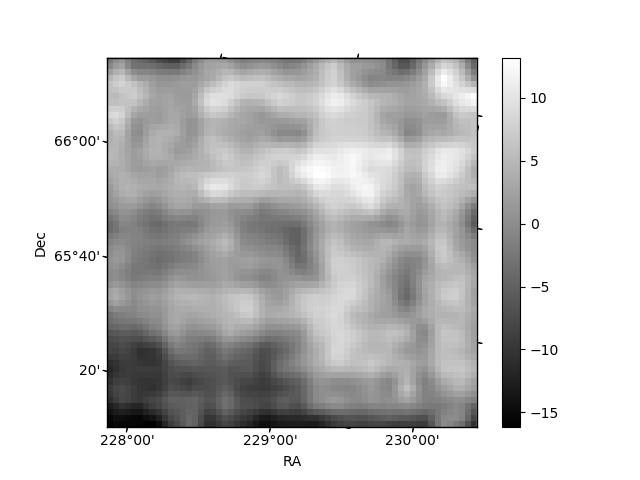
Histogram calculated using DETX and DETY for each event in the final _common_clean file
| Quadrant A | 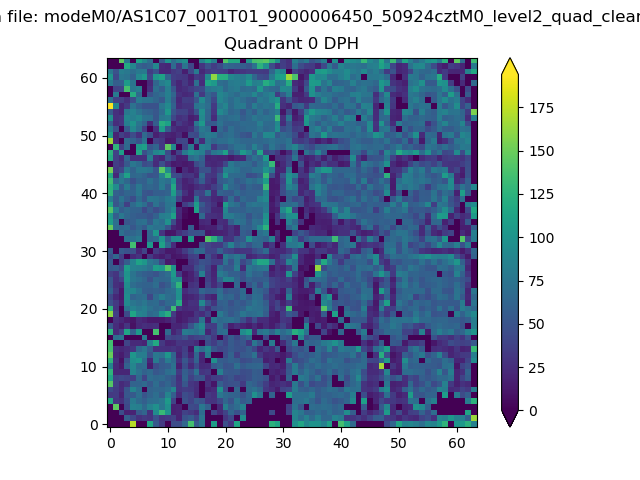 |
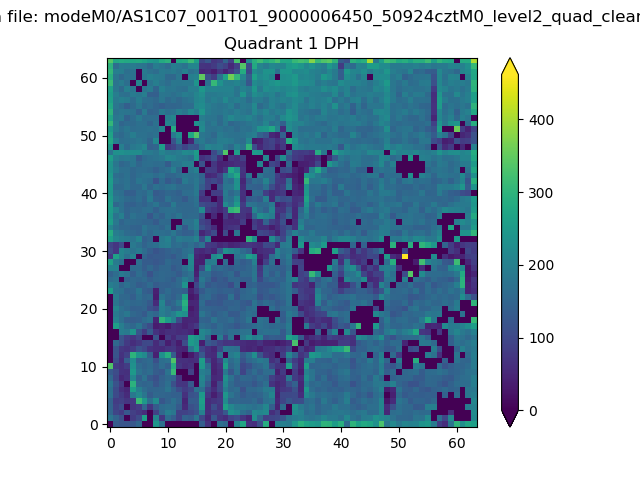 |
Quadrant B |
|---|---|---|---|
| Quadrant D | 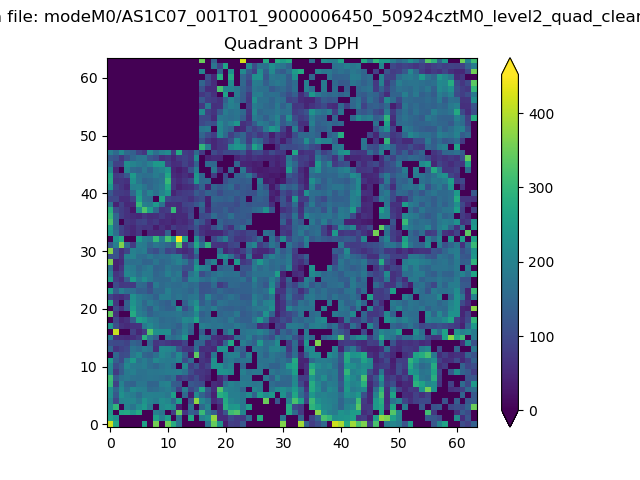 |
 |
Quadrant C |
| Plot type | Count rate plots | Images |
|---|---|---|
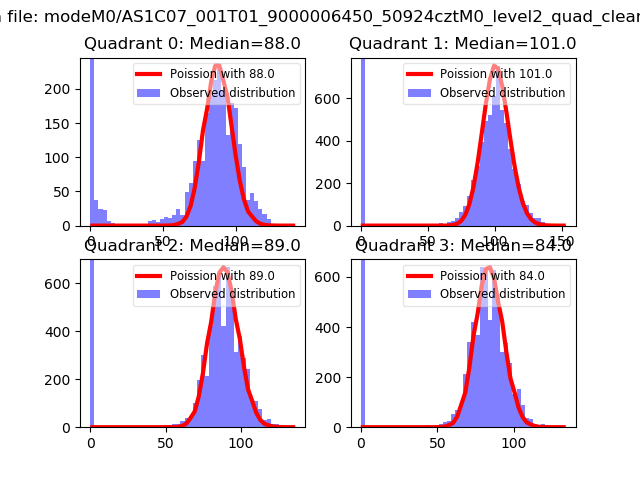
| Comparison with Poisson distribution Blue bars denote a histogram of data divided into 1 sec bins. Red curve is a Poisson curve with rate = median count rate of data. |
 |
 |
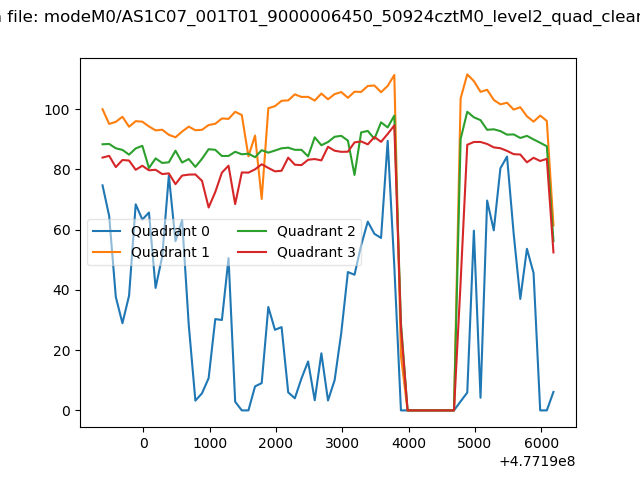
| Quadrant-wise count rates Data is divided into 100 sec bins |
 |
|
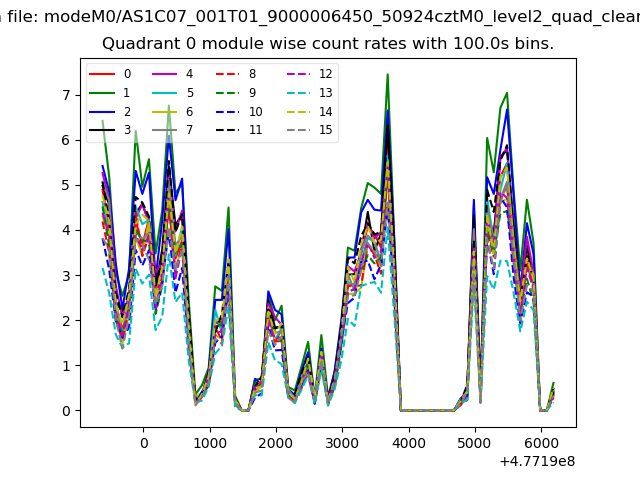
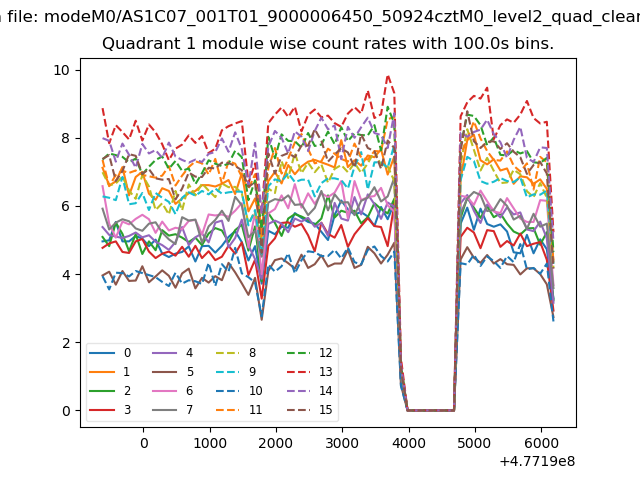
| Module-wise count rates for Quadrant A Data is divided into 100 sec bins |
 |
 |
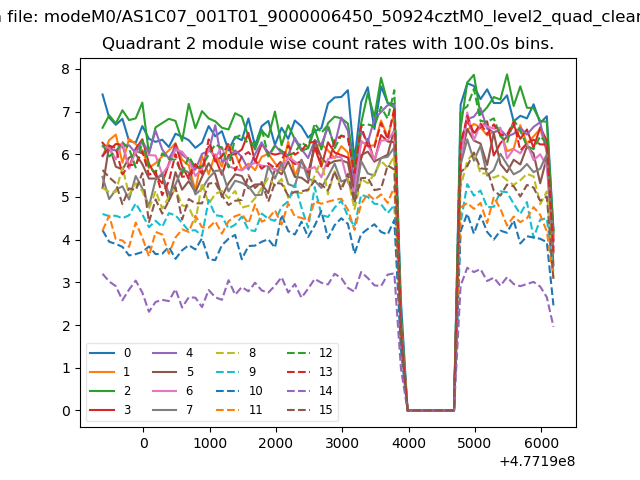
| Module-wise count rates for Quadrant B Data is divided into 100 sec bins |
 |
 |
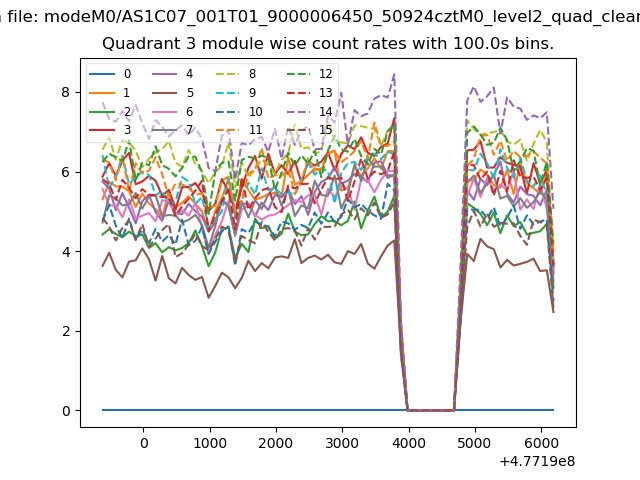
| Module-wise count rates for Quadrant C Data is divided into 100 sec bins |
 |
 |
| Module-wise count rates for Quadrant D Data is divided into 100 sec bins |
 |
 |
| Parameter | Plot |
|---|---|
| CZT HV Monitor | 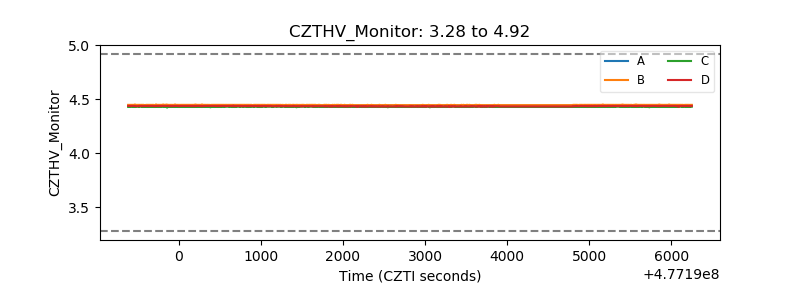 |
| D_VDD | 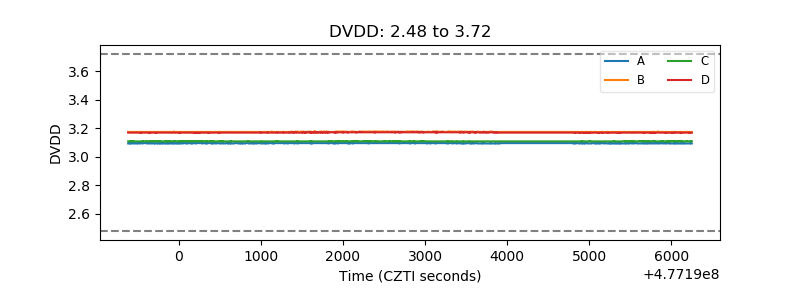 |
| Temperature 1 | 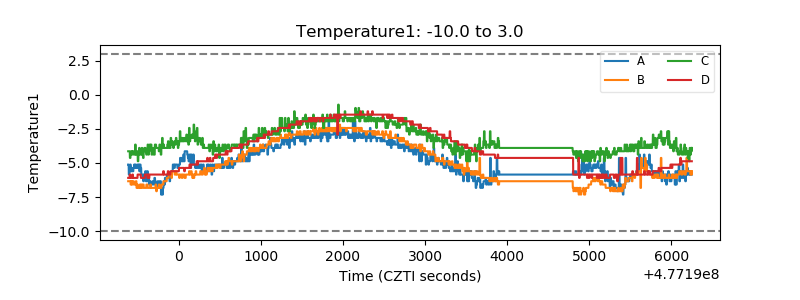 |
| Veto HV Monitor | 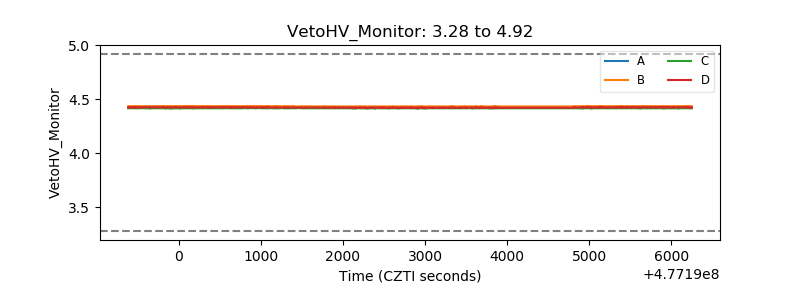 |
| Veto LLD | 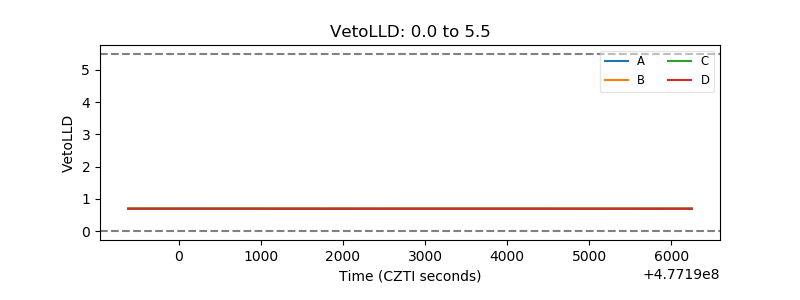 |
| Alpha Counter | 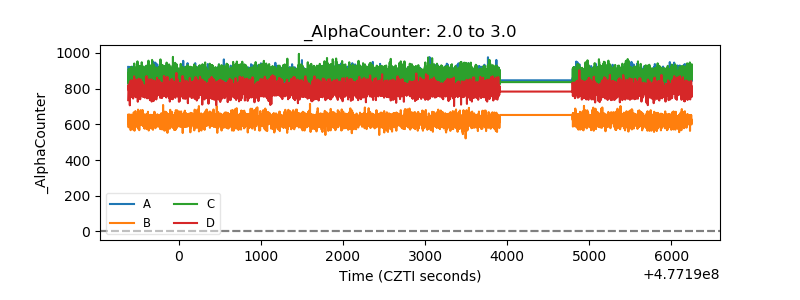 |
| _CPM_Rate | 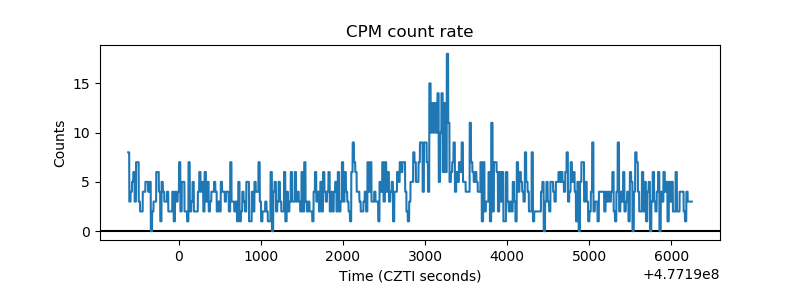 |
| CZT Counter | 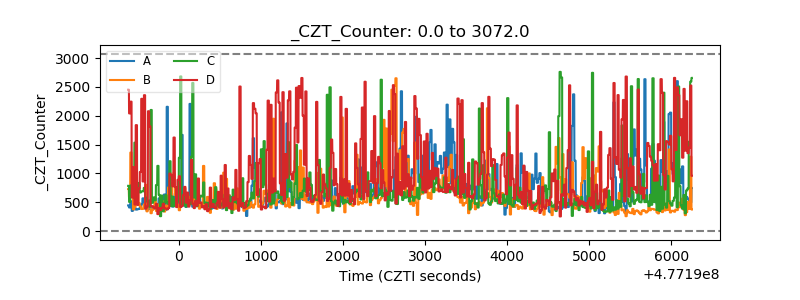 |
| +2.5 Volts monitor | 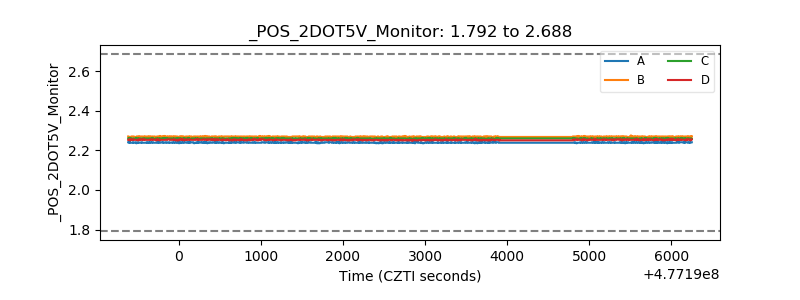 |
| +5 Volts monitor | 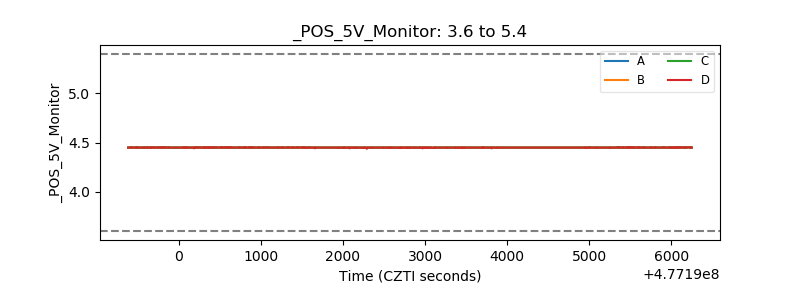 |
| _ROLL_ROT | 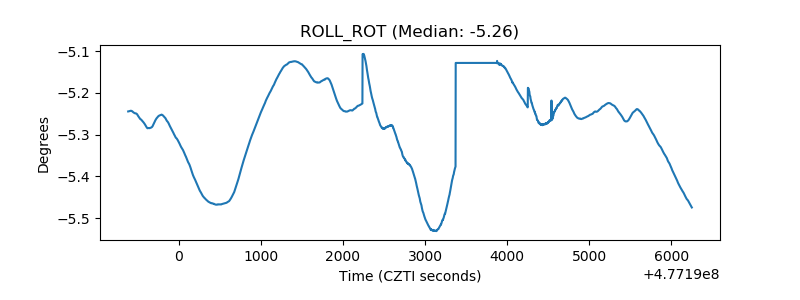 |
| _Roll_DEC | 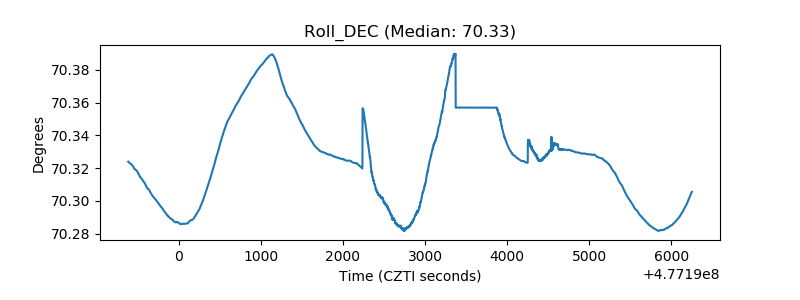 |
| _Roll_RA | 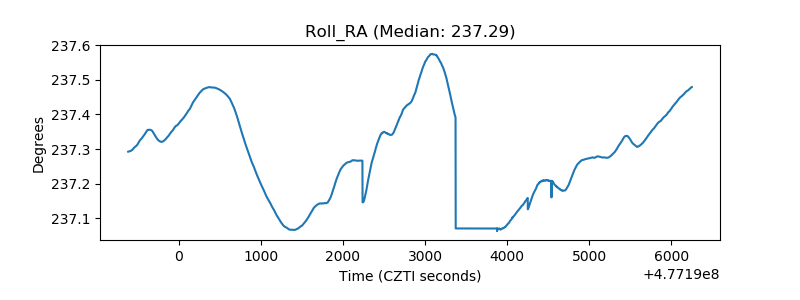 |
| Veto Counter | 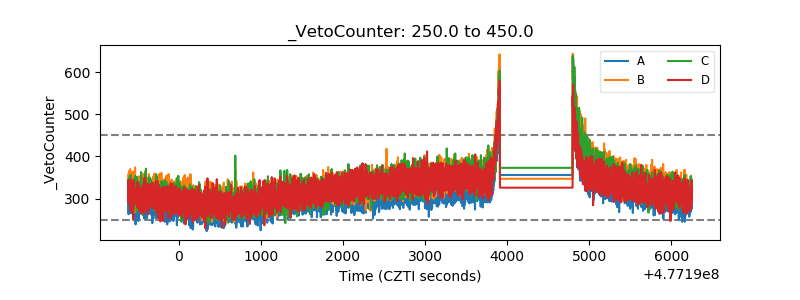 |