| Param | Original file | Final file |
|---|---|---|
| Filename | modeM0/AS1C07_001T01_9000006450_50927cztM0_level2.fits | modeM0/AS1C07_001T01_9000006450_50927cztM0_level2_quad_clean.evt |
| Size (bytes) | 718,948,800 | 72,604,800 |
| Size | 685.6 MB | 69.2 MB |
| Events in quadrant A | 13,906,391 | 108,811 |
| Events in quadrant B | 4,175,461 | 621,793 |
| Events in quadrant C | 4,064,351 | 537,343 |
| Events in quadrant D | 3,995,210 | 506,817 |
| Mode SS | |||
|---|---|---|---|
| Quadrant | BADHDUFLAG | Total packets | Discarded packets |
| A | 0 | 122 | 0 |
| B | 0 | 122 | 0 |
| C | 0 | 122 | 0 |
| D | 0 | 122 | 0 |
| Mode M0 | |||
|---|---|---|---|
| Quadrant | BADHDUFLAG | Total packets | Discarded packets |
| A | 0 | 45460 | 1 |
| B | 0 | 16787 | 1 |
| C | 0 | 16351 | 1 |
| D | 0 | 16245 | 1 |
| Mode M9 | |||
|---|---|---|---|
| Quadrant | BADHDUFLAG | Total packets | Discarded packets |
| A | 0 | 11 | 0 |
| B | 0 | 11 | 0 |
| C | 0 | 11 | 0 |
| D | 0 | 11 | 0 |
| Quadrant | Total seconds | Saturated seconds | Saturation percentage |
|---|---|---|---|
| A | 6068 | 5111 | 84.228741% |
| B | 6069 | 319 | 5.256220% |
| C | 6069 | 402 | 6.623826% |
| D | 6068 | 368 | 6.064601% |
Noise dominated data is calculated using 1-second bins in cleaned event files. If a bin has >2000 counts, and if more than 50% of those come from <1% of pixels, then it is considered to be noise-dominated and hence unusable.
| Quadrant | # 1 sec bins | Bins with >0 counts | Bins with >2000 counts | High rate bins dominated by noise | Noise dominated (total time) | Noise dominated (detector-on time) | Marked lightcurve |
|---|---|---|---|---|---|---|---|
| A | 7172 | 6067 | 4661 | 4661 | 64.99% | 76.83% | 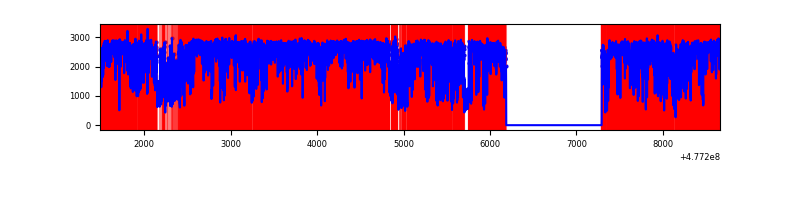 |
| B | 7174 | 6069 | 200 | 200 | 2.79% | 3.30% | 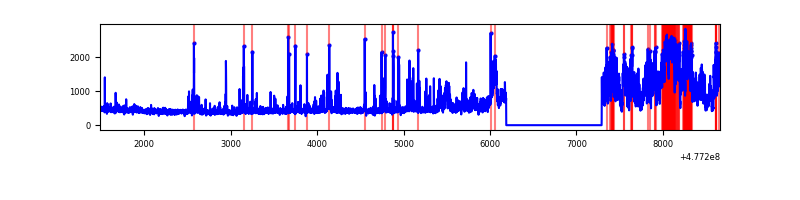 |
| C | 7174 | 6070 | 361 | 361 | 5.03% | 5.95% | 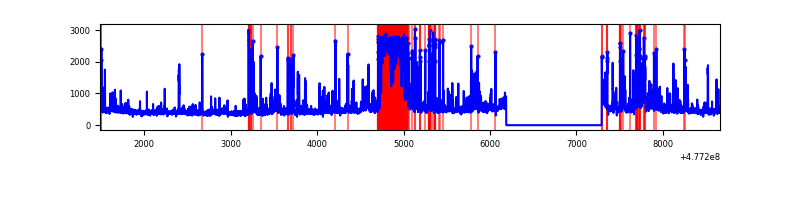 |
| D | 7173 | 6068 | 357 | 357 | 4.98% | 5.88% | 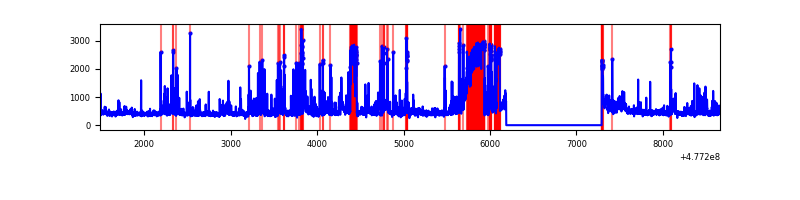 |
Top three noisy pixels from each quadrant. If the there are fewer than three noisy pixels in the level2.evt file, extra rows are filled as -1
| Pixel properties | Quadrant properties | ||||||
|---|---|---|---|---|---|---|---|
| Quadrant | DetID | PixID | Counts | Sigma | Mean | Median | Sigma |
| A | 14 | 254 | 11884828 | 173660.99 | 264 | 256 | 68.4 |
| A | 4 | 4 | 537212 | 7846.16 | 264 | 256 | 68.4 |
| A | 12 | 3 | 112499 | 1640.13 | 264 | 256 | 68.4 |
| B | 10 | 254 | 1313315 | 9744.78 | 636 | 613 | 134.7 |
| B | 0 | 171 | 87058 | 641.72 | 636 | 613 | 134.7 |
| B | 10 | 247 | 78286 | 576.6 | 636 | 613 | 134.7 |
| C | 12 | 252 | 965003 | 5781.78 | 603 | 597 | 166.8 |
| C | 1 | 60 | 173697 | 1037.76 | 603 | 597 | 166.8 |
| C | 13 | 3 | 85467 | 508.81 | 603 | 597 | 166.8 |
| D | 7 | 222 | 658026 | 3906.26 | 606 | 582 | 168.3 |
| D | 2 | 249 | 427967 | 2539.34 | 606 | 582 | 168.3 |
| D | 3 | 12 | 135820 | 803.53 | 606 | 582 | 168.3 |
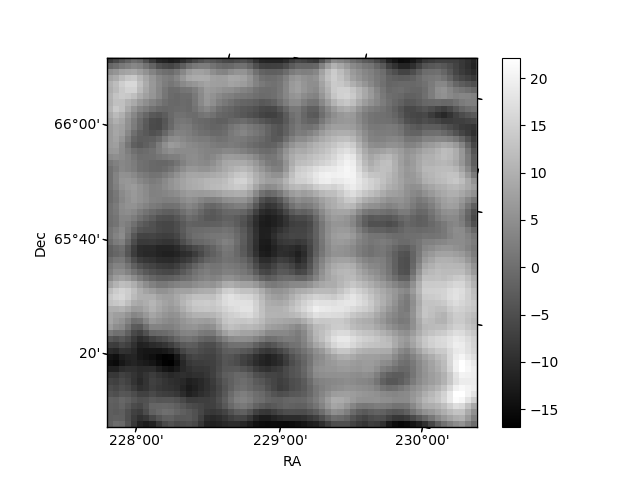
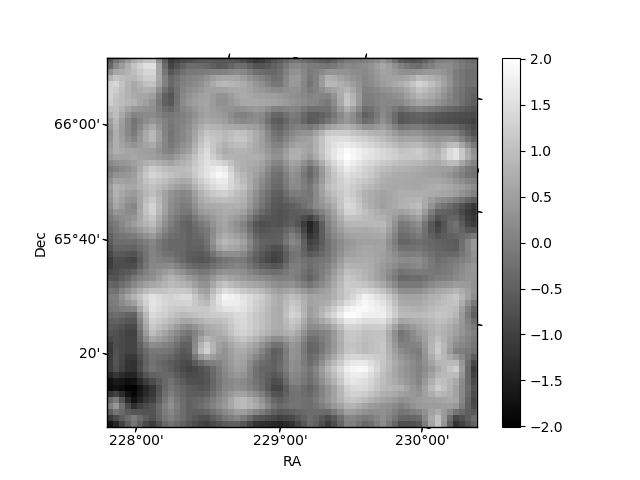
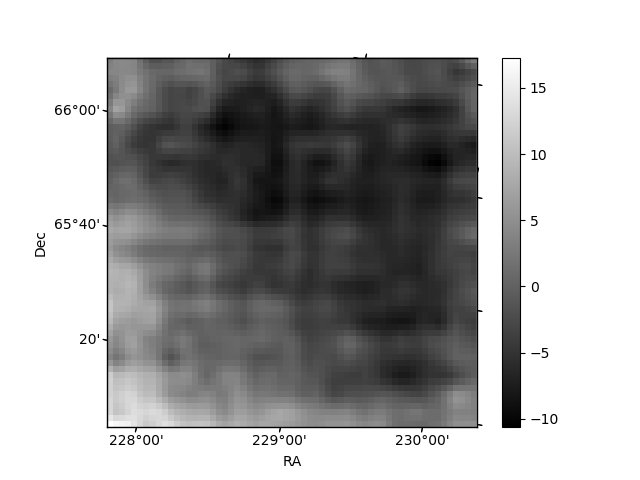
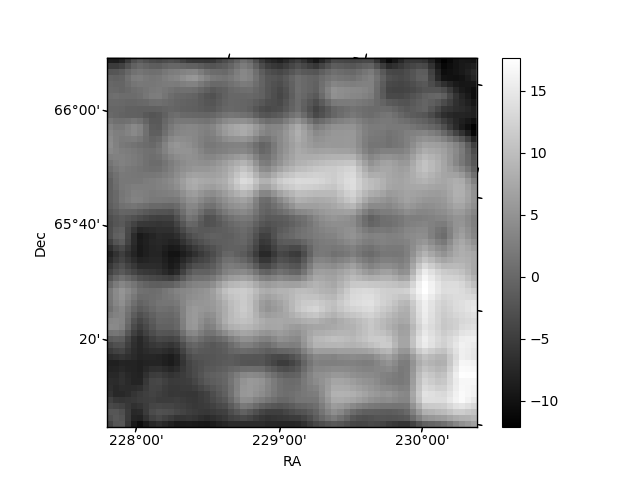
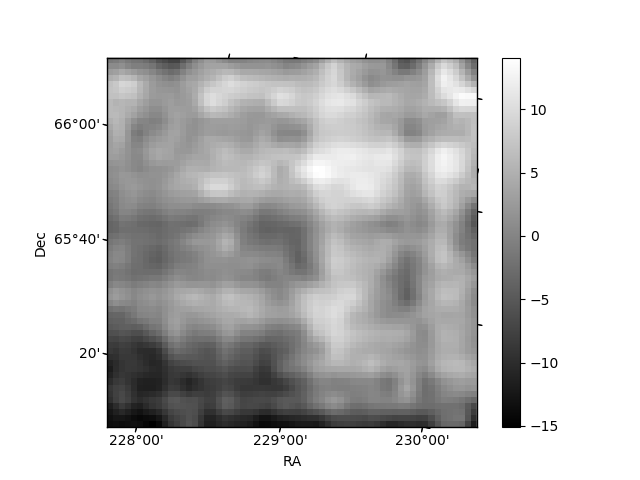
Histogram calculated using DETX and DETY for each event in the final _common_clean file
| Quadrant A | 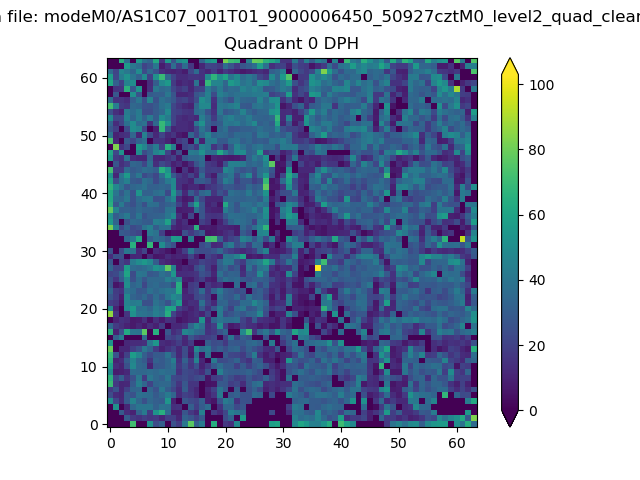 |
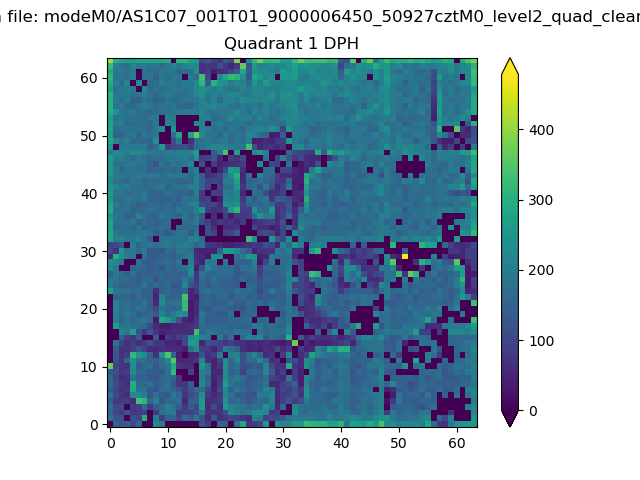 |
Quadrant B |
|---|---|---|---|
| Quadrant D | 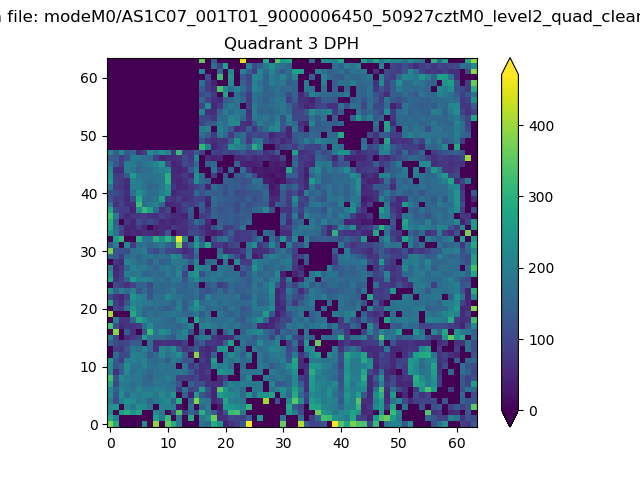 |
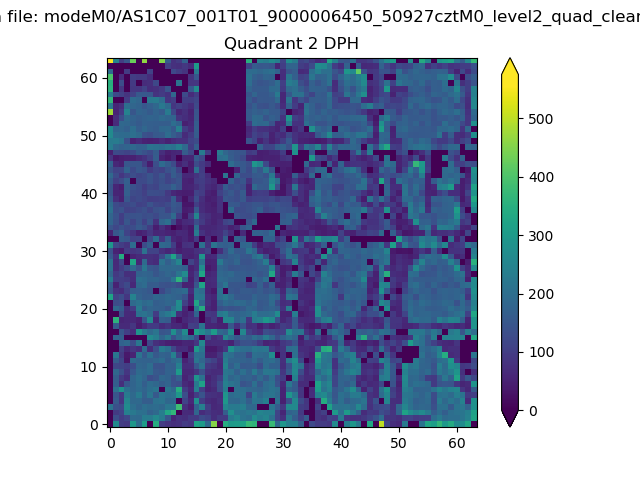 |
Quadrant C |
| Plot type | Count rate plots | Images |
|---|---|---|
| Comparison with Poisson distribution Blue bars denote a histogram of data divided into 1 sec bins. Red curve is a Poisson curve with rate = median count rate of data. |
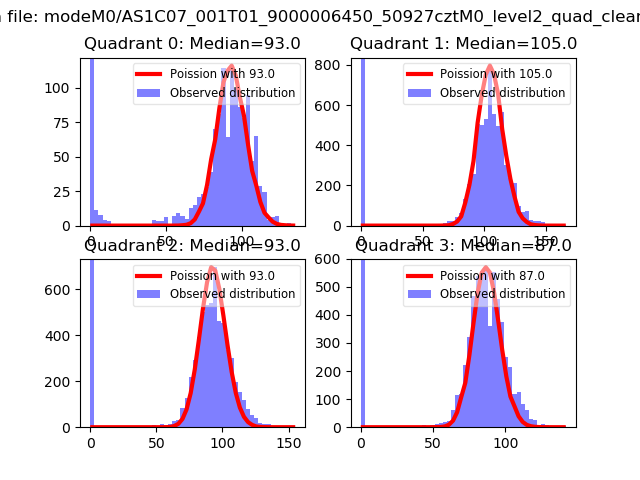 |
 |
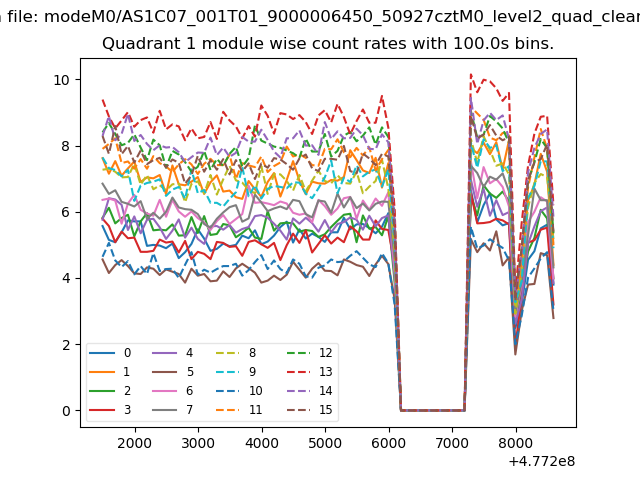
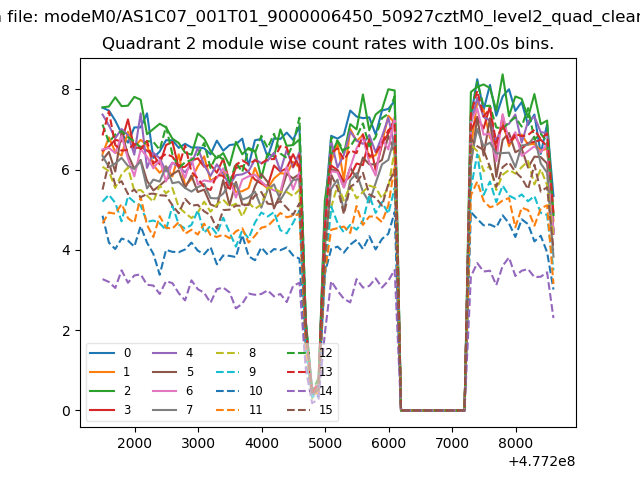
| Quadrant-wise count rates Data is divided into 100 sec bins |
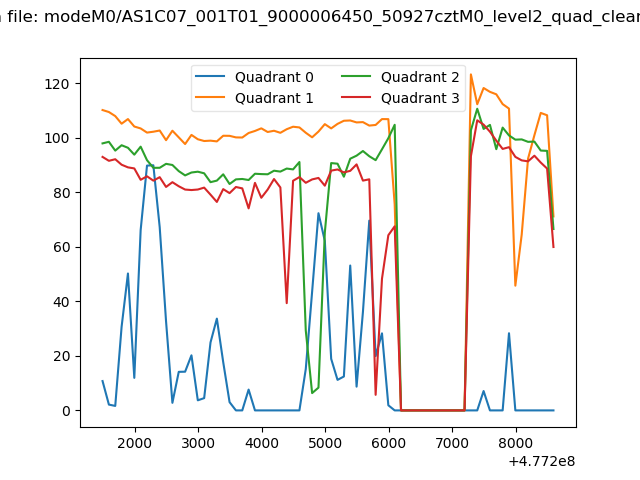 |
|
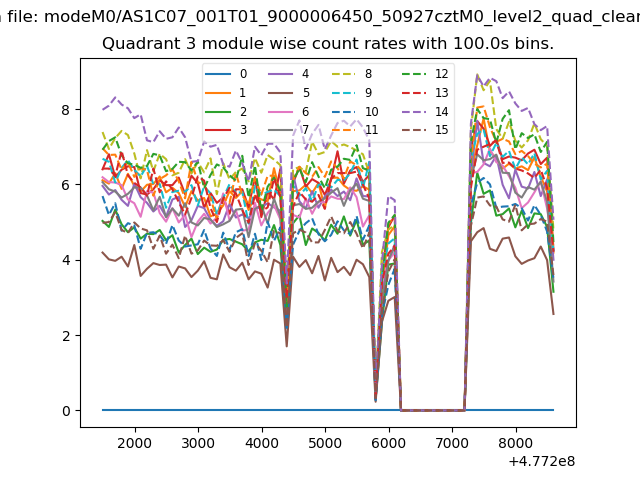
| Module-wise count rates for Quadrant A Data is divided into 100 sec bins |
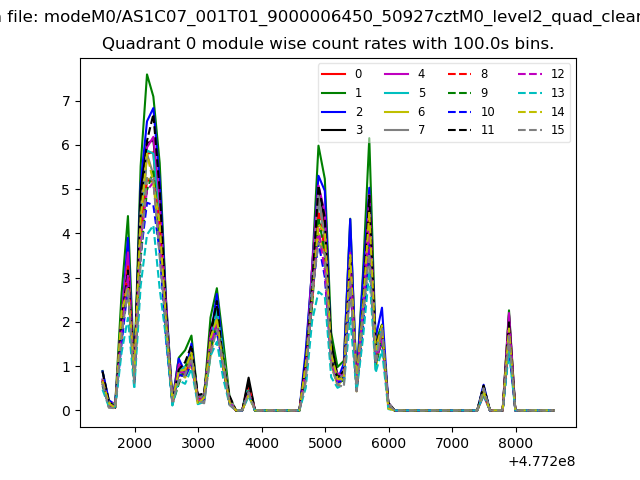 |
 |
| Module-wise count rates for Quadrant B Data is divided into 100 sec bins |
 |
 |
| Module-wise count rates for Quadrant C Data is divided into 100 sec bins |
 |
 |
| Module-wise count rates for Quadrant D Data is divided into 100 sec bins |
 |
 |
| Parameter | Plot |
|---|---|
| CZT HV Monitor | 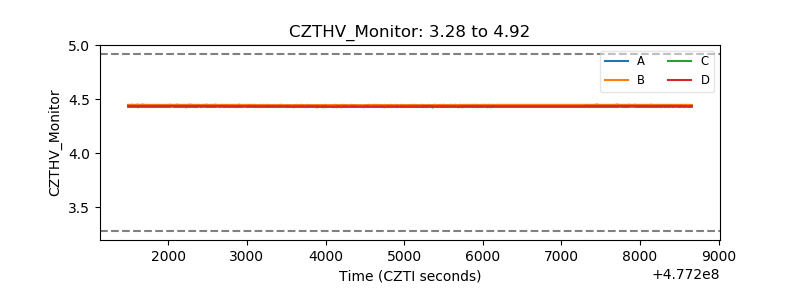 |
| D_VDD | 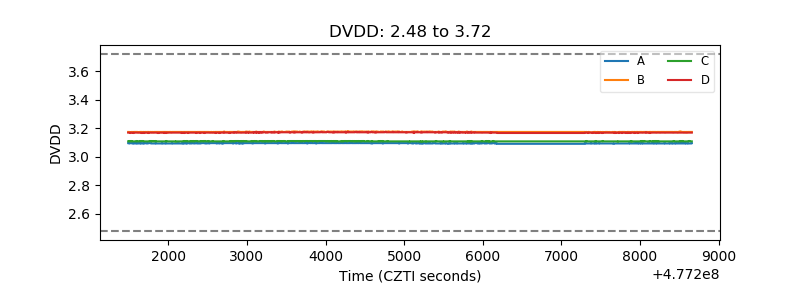 |
| Temperature 1 | 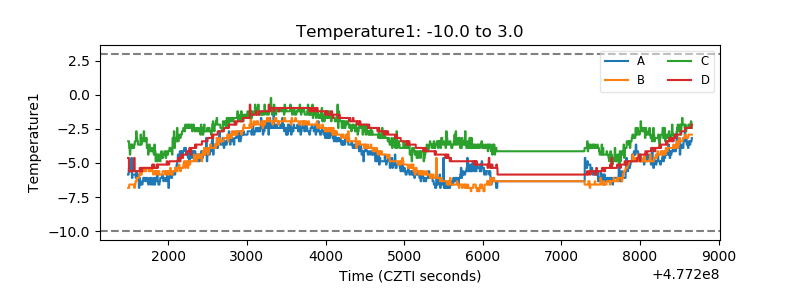 |
| Veto HV Monitor | 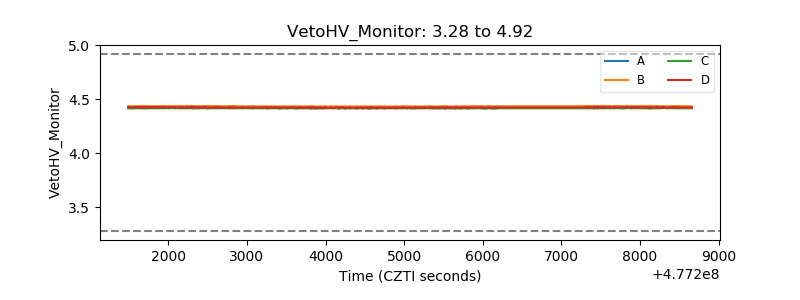 |
| Veto LLD | 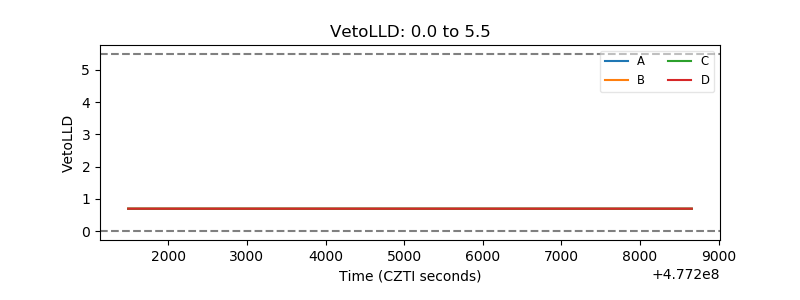 |
| Alpha Counter | 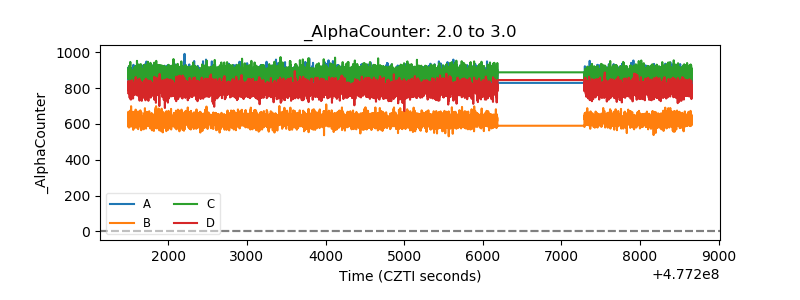 |
| _CPM_Rate | 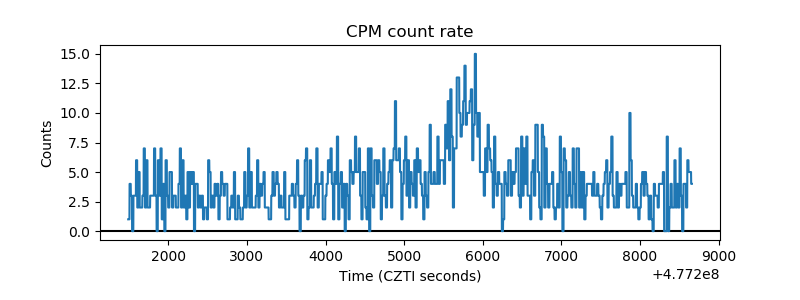 |
| CZT Counter | 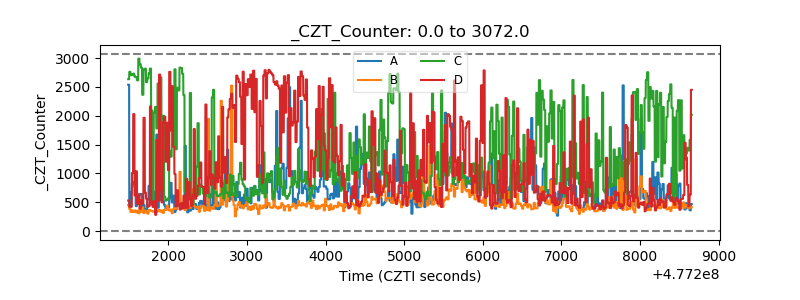 |
| +2.5 Volts monitor | 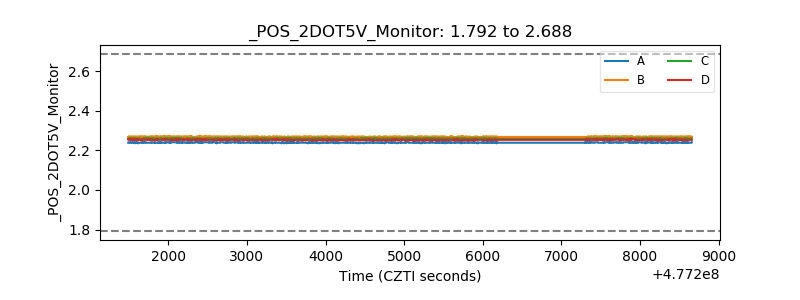 |
| +5 Volts monitor | 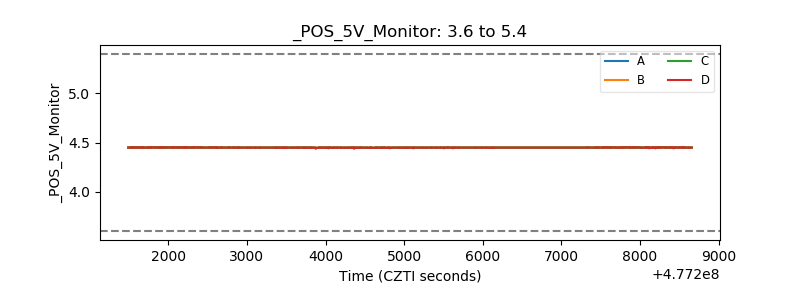 |
| _ROLL_ROT | 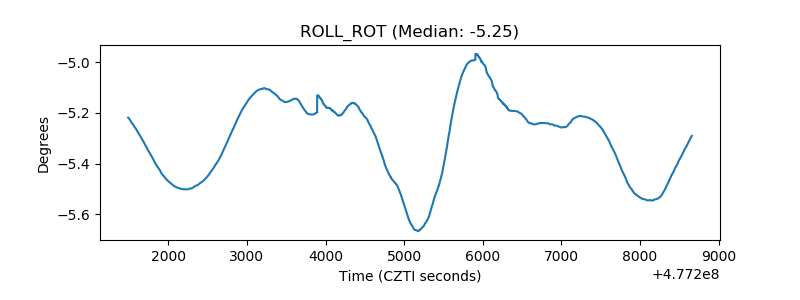 |
| _Roll_DEC | 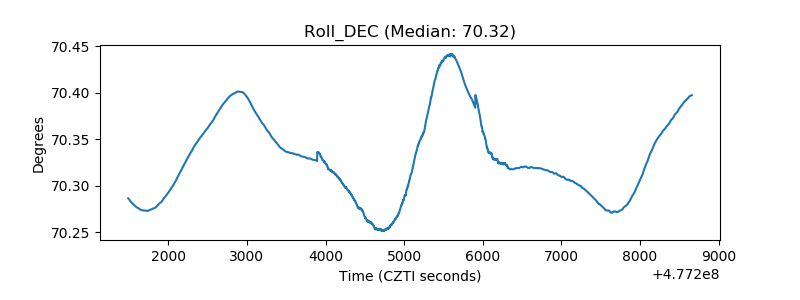 |
| _Roll_RA | 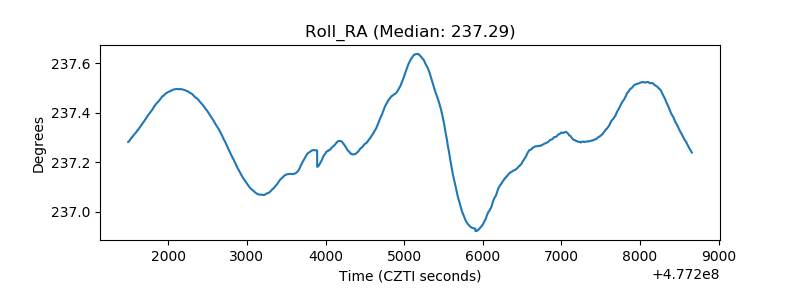 |
| Veto Counter | 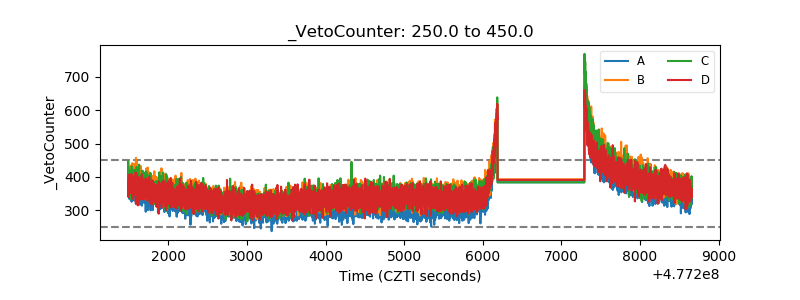 |