| Param | Original file | Final file |
|---|---|---|
| Filename | modeM0/AS1C07_001T01_9000006450_50929cztM0_level2.fits | modeM0/AS1C07_001T01_9000006450_50929cztM0_level2_quad_clean.evt |
| Size (bytes) | 645,992,640 | 95,224,320 |
| Size | 616.1 MB | 90.8 MB |
| Events in quadrant A | 9,716,293 | 502,264 |
| Events in quadrant B | 3,843,163 | 720,555 |
| Events in quadrant C | 5,140,592 | 598,675 |
| Events in quadrant D | 4,691,357 | 592,742 |
| Mode SS | |||
|---|---|---|---|
| Quadrant | BADHDUFLAG | Total packets | Discarded packets |
| A | 0 | 138 | 0 |
| B | 0 | 138 | 0 |
| C | 0 | 138 | 0 |
| D | 0 | 138 | 0 |
| Mode M0 | |||
|---|---|---|---|
| Quadrant | BADHDUFLAG | Total packets | Discarded packets |
| A | 0 | 33592 | 0 |
| B | 0 | 16048 | 0 |
| C | 0 | 19564 | 0 |
| D | 0 | 18526 | 0 |
| Mode M9 | |||
|---|---|---|---|
| Quadrant | BADHDUFLAG | Total packets | Discarded packets |
| A | 0 | 11 | 0 |
| B | 0 | 11 | 0 |
| C | 0 | 11 | 0 |
| D | 0 | 11 | 0 |
| Quadrant | Total seconds | Saturated seconds | Saturation percentage |
|---|---|---|---|
| A | 6724 | 2092 | 31.112433% |
| B | 6725 | 221 | 3.286245% |
| C | 6725 | 587 | 8.728625% |
| D | 6724 | 266 | 3.955979% |
Noise dominated data is calculated using 1-second bins in cleaned event files. If a bin has >2000 counts, and if more than 50% of those come from <1% of pixels, then it is considered to be noise-dominated and hence unusable.
| Quadrant | # 1 sec bins | Bins with >0 counts | Bins with >2000 counts | High rate bins dominated by noise | Noise dominated (total time) | Noise dominated (detector-on time) | Marked lightcurve |
|---|---|---|---|---|---|---|---|
| A | 7854 | 6724 | 1925 | 1925 | 24.51% | 28.63% | 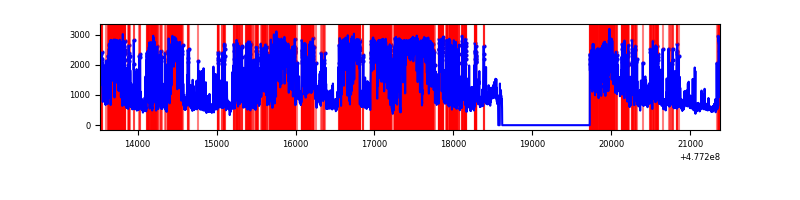 |
| B | 7855 | 6725 | 28 | 28 | 0.36% | 0.42% | 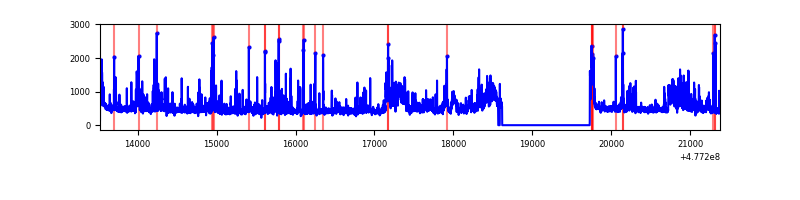 |
| C | 7855 | 6726 | 324 | 324 | 4.12% | 4.82% | 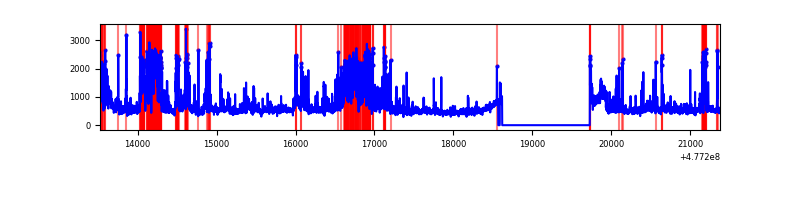 |
| D | 7854 | 6724 | 185 | 185 | 2.36% | 2.75% | 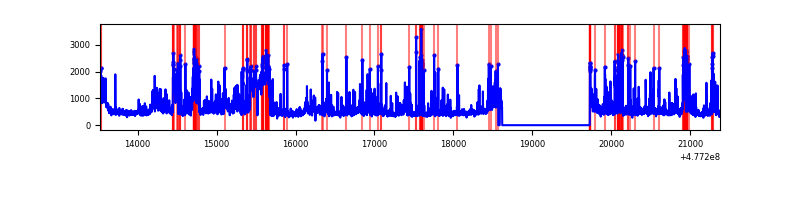 |
Top three noisy pixels from each quadrant. If the there are fewer than three noisy pixels in the level2.evt file, extra rows are filled as -1
| Pixel properties | Quadrant properties | ||||||
|---|---|---|---|---|---|---|---|
| Quadrant | DetID | PixID | Counts | Sigma | Mean | Median | Sigma |
| A | 14 | 254 | 5153642 | 31800.19 | 645 | 629 | 162.0 |
| A | 12 | 3 | 403858 | 2488.4 | 645 | 629 | 162.0 |
| A | 4 | 4 | 377265 | 2324.29 | 645 | 629 | 162.0 |
| B | 10 | 254 | 571959 | 3683.18 | 727 | 702 | 155.1 |
| B | 10 | 247 | 111226 | 712.6 | 727 | 702 | 155.1 |
| B | 8 | 128 | 75650 | 483.23 | 727 | 702 | 155.1 |
| C | 12 | 252 | 983852 | 5114.3 | 689 | 679 | 192.2 |
| C | 12 | 247 | 486364 | 2526.45 | 689 | 679 | 192.2 |
| C | 10 | 171 | 290896 | 1509.66 | 689 | 679 | 192.2 |
| D | 6 | 42 | 471400 | 2375.06 | 707 | 678 | 198.2 |
| D | 2 | 62 | 388113 | 1954.83 | 707 | 678 | 198.2 |
| D | 2 | 249 | 271004 | 1363.94 | 707 | 678 | 198.2 |
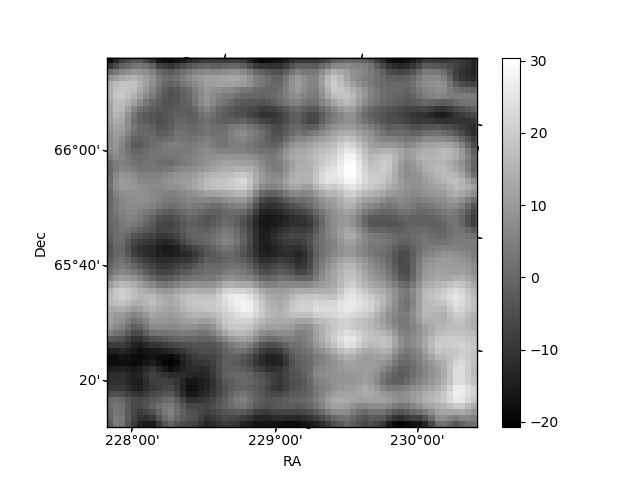
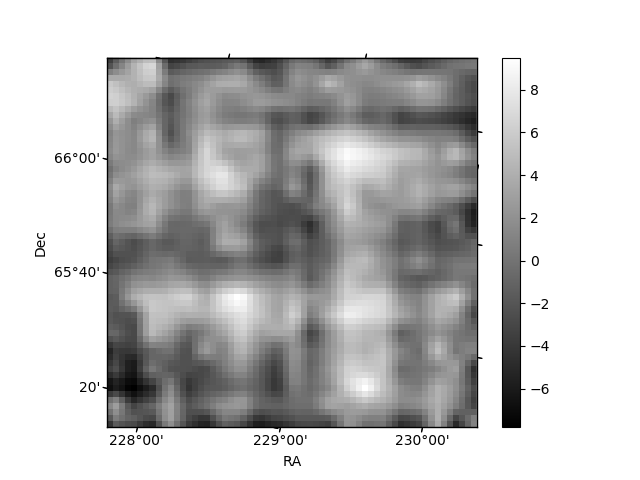
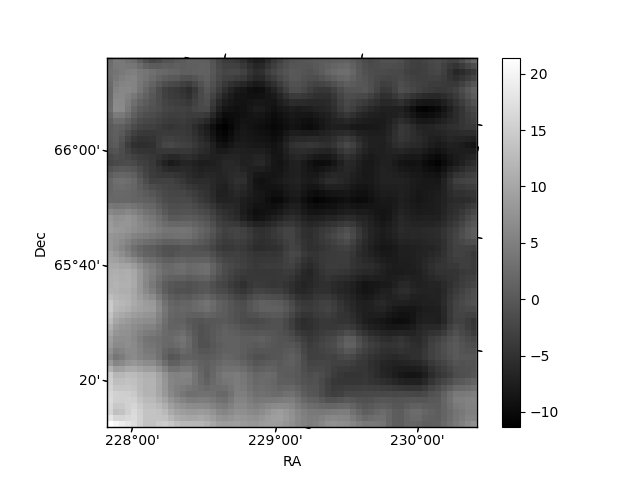
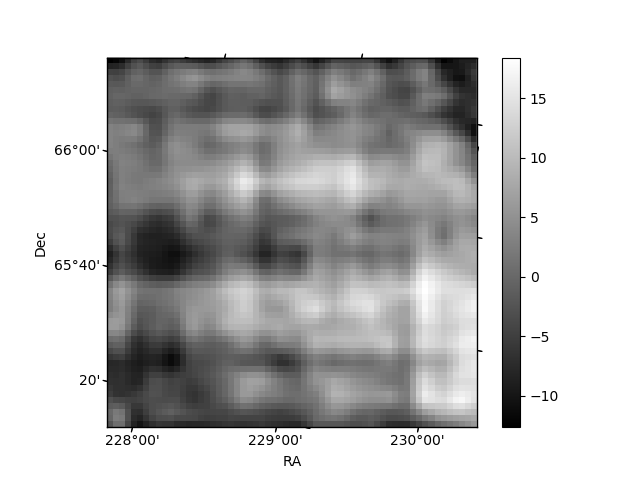
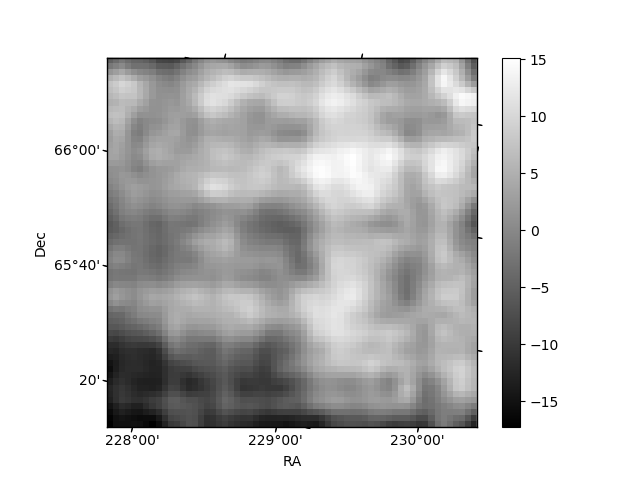
Histogram calculated using DETX and DETY for each event in the final _common_clean file
| Quadrant A | 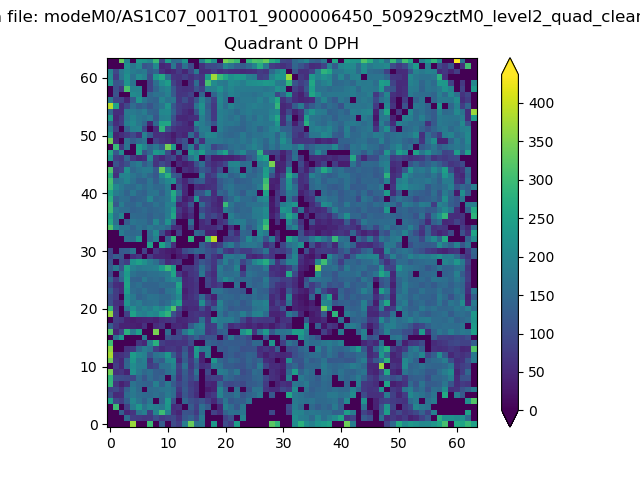 |
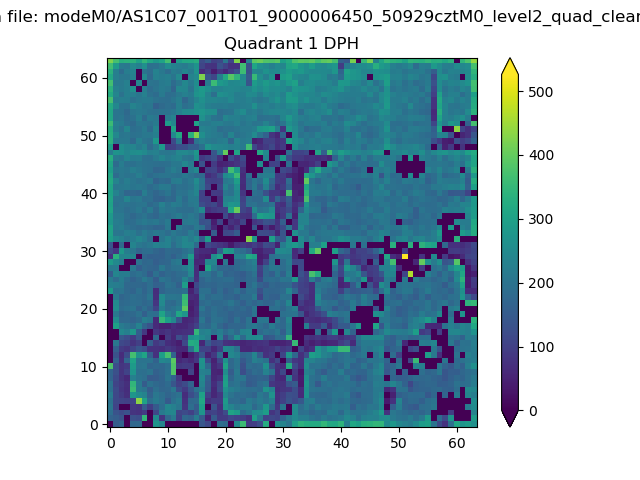 |
Quadrant B |
|---|---|---|---|
| Quadrant D | 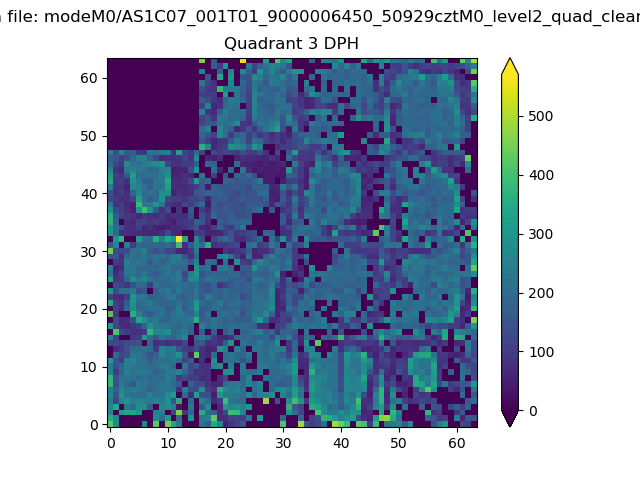 |
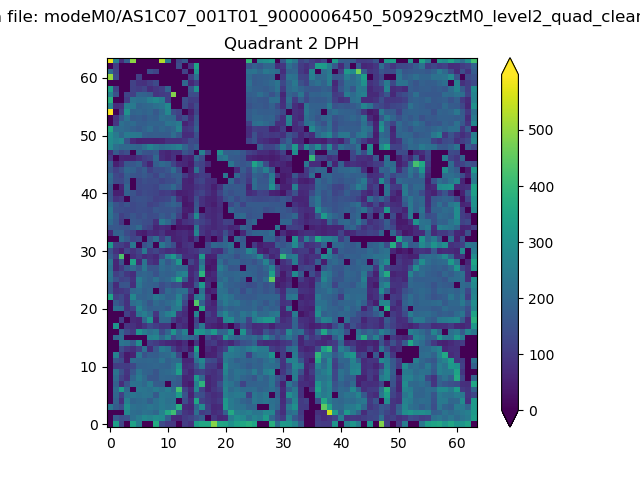 |
Quadrant C |
| Plot type | Count rate plots | Images |
|---|---|---|
| Comparison with Poisson distribution Blue bars denote a histogram of data divided into 1 sec bins. Red curve is a Poisson curve with rate = median count rate of data. |
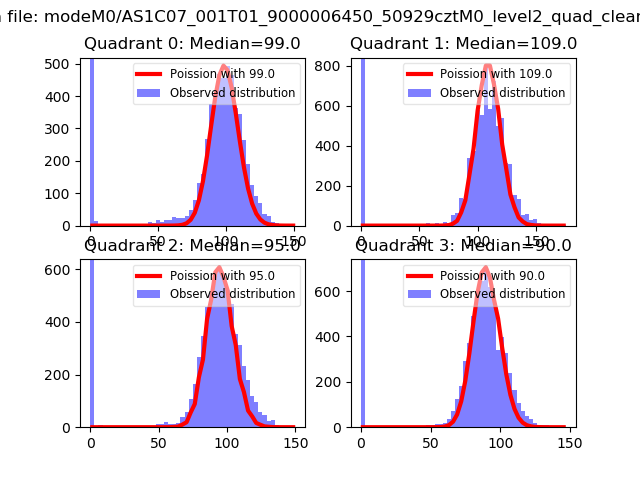 |
 |
| Quadrant-wise count rates Data is divided into 100 sec bins |
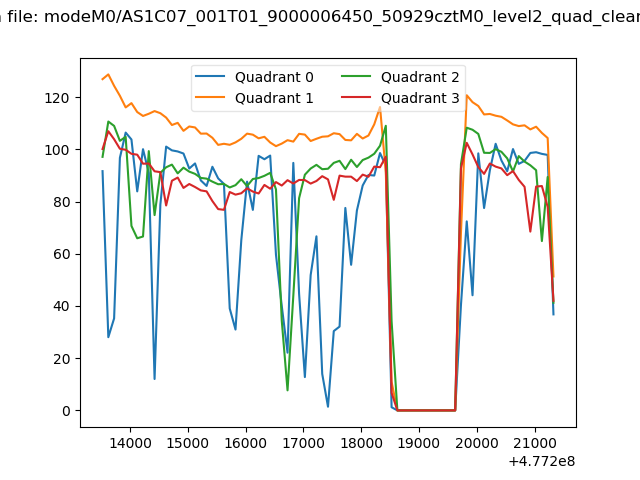 |
|
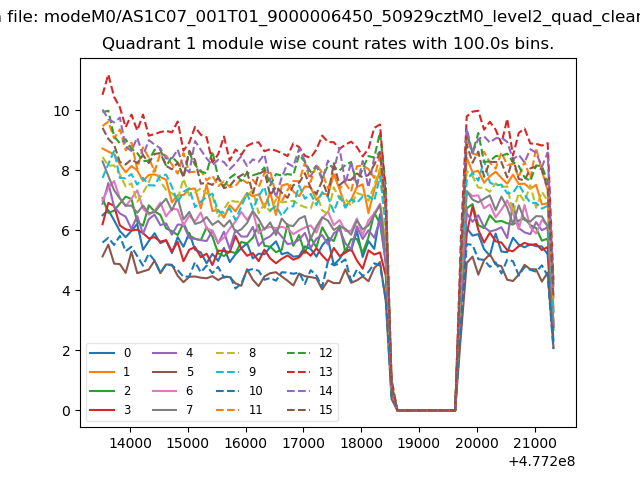
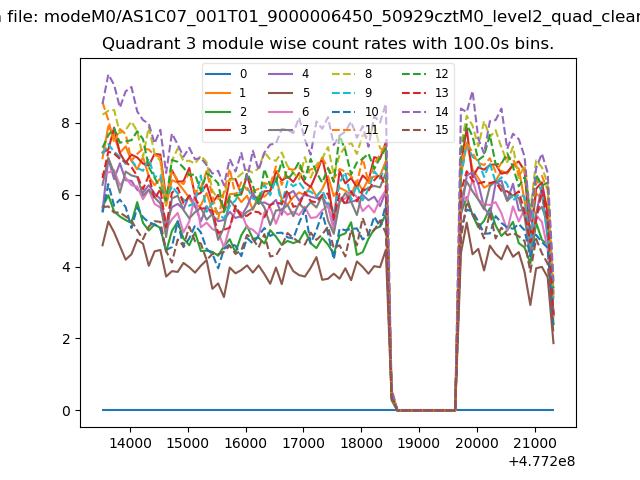
| Module-wise count rates for Quadrant A Data is divided into 100 sec bins |
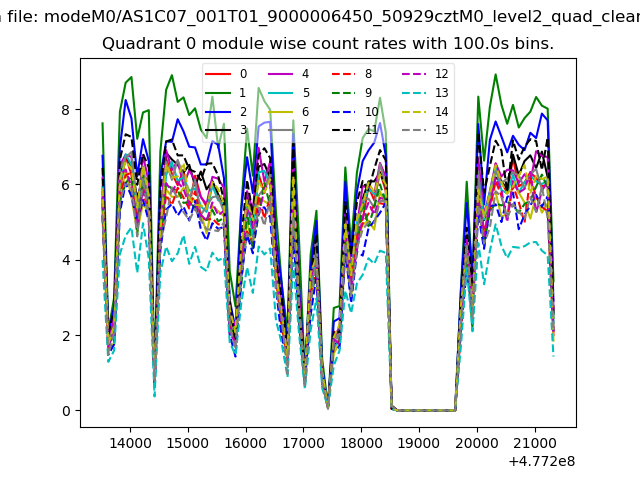 |
 |
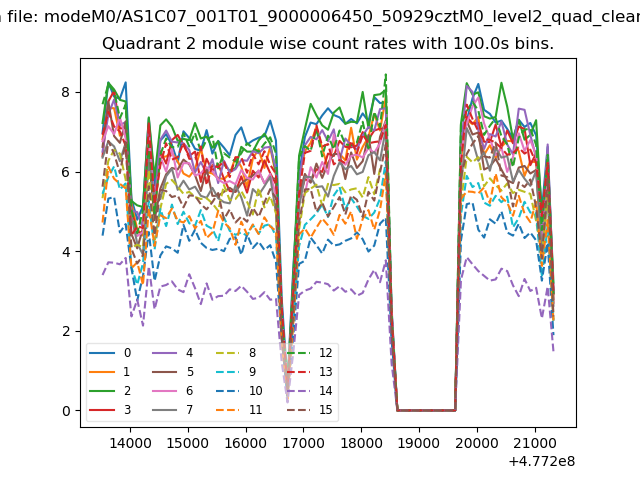
| Module-wise count rates for Quadrant B Data is divided into 100 sec bins |
 |
 |
| Module-wise count rates for Quadrant C Data is divided into 100 sec bins |
 |
 |
| Module-wise count rates for Quadrant D Data is divided into 100 sec bins |
 |
 |
| Parameter | Plot |
|---|---|
| CZT HV Monitor | 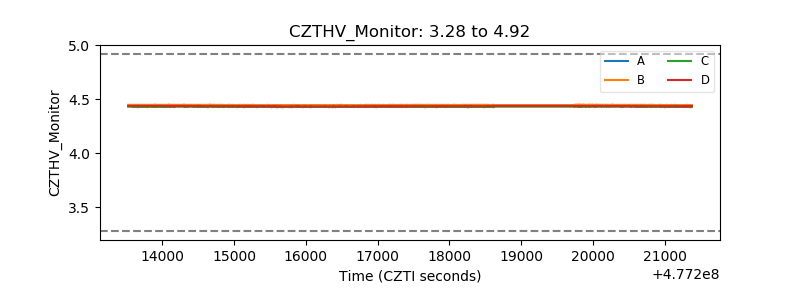 |
| D_VDD | 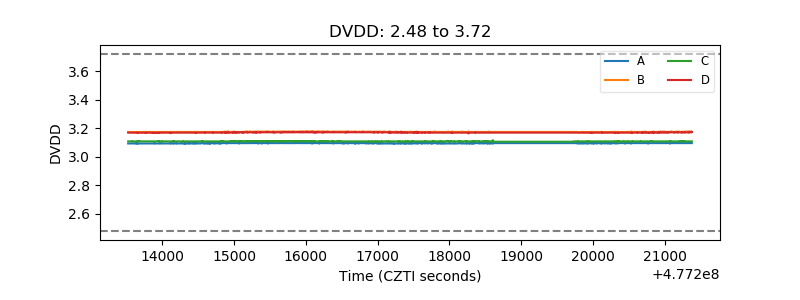 |
| Temperature 1 | 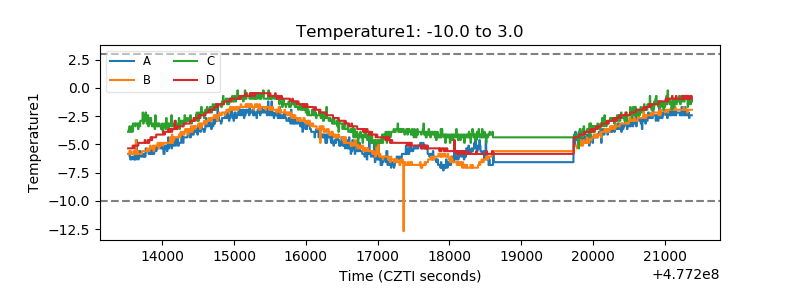 |
| Veto HV Monitor | 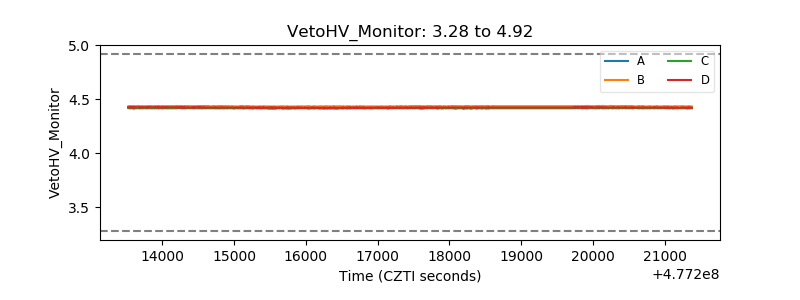 |
| Veto LLD | 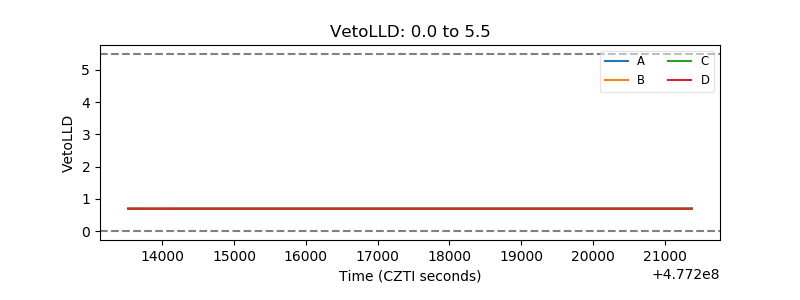 |
| Alpha Counter | 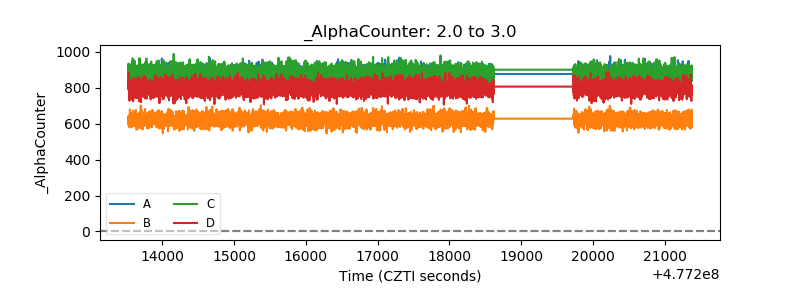 |
| _CPM_Rate | 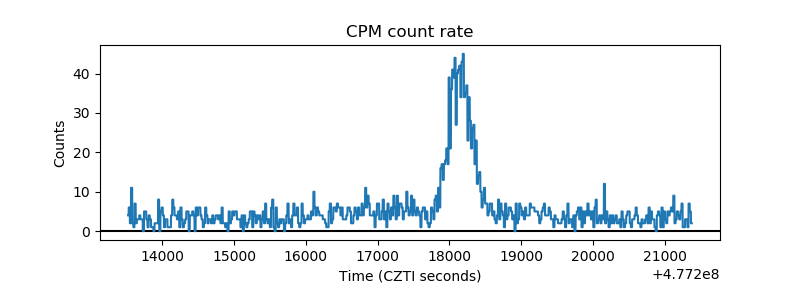 |
| CZT Counter | 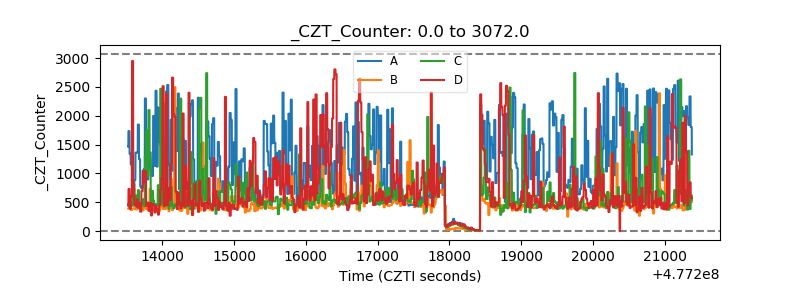 |
| +2.5 Volts monitor | 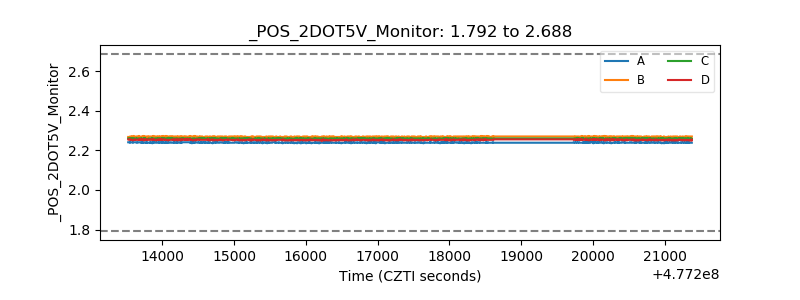 |
| +5 Volts monitor | 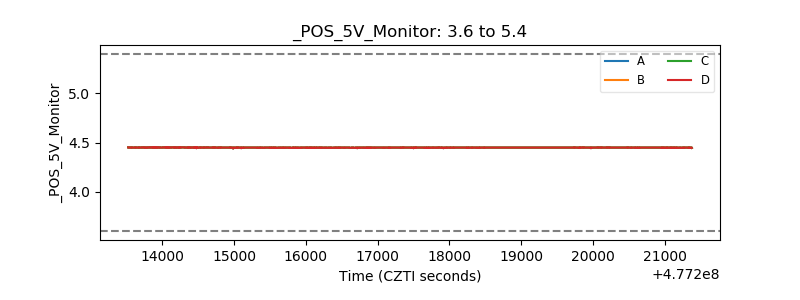 |
| _ROLL_ROT | 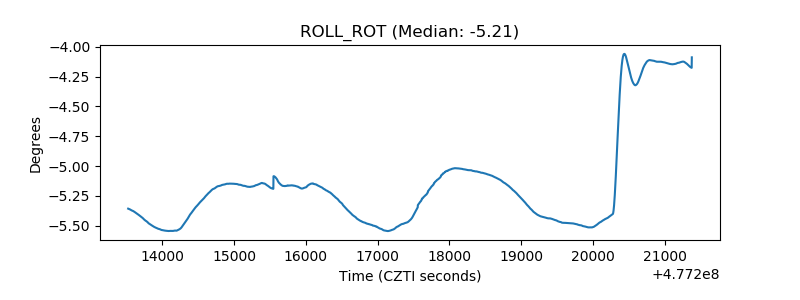 |
| _Roll_DEC | 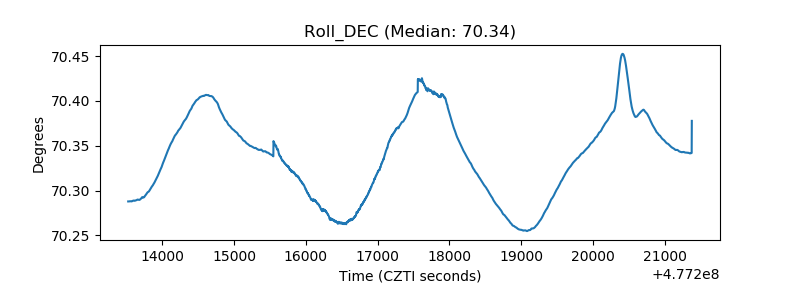 |
| _Roll_RA | 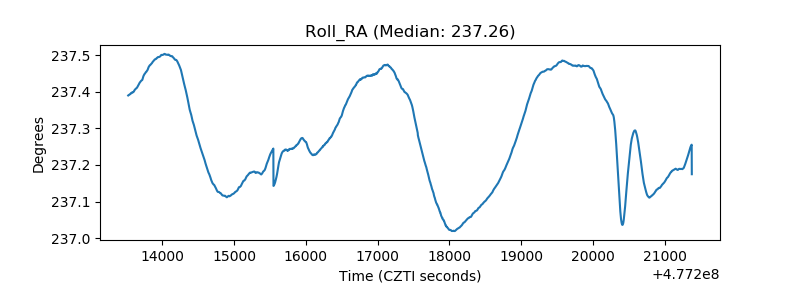 |
| Veto Counter | 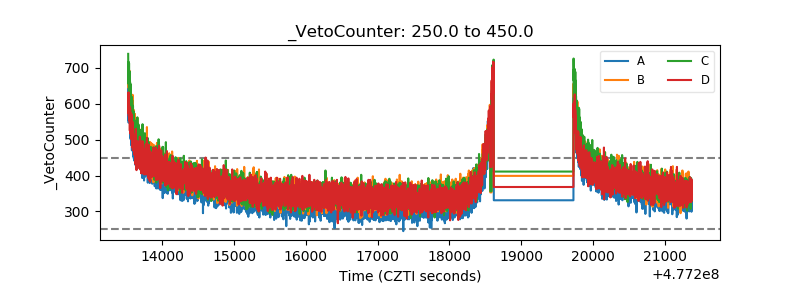 |