| Param | Original file | Final file |
|---|---|---|
| Filename | modeM0/AS1C07_001T01_9000006450_50930cztM0_level2.fits | modeM0/AS1C07_001T01_9000006450_50930cztM0_level2_quad_clean.evt |
| Size (bytes) | 487,702,080 | 90,953,280 |
| Size | 465.1 MB | 86.7 MB |
| Events in quadrant A | 6,339,086 | 571,492 |
| Events in quadrant B | 3,335,993 | 650,209 |
| Events in quadrant C | 3,788,140 | 568,394 |
| Events in quadrant D | 4,104,834 | 527,367 |
| Mode SS | |||
|---|---|---|---|
| Quadrant | BADHDUFLAG | Total packets | Discarded packets |
| A | 0 | 128 | 0 |
| B | 0 | 128 | 0 |
| C | 0 | 128 | 0 |
| D | 0 | 128 | 0 |
| Mode M0 | |||
|---|---|---|---|
| Quadrant | BADHDUFLAG | Total packets | Discarded packets |
| A | 0 | 23273 | 1 |
| B | 0 | 14383 | 1 |
| C | 0 | 15094 | 1 |
| D | 0 | 16588 | 1 |
| Mode M9 | |||
|---|---|---|---|
| Quadrant | BADHDUFLAG | Total packets | Discarded packets |
| A | 0 | 10 | 0 |
| B | 0 | 10 | 0 |
| C | 0 | 10 | 0 |
| D | 0 | 10 | 0 |
| Quadrant | Total seconds | Saturated seconds | Saturation percentage |
|---|---|---|---|
| A | 6251 | 587 | 9.390498% |
| B | 6252 | 160 | 2.559181% |
| C | 6252 | 183 | 2.927063% |
| D | 6252 | 298 | 4.766475% |
Noise dominated data is calculated using 1-second bins in cleaned event files. If a bin has >2000 counts, and if more than 50% of those come from <1% of pixels, then it is considered to be noise-dominated and hence unusable.
| Quadrant | # 1 sec bins | Bins with >0 counts | Bins with >2000 counts | High rate bins dominated by noise | Noise dominated (total time) | Noise dominated (detector-on time) | Marked lightcurve |
|---|---|---|---|---|---|---|---|
| A | 7301 | 6251 | 460 | 460 | 6.30% | 7.36% | 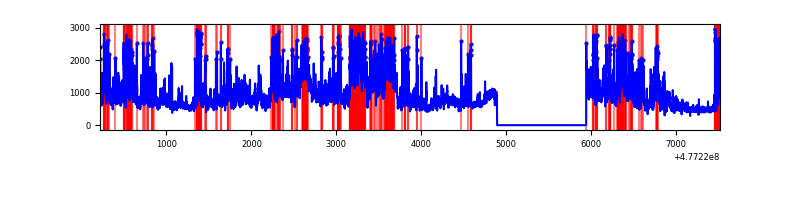 |
| B | 7302 | 6252 | 21 | 21 | 0.29% | 0.34% | 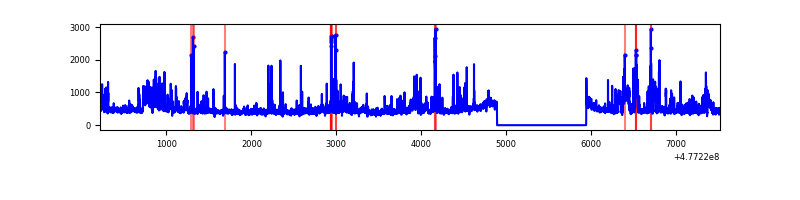 |
| C | 7302 | 6252 | 65 | 65 | 0.89% | 1.04% | 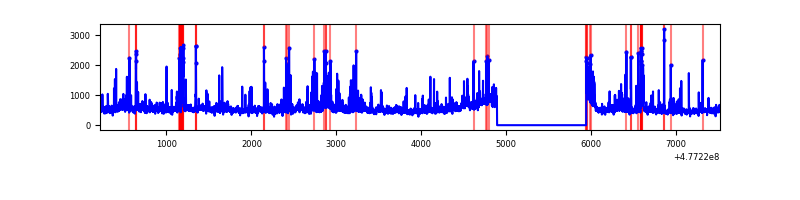 |
| D | 7302 | 6252 | 220 | 220 | 3.01% | 3.52% | 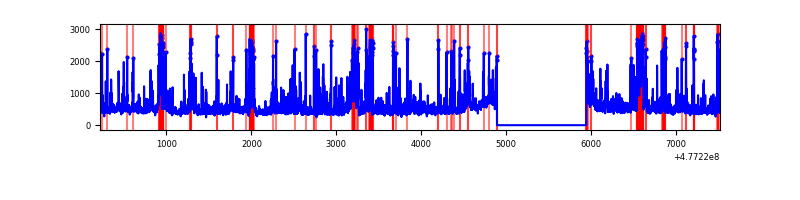 |
Top three noisy pixels from each quadrant. If the there are fewer than three noisy pixels in the level2.evt file, extra rows are filled as -1
| Pixel properties | Quadrant properties | ||||||
|---|---|---|---|---|---|---|---|
| Quadrant | DetID | PixID | Counts | Sigma | Mean | Median | Sigma |
| A | 14 | 254 | 1671615 | 10179.35 | 657 | 640 | 164.2 |
| A | 4 | 4 | 731990 | 4455.28 | 657 | 640 | 164.2 |
| A | 15 | 174 | 325341 | 1978.03 | 657 | 640 | 164.2 |
| B | 10 | 254 | 207230 | 1451.16 | 665 | 643 | 142.4 |
| B | 15 | 54 | 139251 | 973.64 | 665 | 643 | 142.4 |
| B | 8 | 128 | 85639 | 597.05 | 665 | 643 | 142.4 |
| C | 12 | 247 | 455128 | 2557.54 | 650 | 645 | 177.7 |
| C | 4 | 5 | 168146 | 942.59 | 650 | 645 | 177.7 |
| C | 13 | 3 | 118021 | 660.52 | 650 | 645 | 177.7 |
| D | 8 | 176 | 436493 | 2422.34 | 644 | 619 | 179.9 |
| D | 2 | 249 | 385258 | 2137.61 | 644 | 619 | 179.9 |
| D | 3 | 12 | 150850 | 834.9 | 644 | 619 | 179.9 |
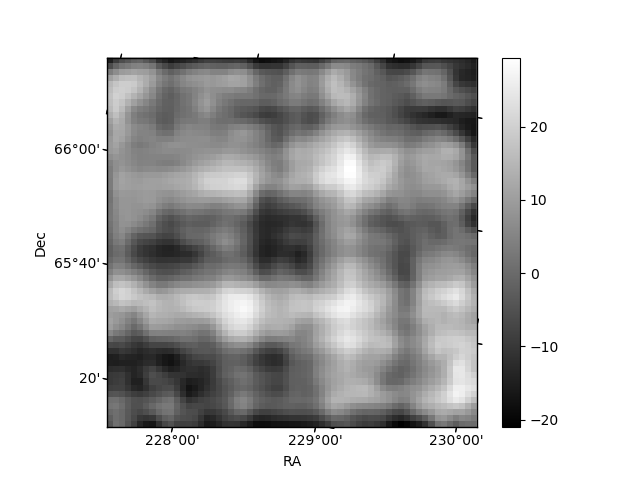
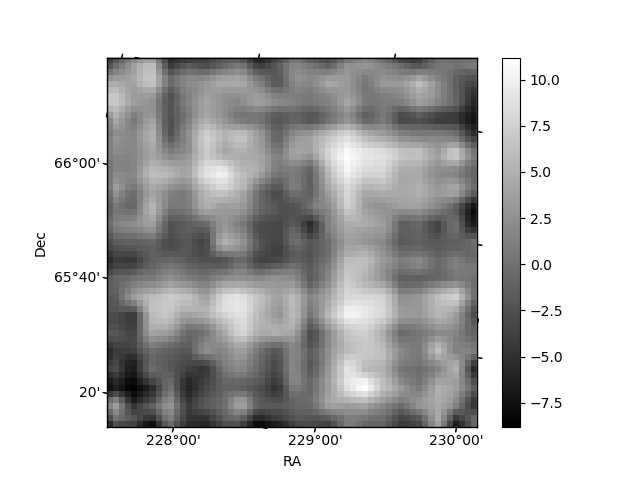
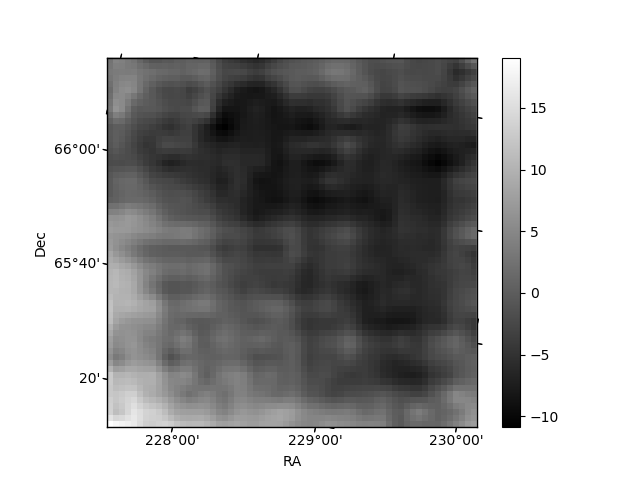
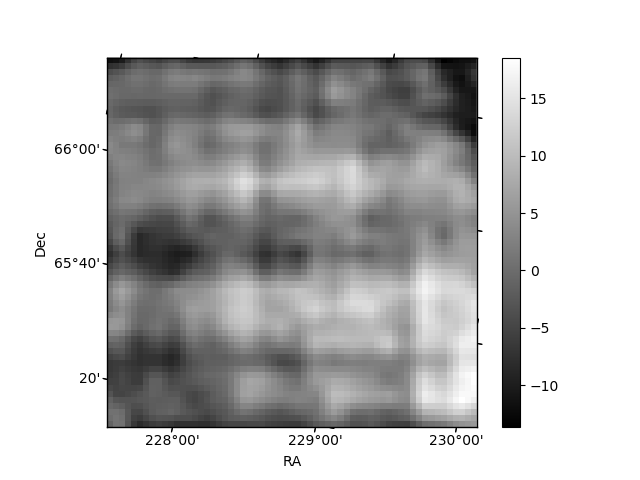
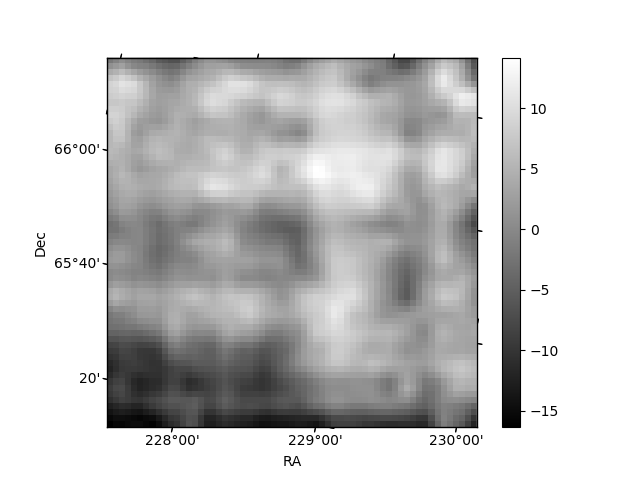
Histogram calculated using DETX and DETY for each event in the final _common_clean file
| Quadrant A | 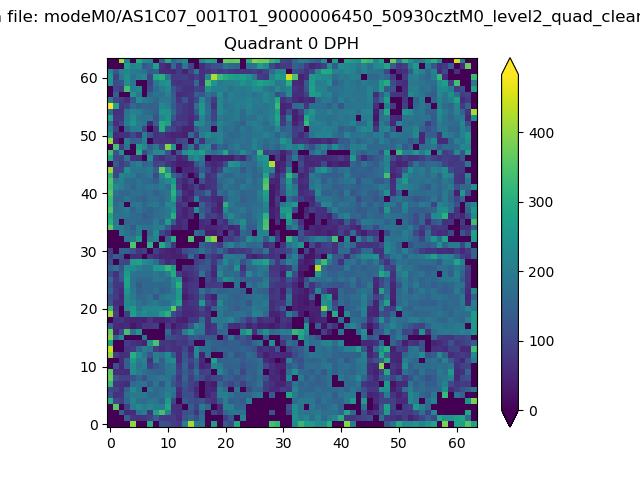 |
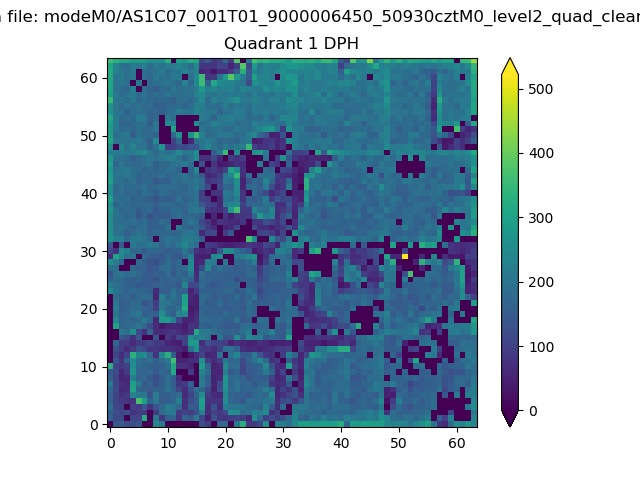 |
Quadrant B |
|---|---|---|---|
| Quadrant D | 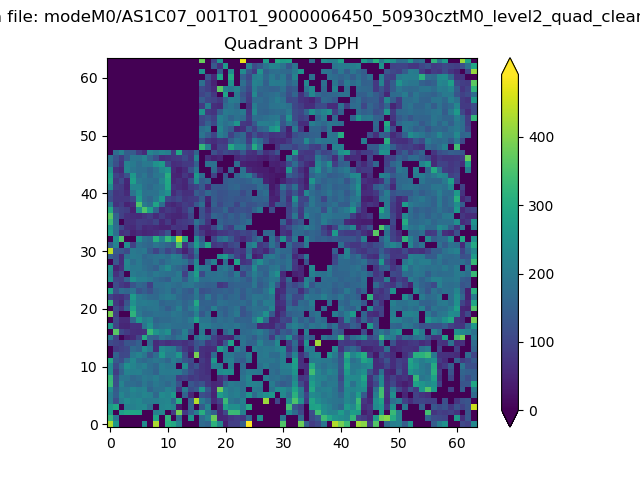 |
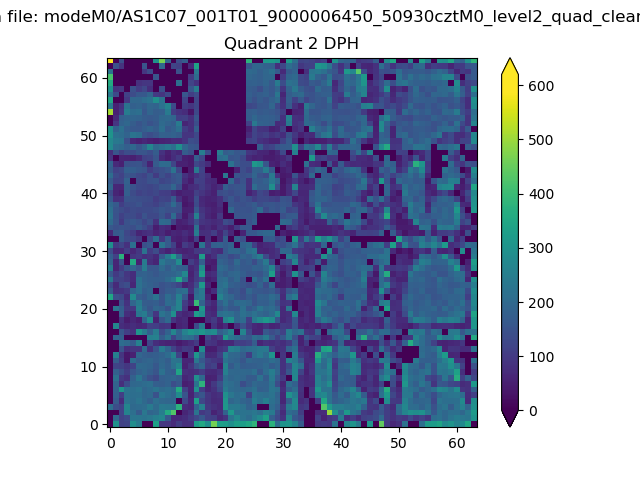 |
Quadrant C |
| Plot type | Count rate plots | Images |
|---|---|---|
| Comparison with Poisson distribution Blue bars denote a histogram of data divided into 1 sec bins. Red curve is a Poisson curve with rate = median count rate of data. |
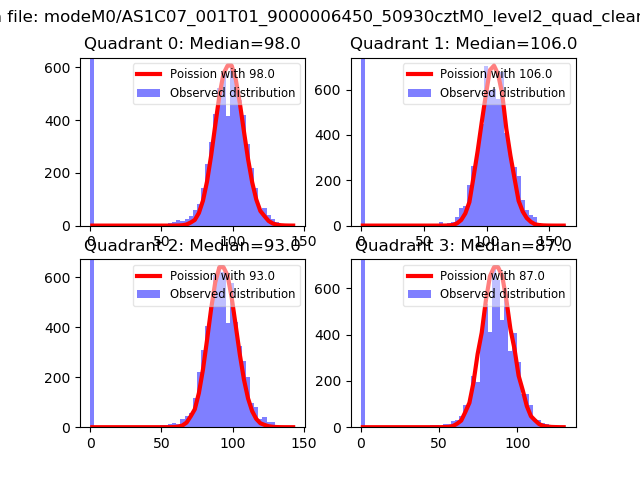 |
 |
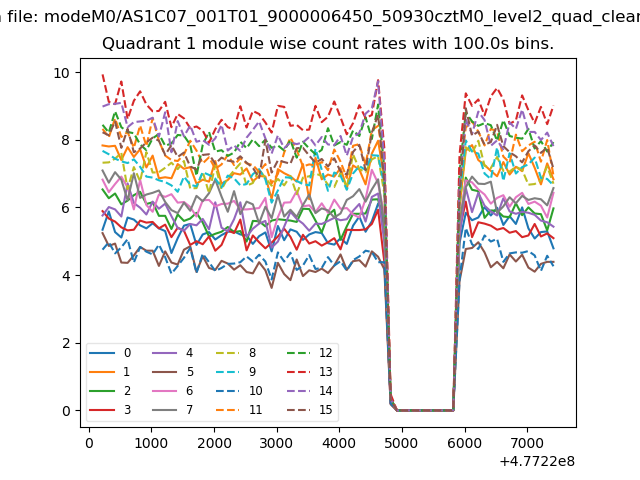
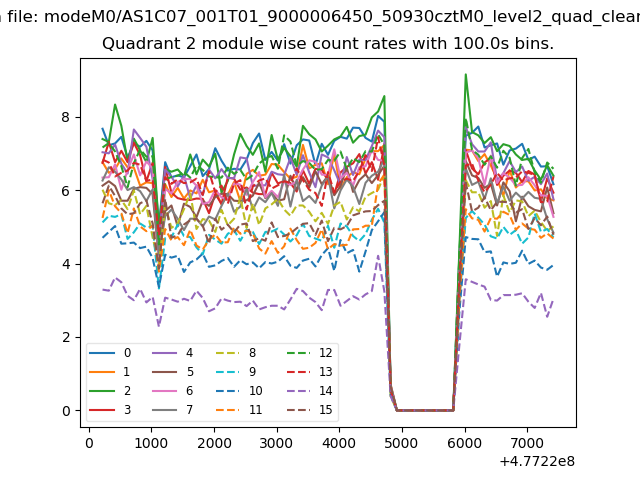
| Quadrant-wise count rates Data is divided into 100 sec bins |
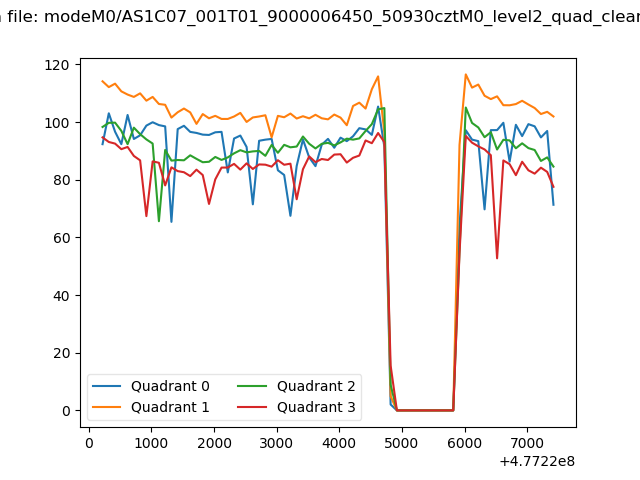 |
|
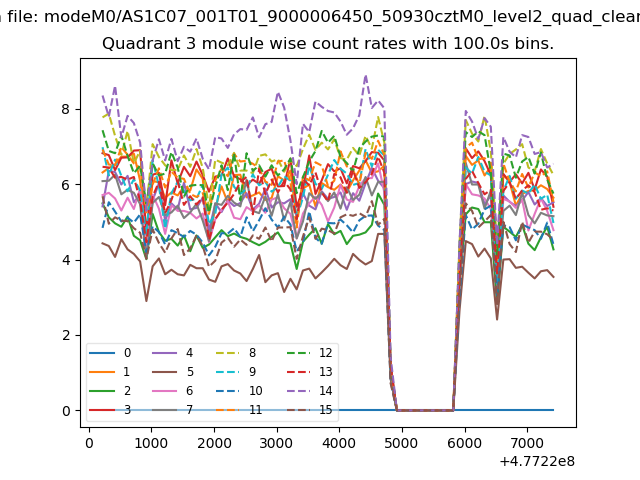
| Module-wise count rates for Quadrant A Data is divided into 100 sec bins |
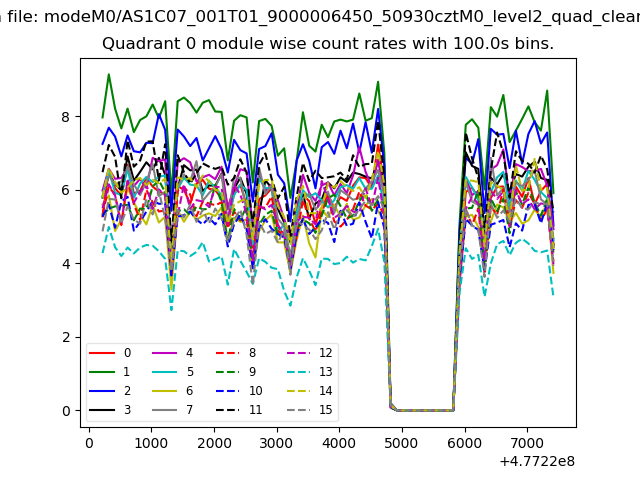 |
 |
| Module-wise count rates for Quadrant B Data is divided into 100 sec bins |
 |
 |
| Module-wise count rates for Quadrant C Data is divided into 100 sec bins |
 |
 |
| Module-wise count rates for Quadrant D Data is divided into 100 sec bins |
 |
 |
| Parameter | Plot |
|---|---|
| CZT HV Monitor | 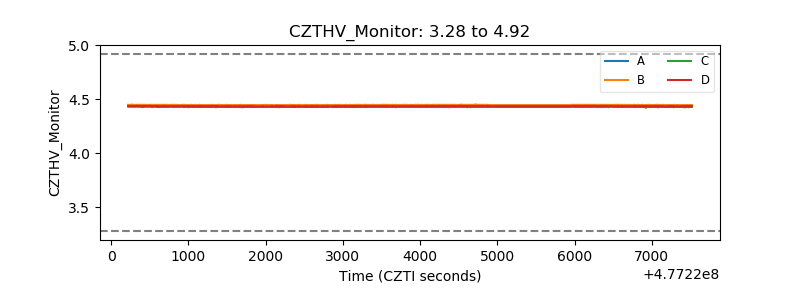 |
| D_VDD | 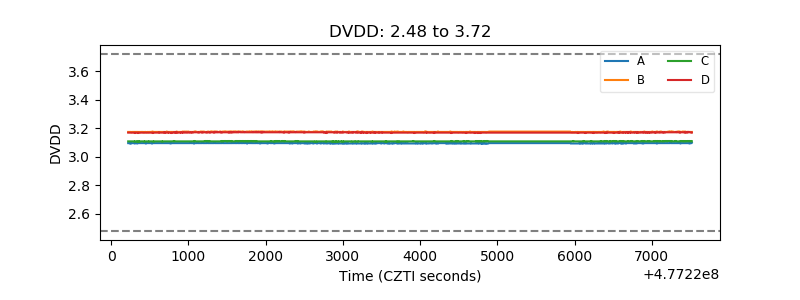 |
| Temperature 1 | 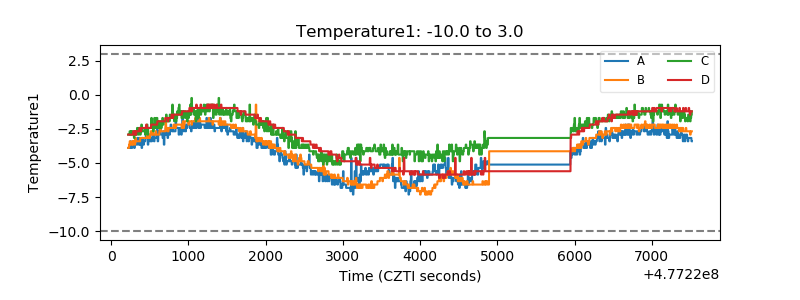 |
| Veto HV Monitor | 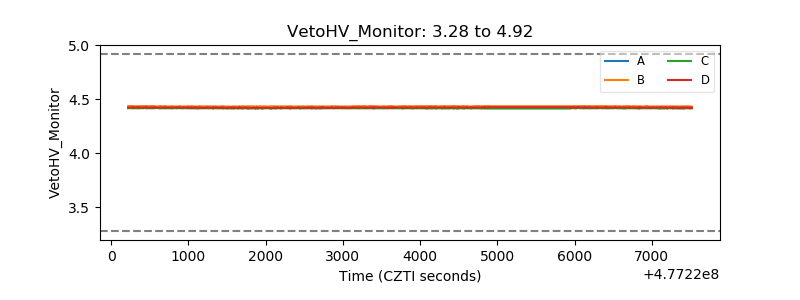 |
| Veto LLD | 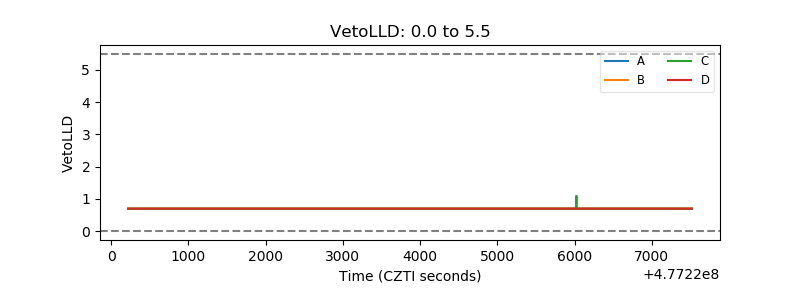 |
| Alpha Counter | 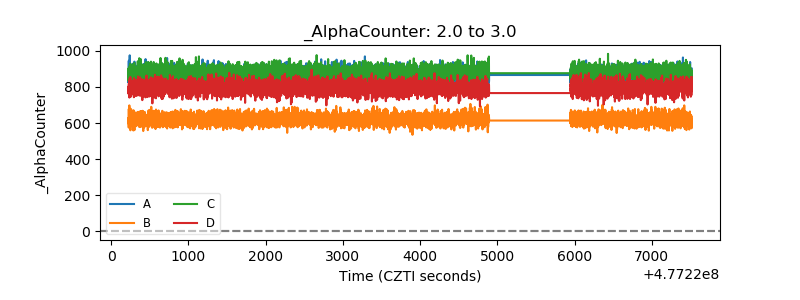 |
| _CPM_Rate | 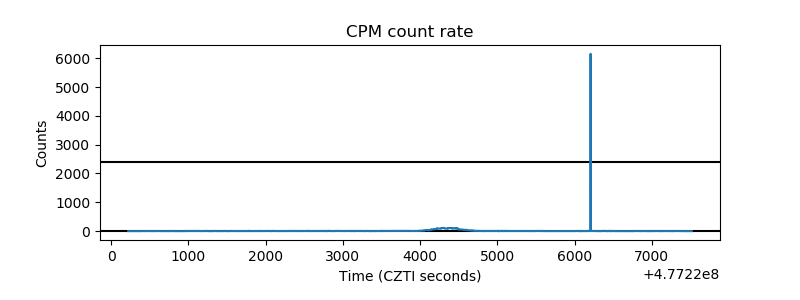 |
| CZT Counter | 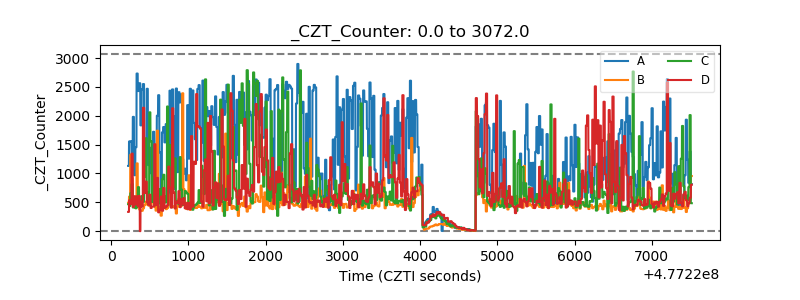 |
| +2.5 Volts monitor | 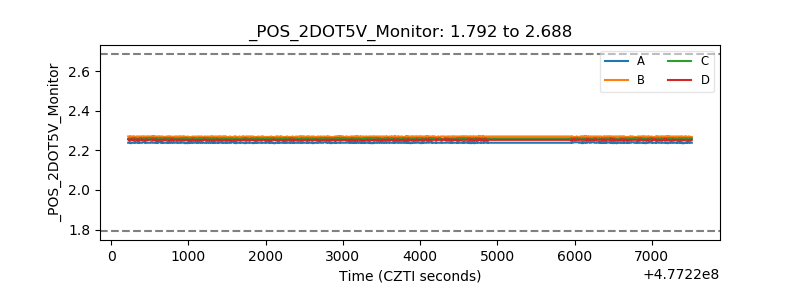 |
| +5 Volts monitor | 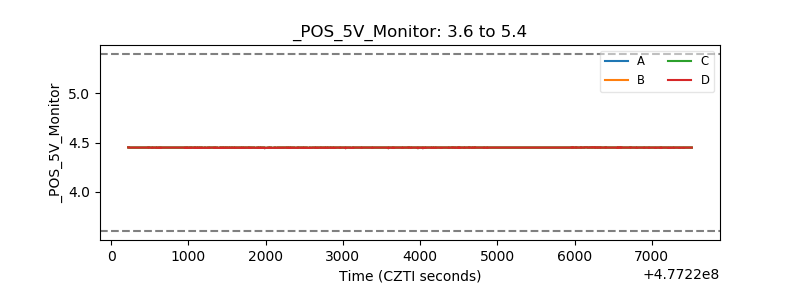 |
| _ROLL_ROT | 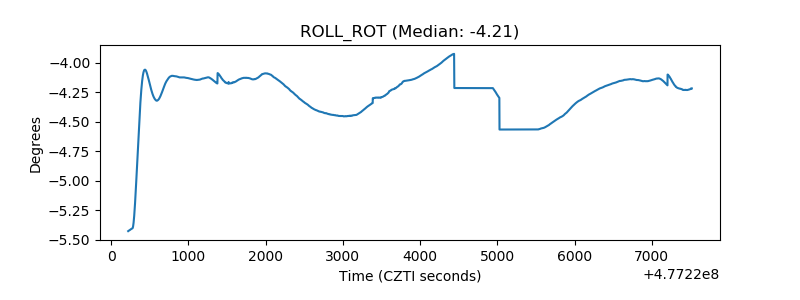 |
| _Roll_DEC | 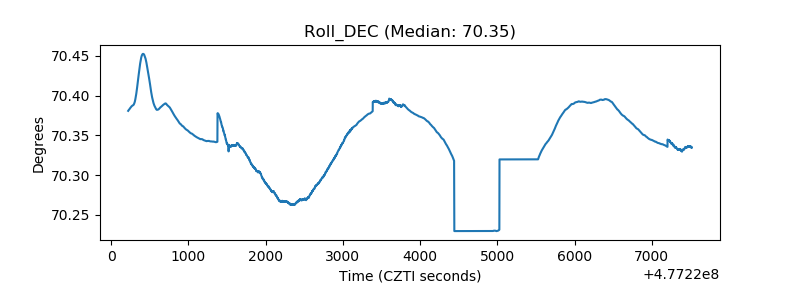 |
| _Roll_RA | 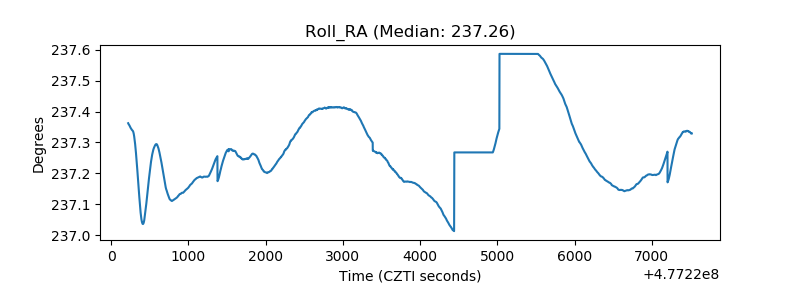 |
| Veto Counter | 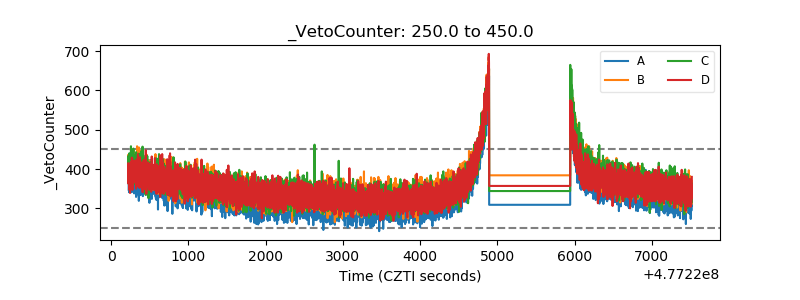 |