| Param | Original file | Final file |
|---|---|---|
| Filename | modeM0/AS1C07_001T01_9000006450_50931cztM0_level2.fits | modeM0/AS1C07_001T01_9000006450_50931cztM0_level2_quad_clean.evt |
| Size (bytes) | 503,579,520 | 92,802,240 |
| Size | 480.3 MB | 88.5 MB |
| Events in quadrant A | 5,209,866 | 599,270 |
| Events in quadrant B | 3,322,086 | 667,098 |
| Events in quadrant C | 4,085,717 | 581,724 |
| Events in quadrant D | 5,513,616 | 504,074 |
| Mode SS | |||
|---|---|---|---|
| Quadrant | BADHDUFLAG | Total packets | Discarded packets |
| A | 0 | 134 | 0 |
| B | 0 | 134 | 0 |
| C | 0 | 134 | 0 |
| D | 0 | 134 | 0 |
| Mode M0 | |||
|---|---|---|---|
| Quadrant | BADHDUFLAG | Total packets | Discarded packets |
| A | 0 | 19911 | 1 |
| B | 0 | 14700 | 1 |
| C | 0 | 16608 | 1 |
| D | 0 | 21045 | 1 |
| Mode M9 | |||
|---|---|---|---|
| Quadrant | BADHDUFLAG | Total packets | Discarded packets |
| A | 0 | 8 | 0 |
| B | 0 | 8 | 0 |
| C | 0 | 8 | 0 |
| D | 0 | 8 | 0 |
| Quadrant | Total seconds | Saturated seconds | Saturation percentage |
|---|---|---|---|
| A | 6561 | 388 | 5.913733% |
| B | 6561 | 147 | 2.240512% |
| C | 6562 | 245 | 3.733618% |
| D | 6562 | 764 | 11.642792% |
Noise dominated data is calculated using 1-second bins in cleaned event files. If a bin has >2000 counts, and if more than 50% of those come from <1% of pixels, then it is considered to be noise-dominated and hence unusable.
| Quadrant | # 1 sec bins | Bins with >0 counts | Bins with >2000 counts | High rate bins dominated by noise | Noise dominated (total time) | Noise dominated (detector-on time) | Marked lightcurve |
|---|---|---|---|---|---|---|---|
| A | 7371 | 6561 | 260 | 260 | 3.53% | 3.96% | 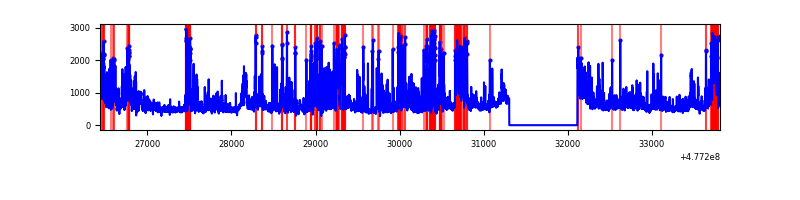 |
| B | 7371 | 6561 | 21 | 21 | 0.28% | 0.32% | 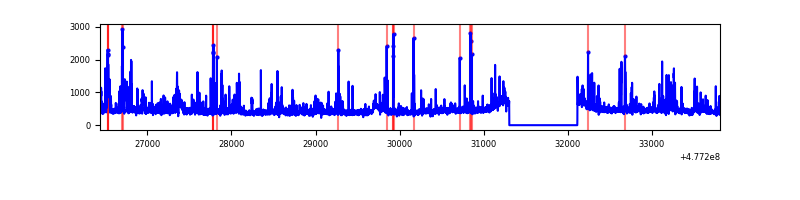 |
| C | 7371 | 6561 | 170 | 170 | 2.31% | 2.59% | 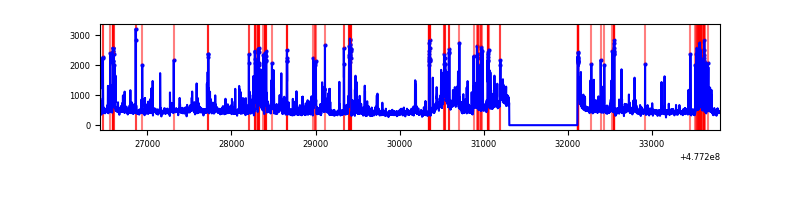 |
| D | 7371 | 6561 | 782 | 782 | 10.61% | 11.92% | 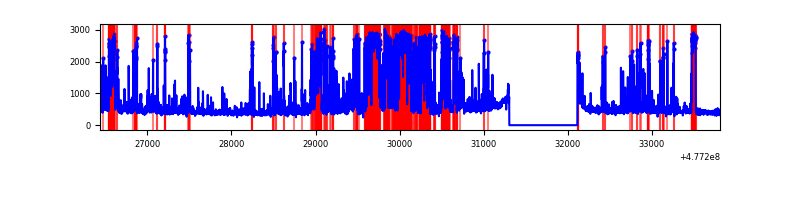 |
Top three noisy pixels from each quadrant. If the there are fewer than three noisy pixels in the level2.evt file, extra rows are filled as -1
| Pixel properties | Quadrant properties | ||||||
|---|---|---|---|---|---|---|---|
| Quadrant | DetID | PixID | Counts | Sigma | Mean | Median | Sigma |
| A | 14 | 254 | 1507431 | 8947.31 | 684 | 667 | 168.4 |
| A | 15 | 174 | 157079 | 928.79 | 684 | 667 | 168.4 |
| A | 4 | 3 | 140346 | 829.42 | 684 | 667 | 168.4 |
| B | 15 | 54 | 119587 | 820.3 | 688 | 664 | 145.0 |
| B | 8 | 128 | 98742 | 676.52 | 688 | 664 | 145.0 |
| B | 7 | 252 | 54458 | 371.06 | 688 | 664 | 145.0 |
| C | 12 | 252 | 491018 | 2666.34 | 671 | 664 | 183.9 |
| C | 12 | 247 | 172823 | 936.13 | 671 | 664 | 183.9 |
| C | 1 | 60 | 145087 | 785.31 | 671 | 664 | 183.9 |
| D | 8 | 176 | 2098617 | 11762.6 | 646 | 623 | 178.4 |
| D | 2 | 249 | 246463 | 1378.32 | 646 | 623 | 178.4 |
| D | 3 | 12 | 142912 | 797.76 | 646 | 623 | 178.4 |
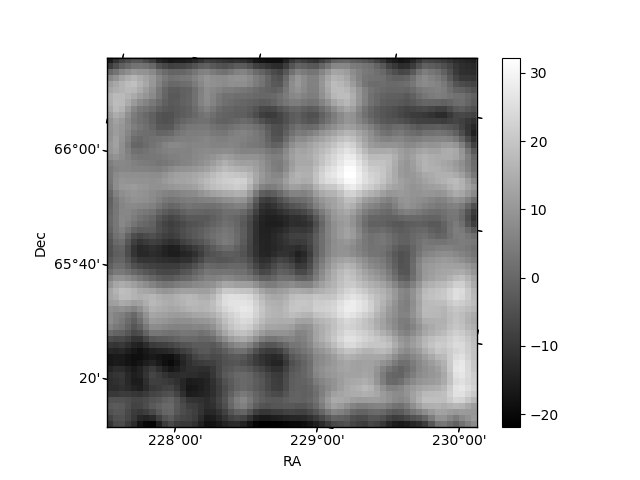
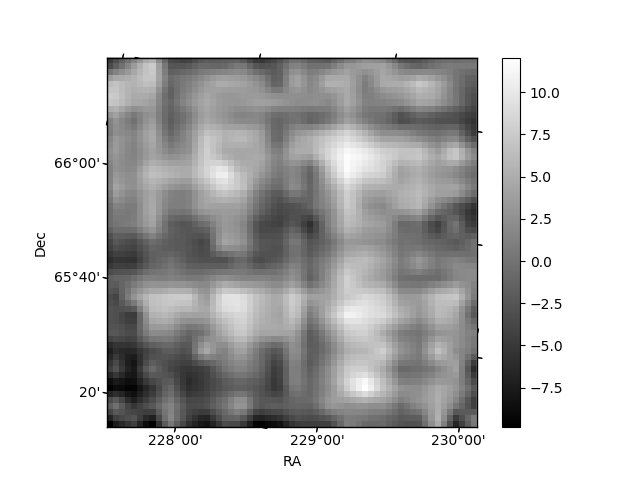
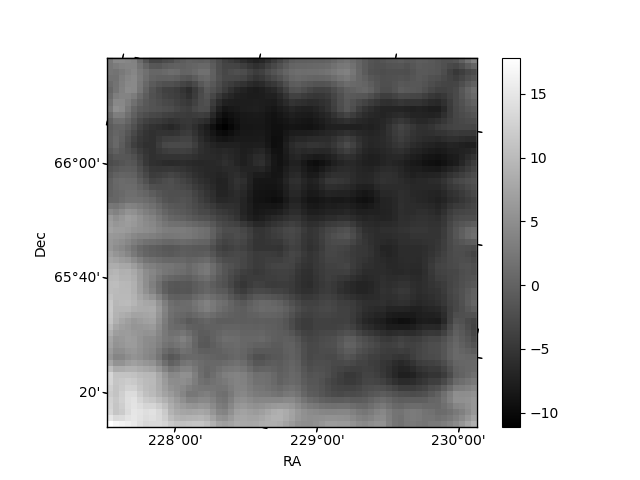
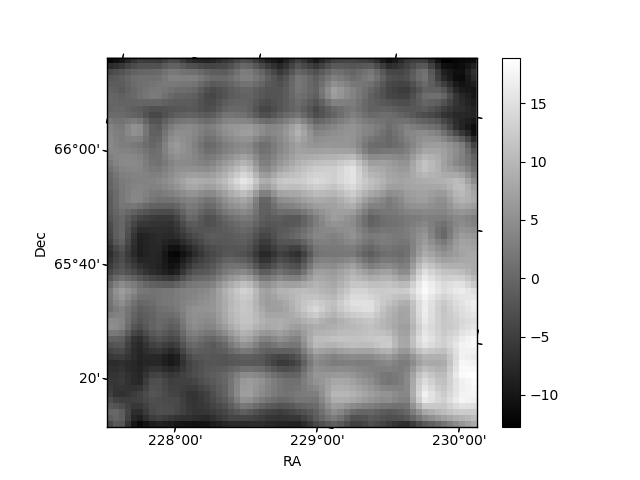
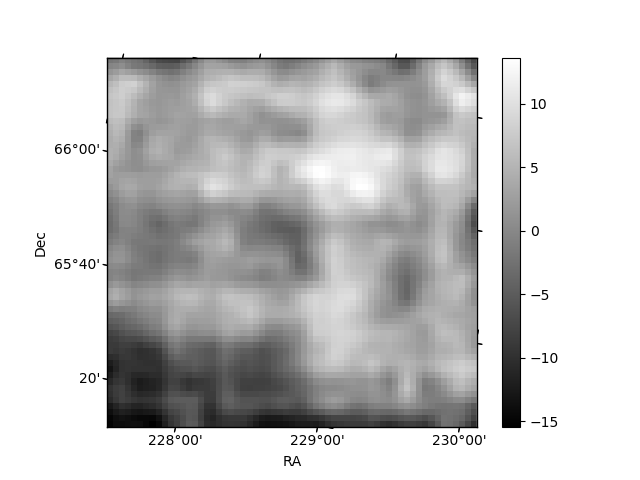
Histogram calculated using DETX and DETY for each event in the final _common_clean file
| Quadrant A | 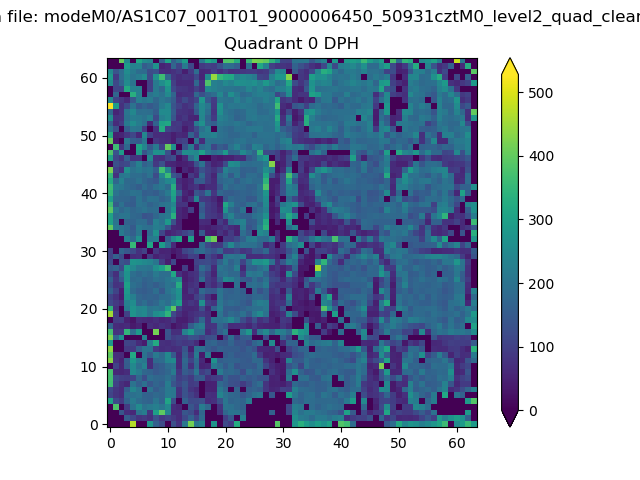 |
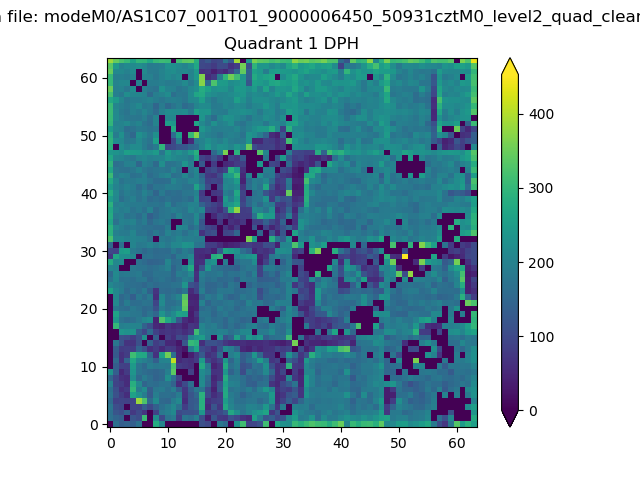 |
Quadrant B |
|---|---|---|---|
| Quadrant D | 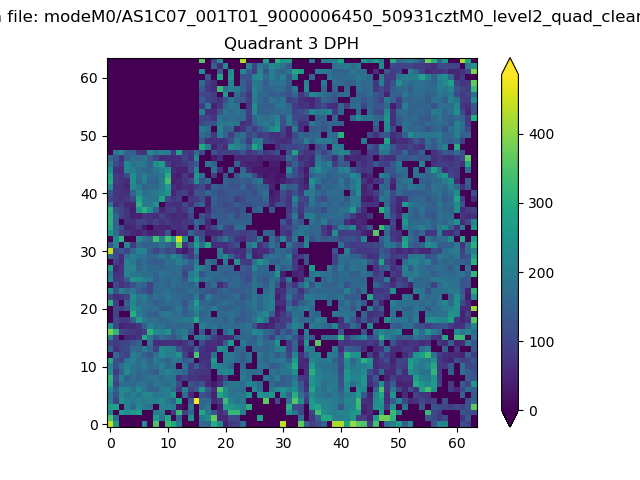 |
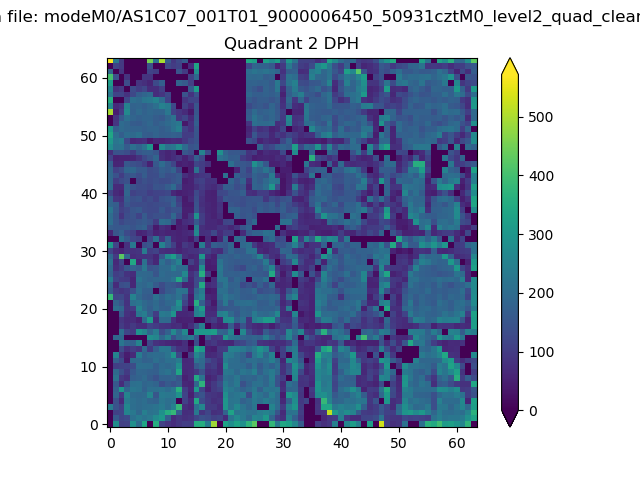 |
Quadrant C |
| Plot type | Count rate plots | Images |
|---|---|---|
| Comparison with Poisson distribution Blue bars denote a histogram of data divided into 1 sec bins. Red curve is a Poisson curve with rate = median count rate of data. |
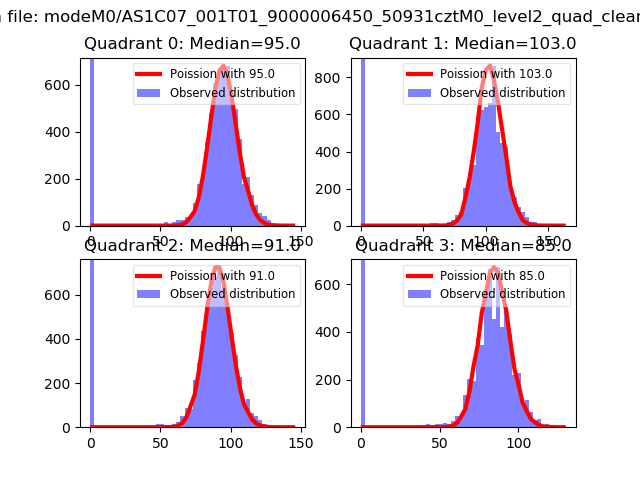 |
 |
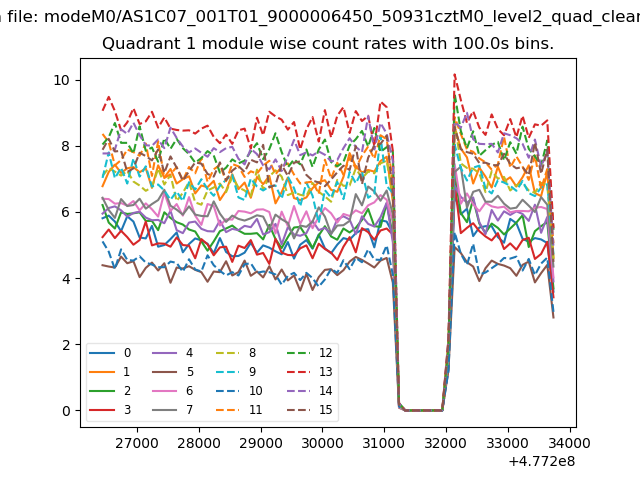
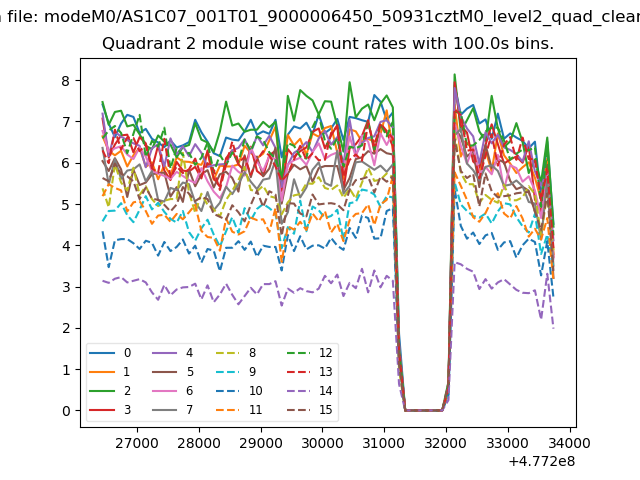
| Quadrant-wise count rates Data is divided into 100 sec bins |
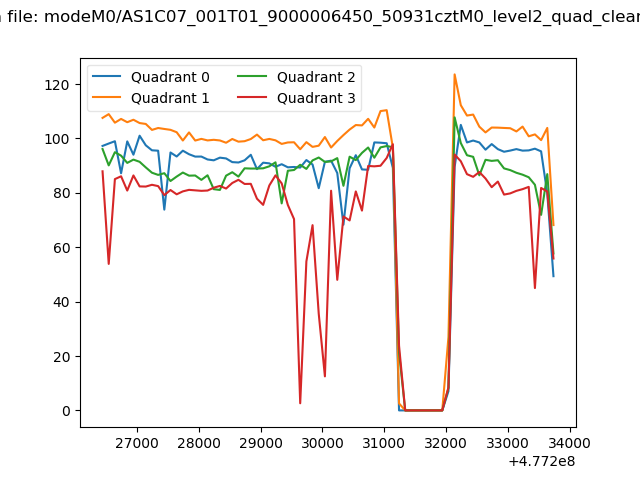 |
|
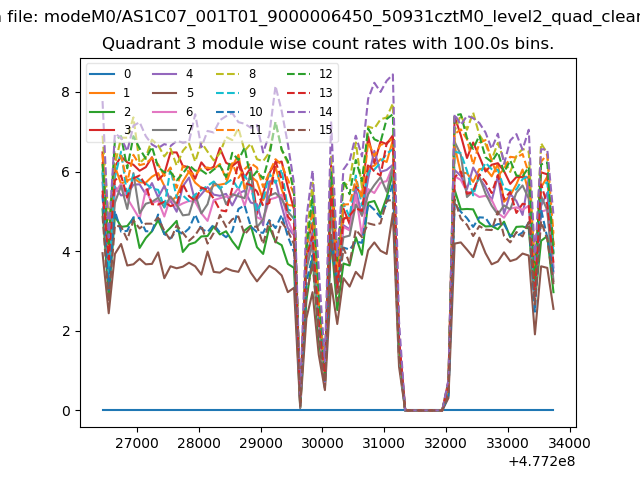
| Module-wise count rates for Quadrant A Data is divided into 100 sec bins |
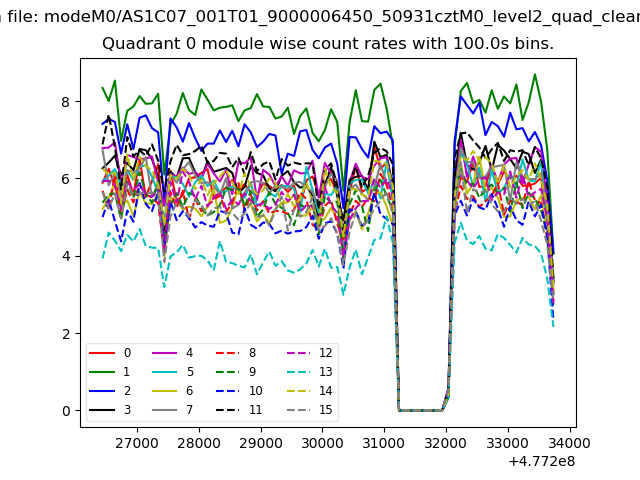 |
 |
| Module-wise count rates for Quadrant B Data is divided into 100 sec bins |
 |
 |
| Module-wise count rates for Quadrant C Data is divided into 100 sec bins |
 |
 |
| Module-wise count rates for Quadrant D Data is divided into 100 sec bins |
 |
 |
| Parameter | Plot |
|---|---|
| CZT HV Monitor | 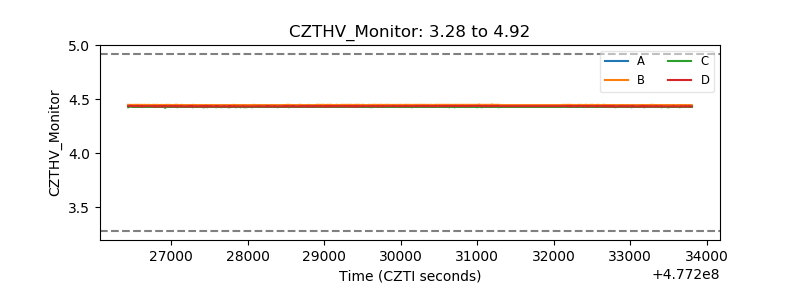 |
| D_VDD | 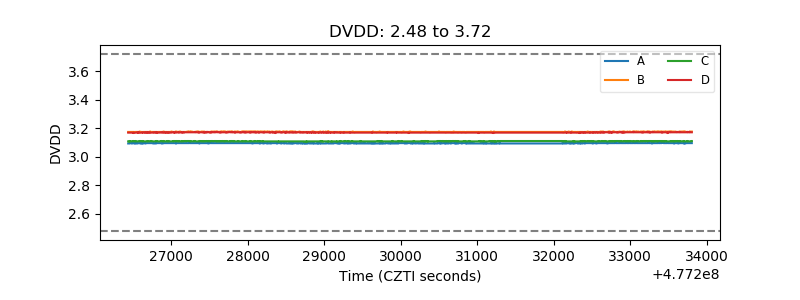 |
| Temperature 1 | 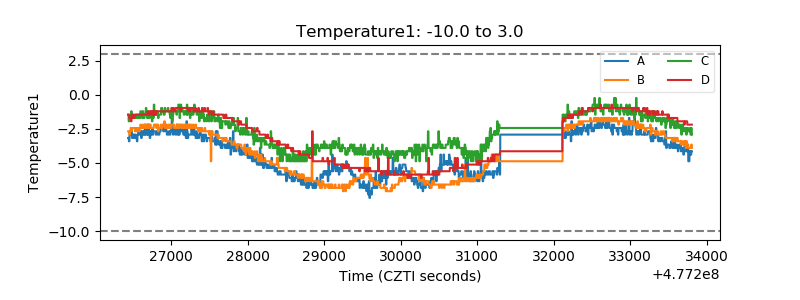 |
| Veto HV Monitor |  |
| Veto LLD | 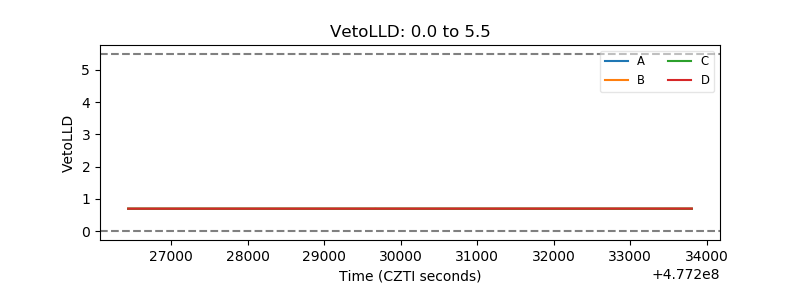 |
| Alpha Counter | 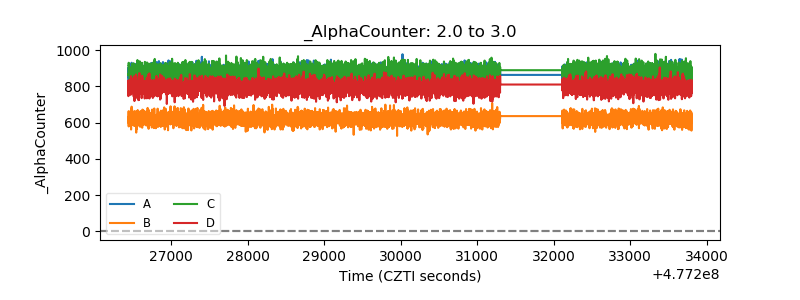 |
| _CPM_Rate | 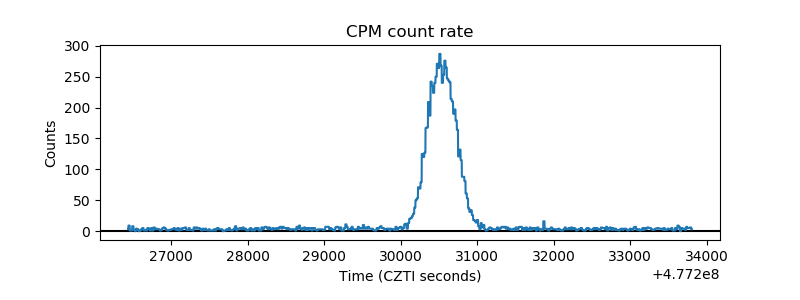 |
| CZT Counter | 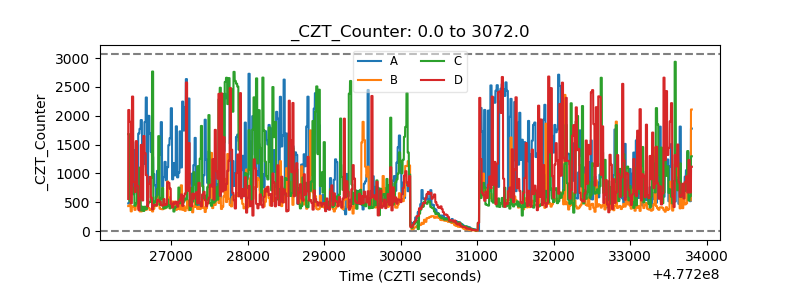 |
| +2.5 Volts monitor | 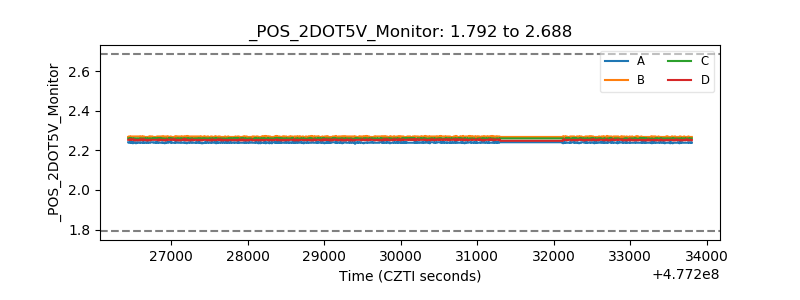 |
| +5 Volts monitor | 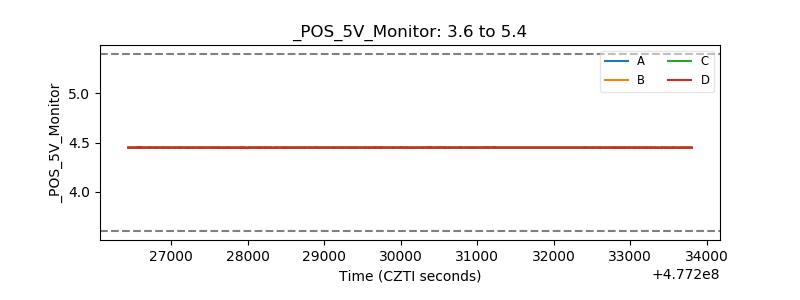 |
| _ROLL_ROT | 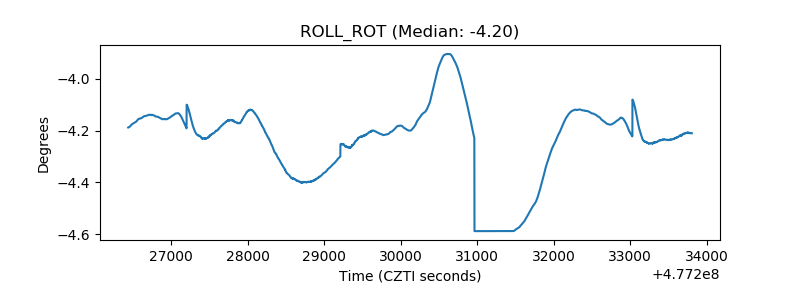 |
| _Roll_DEC | 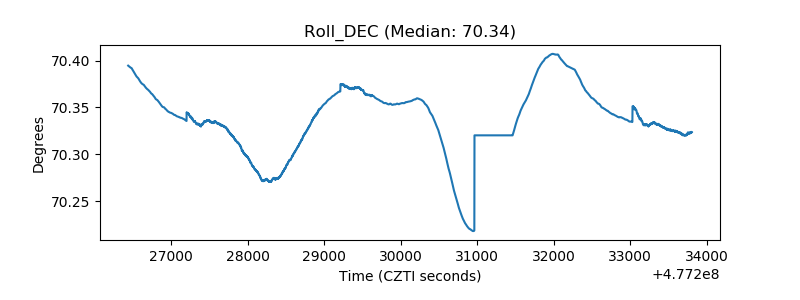 |
| _Roll_RA | 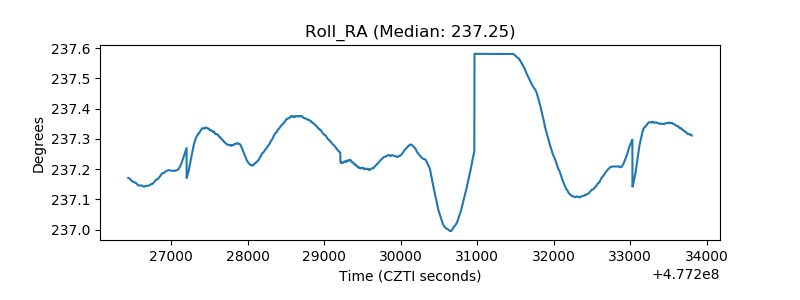 |
| Veto Counter | 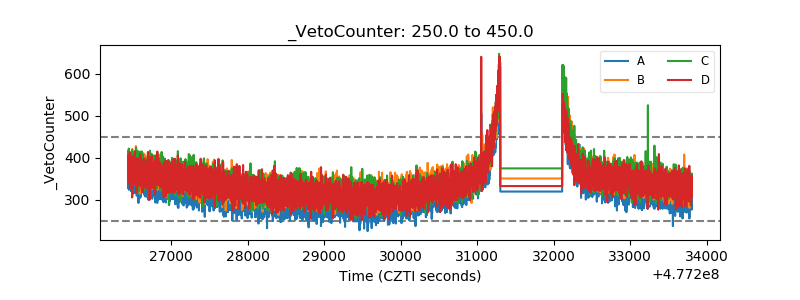 |