| Param | Original file | Final file |
|---|---|---|
| Filename | modeM0/AS1C07_001T01_9000006450_50932cztM0_level2.fits | modeM0/AS1C07_001T01_9000006450_50932cztM0_level2_quad_clean.evt |
| Size (bytes) | 589,541,760 | 96,143,040 |
| Size | 562.2 MB | 91.7 MB |
| Events in quadrant A | 8,542,460 | 520,870 |
| Events in quadrant B | 3,603,859 | 713,606 |
| Events in quadrant C | 3,854,168 | 620,383 |
| Events in quadrant D | 5,276,848 | 567,120 |
| Mode SS | |||
|---|---|---|---|
| Quadrant | BADHDUFLAG | Total packets | Discarded packets |
| A | 0 | 140 | 0 |
| B | 0 | 140 | 0 |
| C | 0 | 140 | 0 |
| D | 0 | 140 | 0 |
| Mode M0 | |||
|---|---|---|---|
| Quadrant | BADHDUFLAG | Total packets | Discarded packets |
| A | 0 | 30248 | 2 |
| B | 0 | 15882 | 1 |
| C | 0 | 16500 | 1 |
| D | 0 | 20647 | 1 |
| Mode M9 | |||
|---|---|---|---|
| Quadrant | BADHDUFLAG | Total packets | Discarded packets |
| A | 0 | 3 | 0 |
| B | 0 | 3 | 0 |
| C | 0 | 3 | 0 |
| D | 0 | 3 | 0 |
| Quadrant | Total seconds | Saturated seconds | Saturation percentage |
|---|---|---|---|
| A | 7029 | 1748 | 24.868402% |
| B | 7030 | 135 | 1.920341% |
| C | 7030 | 218 | 3.100996% |
| D | 7030 | 470 | 6.685633% |
Noise dominated data is calculated using 1-second bins in cleaned event files. If a bin has >2000 counts, and if more than 50% of those come from <1% of pixels, then it is considered to be noise-dominated and hence unusable.
| Quadrant | # 1 sec bins | Bins with >0 counts | Bins with >2000 counts | High rate bins dominated by noise | Noise dominated (total time) | Noise dominated (detector-on time) | Marked lightcurve |
|---|---|---|---|---|---|---|---|
| A | 7248 | 7028 | 1447 | 1447 | 19.96% | 20.59% | 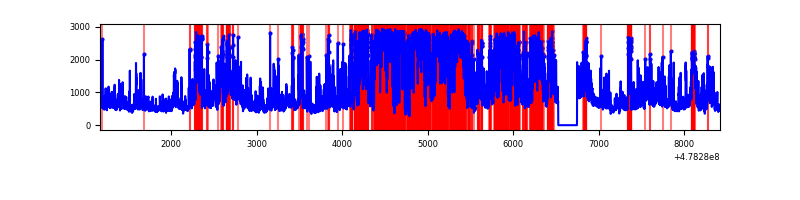 |
| B | 7249 | 7029 | 29 | 29 | 0.40% | 0.41% | 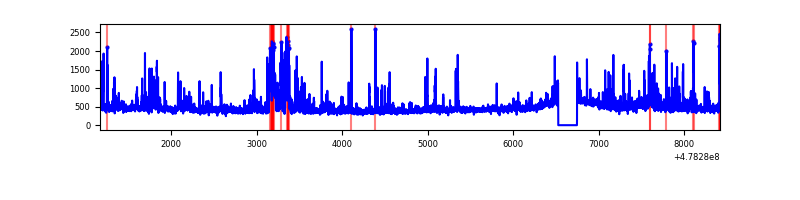 |
| C | 7249 | 7029 | 102 | 102 | 1.41% | 1.45% | 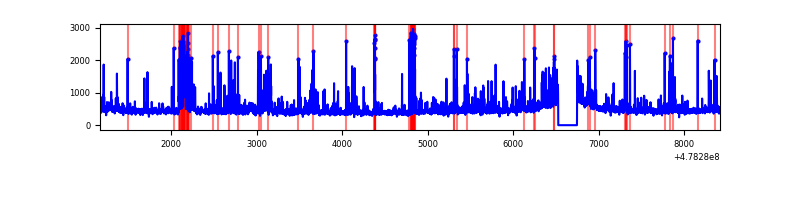 |
| D | 7249 | 7029 | 383 | 383 | 5.28% | 5.45% | 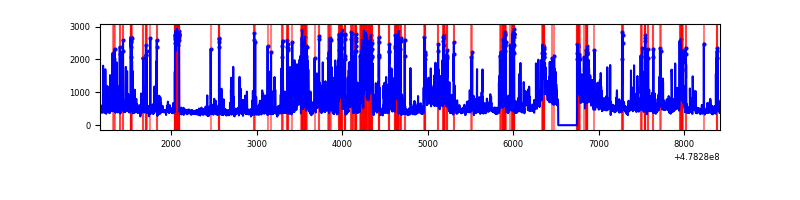 |
Top three noisy pixels from each quadrant. If the there are fewer than three noisy pixels in the level2.evt file, extra rows are filled as -1
| Pixel properties | Quadrant properties | ||||||
|---|---|---|---|---|---|---|---|
| Quadrant | DetID | PixID | Counts | Sigma | Mean | Median | Sigma |
| A | 14 | 254 | 4856290 | 30107.32 | 650 | 632 | 161.3 |
| A | 12 | 3 | 363455 | 2249.67 | 650 | 632 | 161.3 |
| A | 4 | 3 | 200400 | 1238.65 | 650 | 632 | 161.3 |
| B | 10 | 254 | 201370 | 1277.55 | 741 | 713 | 157.1 |
| B | 0 | 171 | 171982 | 1090.44 | 741 | 713 | 157.1 |
| B | 10 | 247 | 84972 | 536.46 | 741 | 713 | 157.1 |
| C | 12 | 252 | 169732 | 854.68 | 722 | 714 | 197.8 |
| C | 13 | 3 | 161624 | 813.68 | 722 | 714 | 197.8 |
| C | 1 | 60 | 130334 | 655.45 | 722 | 714 | 197.8 |
| D | 8 | 176 | 1007490 | 5123.72 | 705 | 681 | 196.5 |
| D | 2 | 249 | 370350 | 1881.27 | 705 | 681 | 196.5 |
| D | 3 | 12 | 239797 | 1216.88 | 705 | 681 | 196.5 |
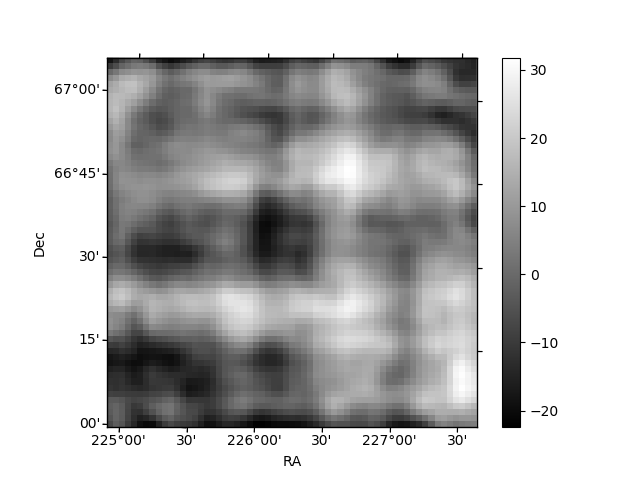
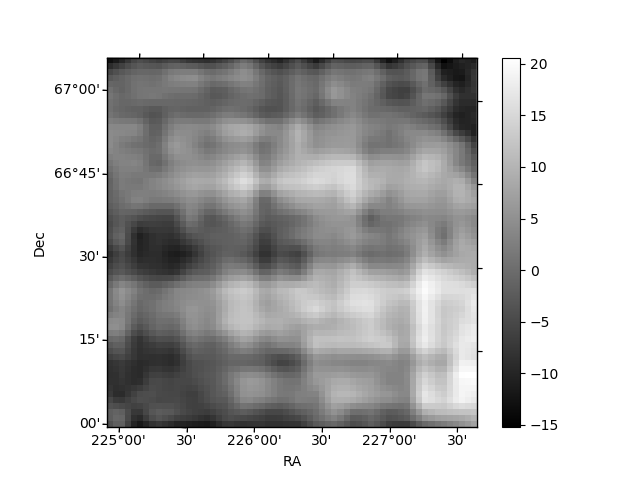
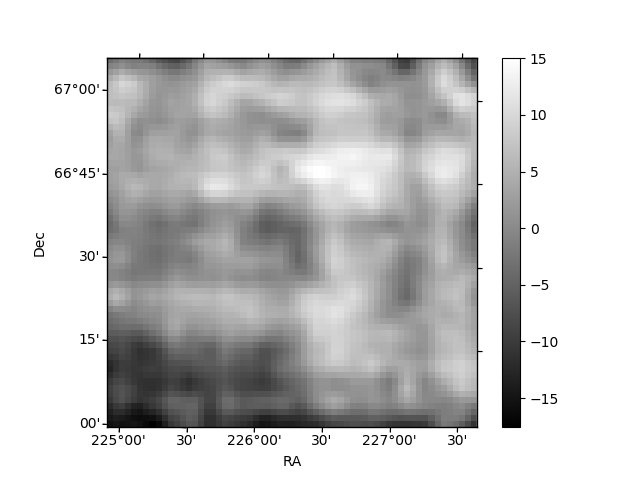
Histogram calculated using DETX and DETY for each event in the final _common_clean file
| Quadrant A | 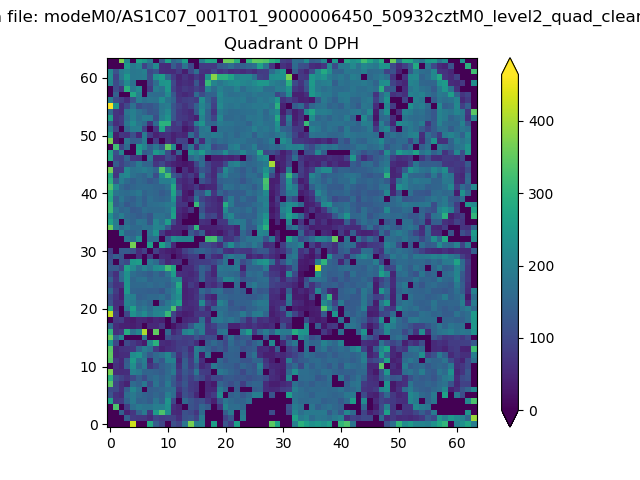 |
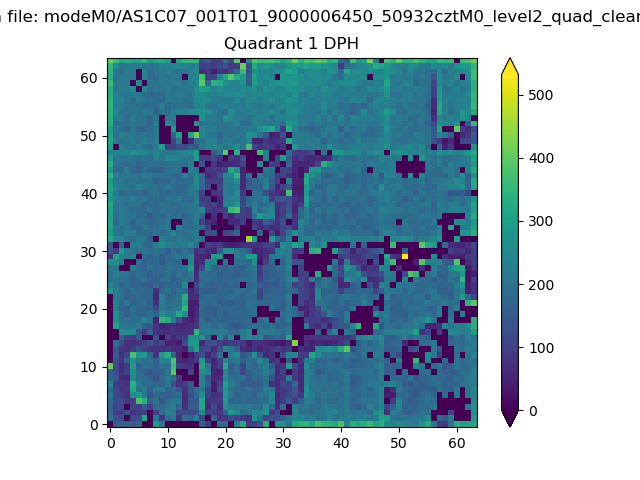 |
Quadrant B |
|---|---|---|---|
| Quadrant D | 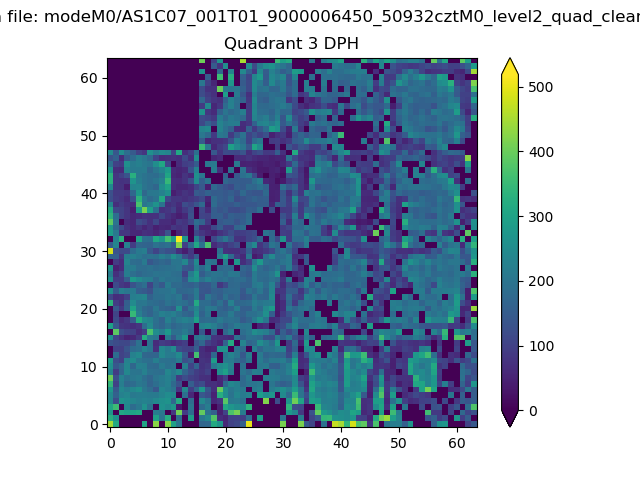 |
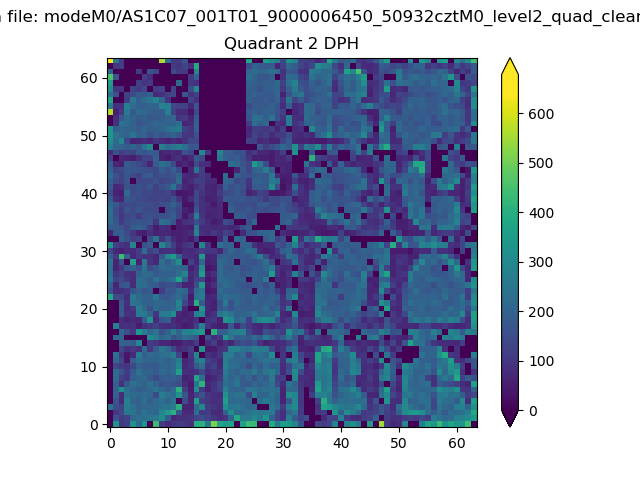 |
Quadrant C |
| Plot type | Count rate plots | Images |
|---|---|---|
| Comparison with Poisson distribution Blue bars denote a histogram of data divided into 1 sec bins. Red curve is a Poisson curve with rate = median count rate of data. |
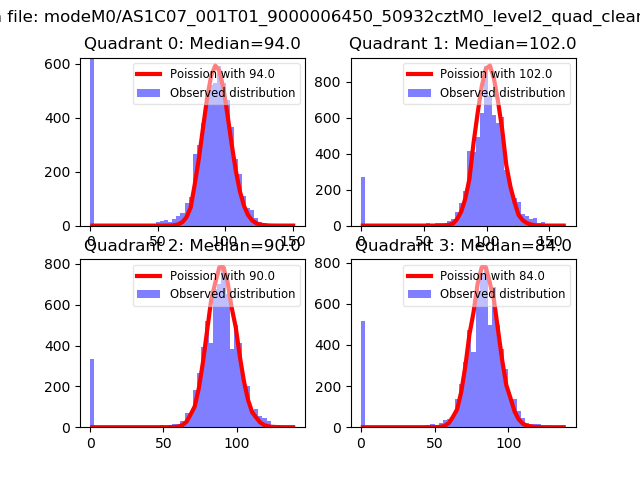 |
 |
| Quadrant-wise count rates Data is divided into 100 sec bins |
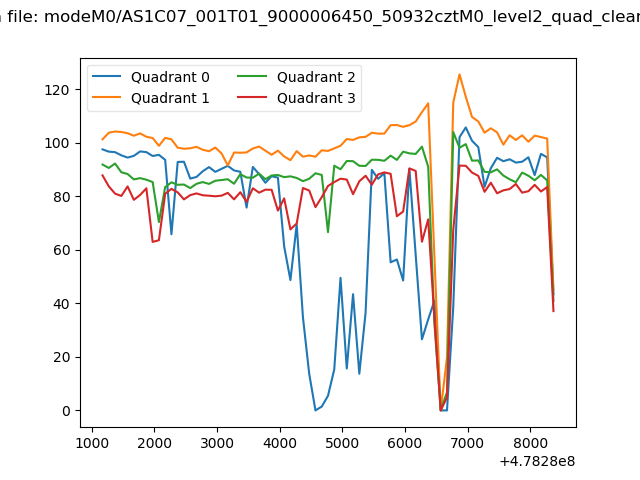 |
|
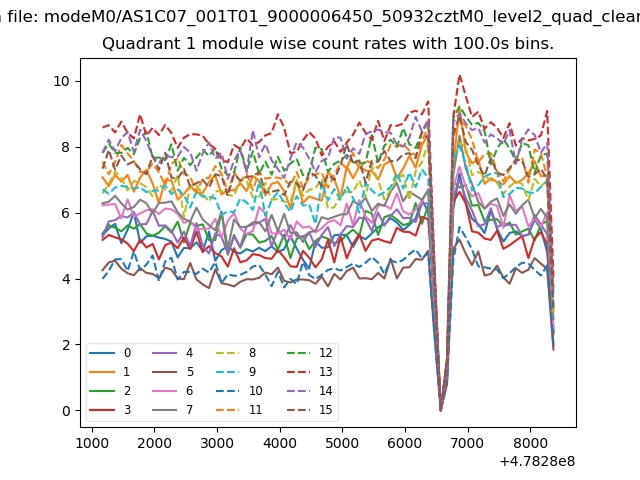
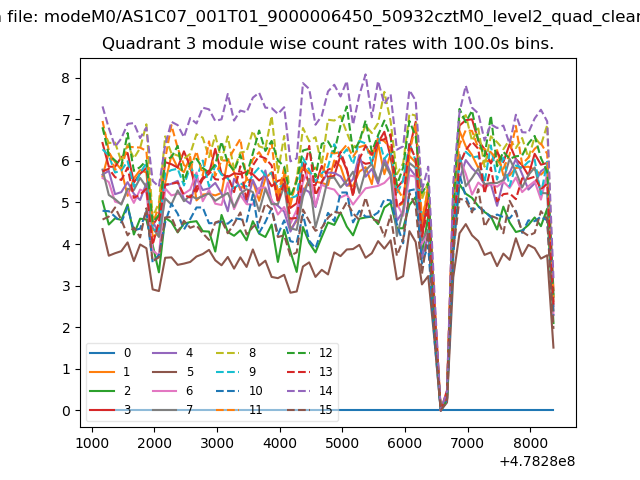
| Module-wise count rates for Quadrant A Data is divided into 100 sec bins |
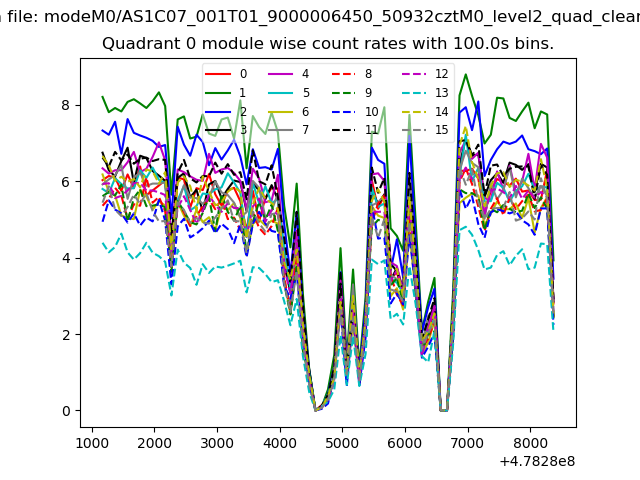 |
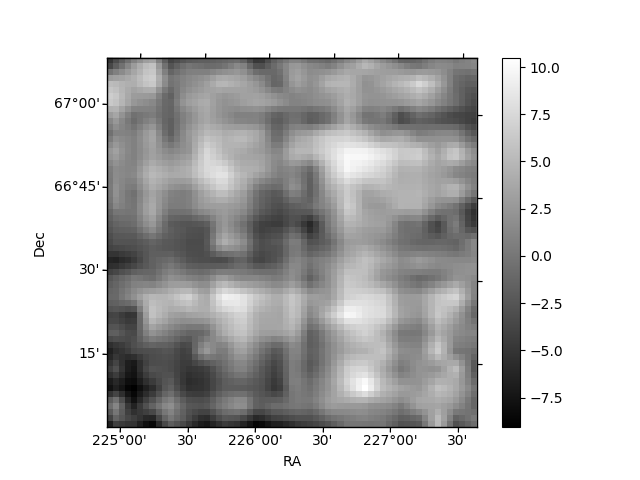 |
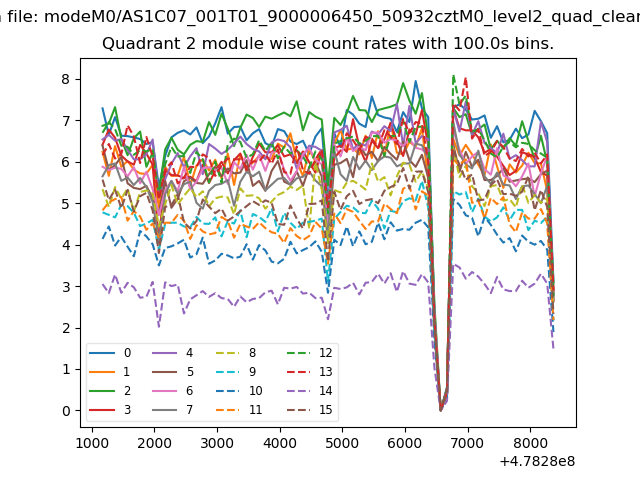
| Module-wise count rates for Quadrant B Data is divided into 100 sec bins |
 |
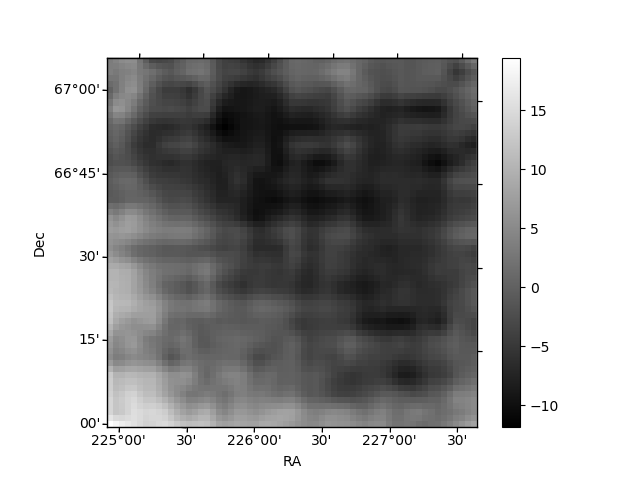 |
| Module-wise count rates for Quadrant C Data is divided into 100 sec bins |
 |
 |
| Module-wise count rates for Quadrant D Data is divided into 100 sec bins |
 |
 |
| Parameter | Plot |
|---|---|
| CZT HV Monitor |  |
| D_VDD | 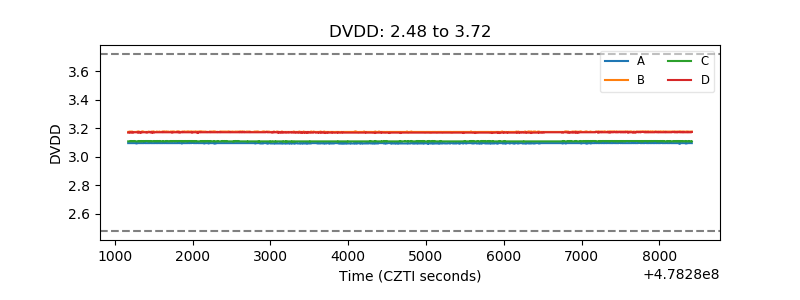 |
| Temperature 1 | 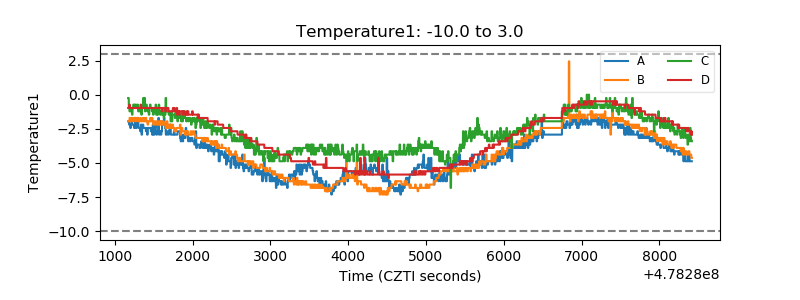 |
| Veto HV Monitor | 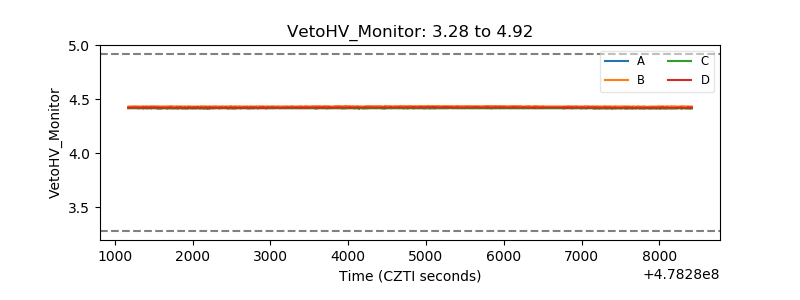 |
| Veto LLD | 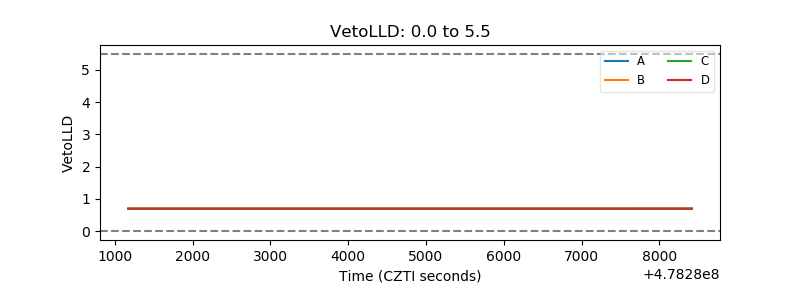 |
| Alpha Counter | 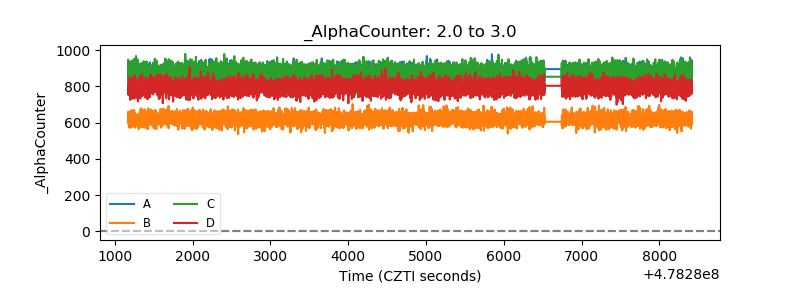 |
| _CPM_Rate | 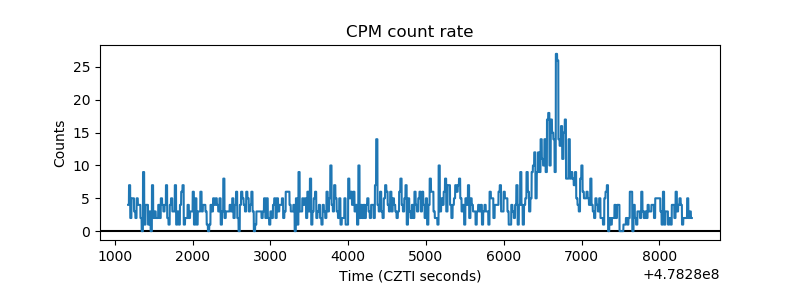 |
| CZT Counter | 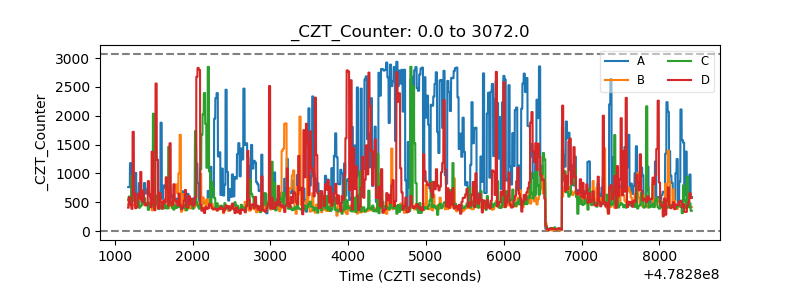 |
| +2.5 Volts monitor | 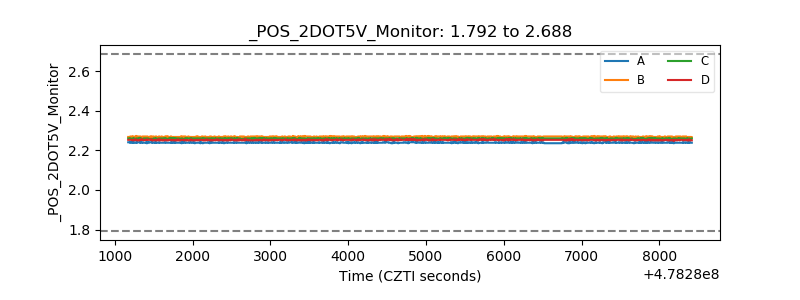 |
| +5 Volts monitor | 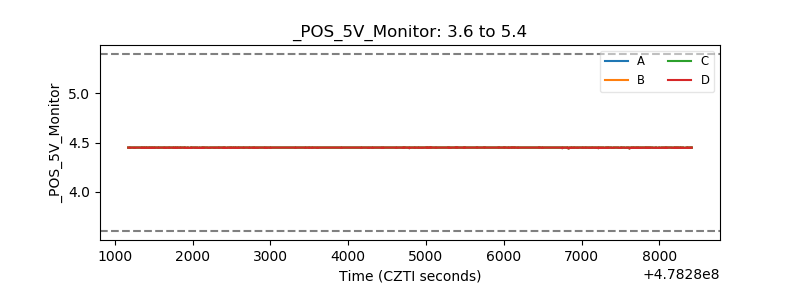 |
| _ROLL_ROT | 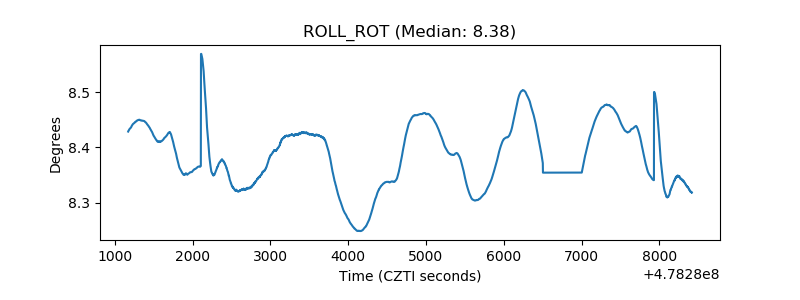 |
| _Roll_DEC | 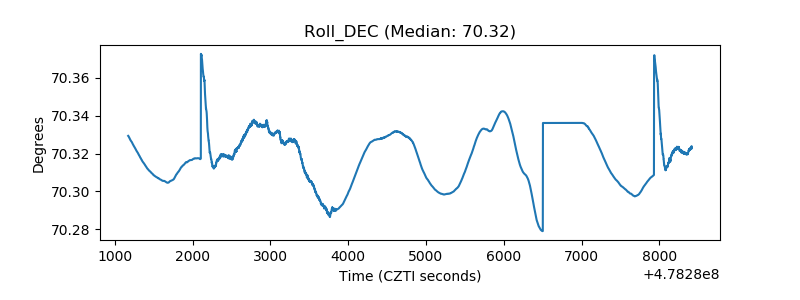 |
| _Roll_RA | 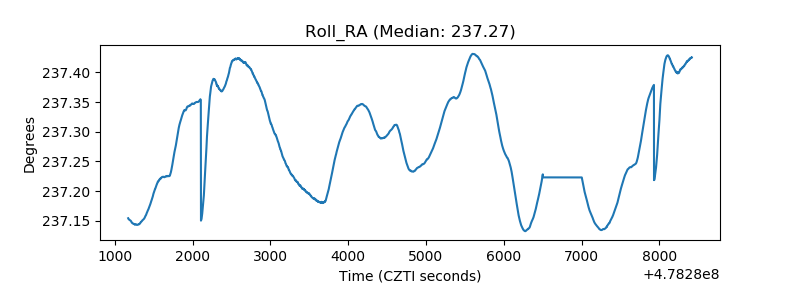 |
| Veto Counter | 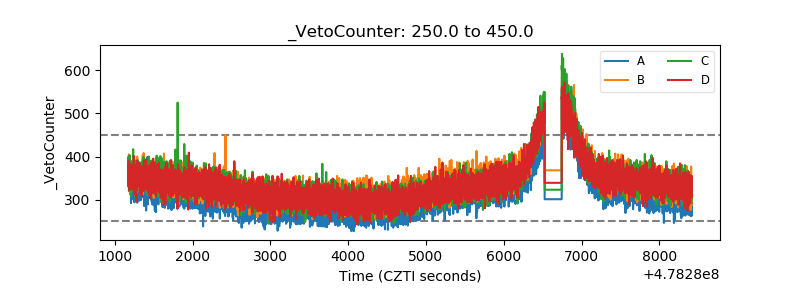 |