| Param | Original file | Final file |
|---|---|---|
| Filename | modeM0/AS1C07_001T01_9000006450_50933cztM0_level2.fits | modeM0/AS1C07_001T01_9000006450_50933cztM0_level2_quad_clean.evt |
| Size (bytes) | 634,654,080 | 108,216,000 |
| Size | 605.3 MB | 103.2 MB |
| Events in quadrant A | 7,595,339 | 669,143 |
| Events in quadrant B | 4,006,029 | 785,091 |
| Events in quadrant C | 5,917,564 | 637,525 |
| Events in quadrant D | 5,369,970 | 642,913 |
| Mode SS | |||
|---|---|---|---|
| Quadrant | BADHDUFLAG | Total packets | Discarded packets |
| A | 0 | 156 | 0 |
| B | 0 | 156 | 0 |
| C | 0 | 156 | 0 |
| D | 0 | 156 | 0 |
| Mode M0 | |||
|---|---|---|---|
| Quadrant | BADHDUFLAG | Total packets | Discarded packets |
| A | 0 | 27967 | 0 |
| B | 0 | 17594 | 0 |
| C | 0 | 23106 | 0 |
| D | 0 | 21413 | 0 |
| Quadrant | Total seconds | Saturated seconds | Saturation percentage |
|---|---|---|---|
| A | 7791 | 923 | 11.847003% |
| B | 7791 | 99 | 1.270697% |
| C | 7792 | 786 | 10.087269% |
| D | 7791 | 249 | 3.195995% |
Noise dominated data is calculated using 1-second bins in cleaned event files. If a bin has >2000 counts, and if more than 50% of those come from <1% of pixels, then it is considered to be noise-dominated and hence unusable.
| Quadrant | # 1 sec bins | Bins with >0 counts | Bins with >2000 counts | High rate bins dominated by noise | Noise dominated (total time) | Noise dominated (detector-on time) | Marked lightcurve |
|---|---|---|---|---|---|---|---|
| A | 7791 | 7791 | 859 | 859 | 11.03% | 11.03% | 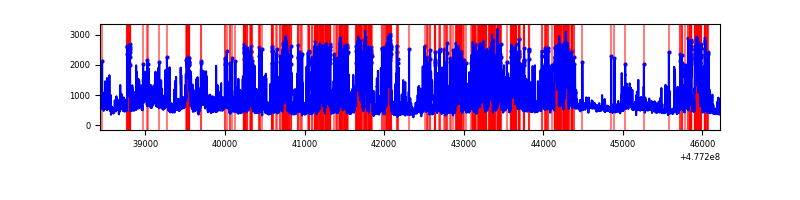 |
| B | 7790 | 7790 | 59 | 59 | 0.76% | 0.76% | 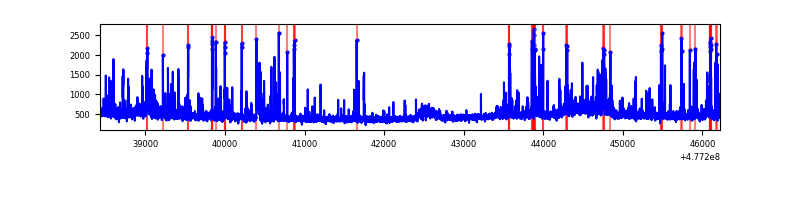 |
| C | 7792 | 7792 | 616 | 616 | 7.91% | 7.91% | 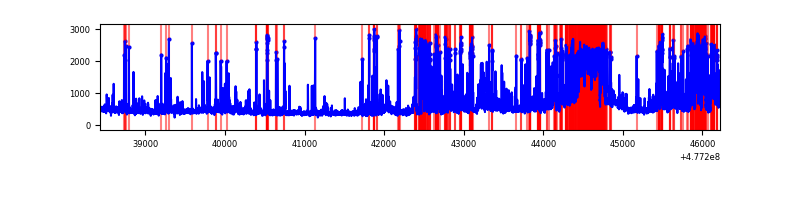 |
| D | 7791 | 7791 | 260 | 260 | 3.34% | 3.34% | 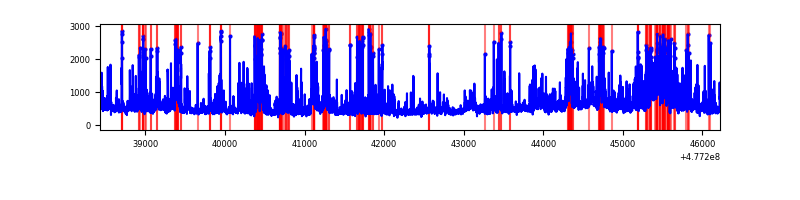 |
Top three noisy pixels from each quadrant. If the there are fewer than three noisy pixels in the level2.evt file, extra rows are filled as -1
| Pixel properties | Quadrant properties | ||||||
|---|---|---|---|---|---|---|---|
| Quadrant | DetID | PixID | Counts | Sigma | Mean | Median | Sigma |
| A | 14 | 254 | 2844300 | 14546.2 | 784 | 765 | 195.5 |
| A | 12 | 3 | 385790 | 1969.61 | 784 | 765 | 195.5 |
| A | 7 | 207 | 308549 | 1574.48 | 784 | 765 | 195.5 |
| B | 0 | 171 | 237315 | 1364.35 | 813 | 784 | 173.4 |
| B | 10 | 247 | 201116 | 1155.55 | 813 | 784 | 173.4 |
| B | 7 | 252 | 84449 | 482.59 | 813 | 784 | 173.4 |
| C | 5 | 10 | 994193 | 4560.94 | 764 | 756 | 217.8 |
| C | 4 | 210 | 765756 | 3512.17 | 764 | 756 | 217.8 |
| C | 13 | 3 | 270111 | 1236.63 | 764 | 756 | 217.8 |
| D | 3 | 12 | 339435 | 1541.54 | 787 | 757 | 219.7 |
| D | 2 | 249 | 326000 | 1480.39 | 787 | 757 | 219.7 |
| D | 7 | 222 | 221542 | 1004.93 | 787 | 757 | 219.7 |
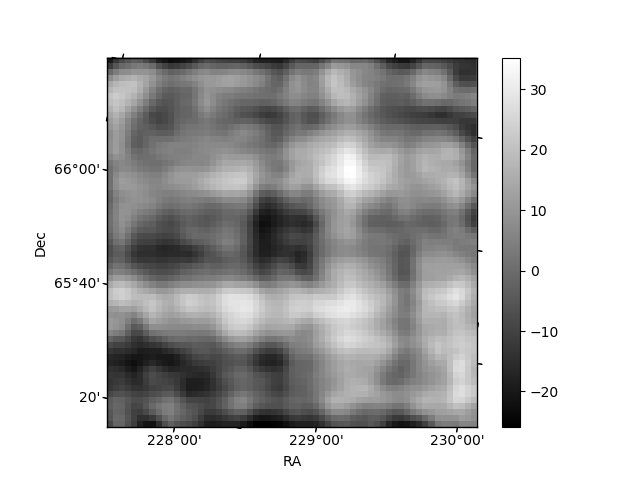
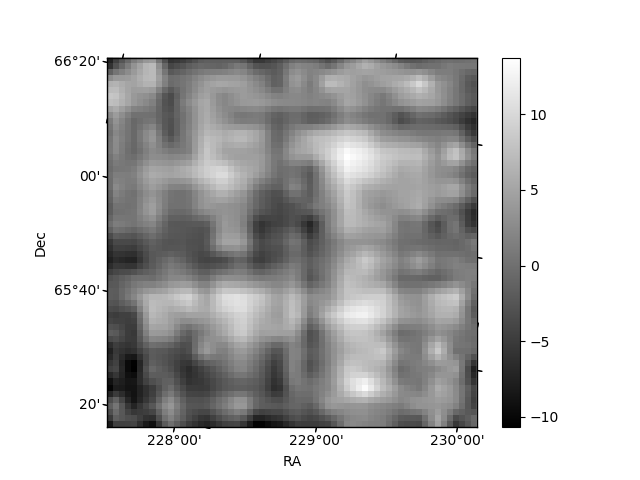
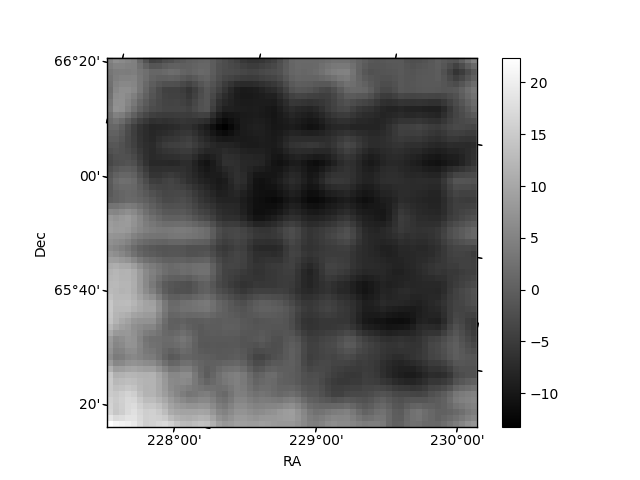
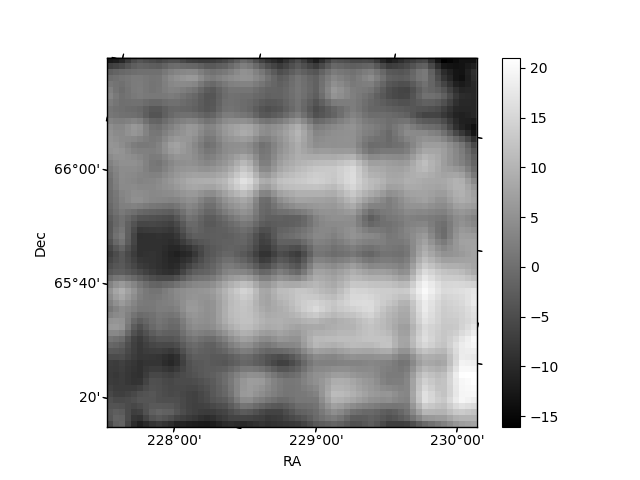
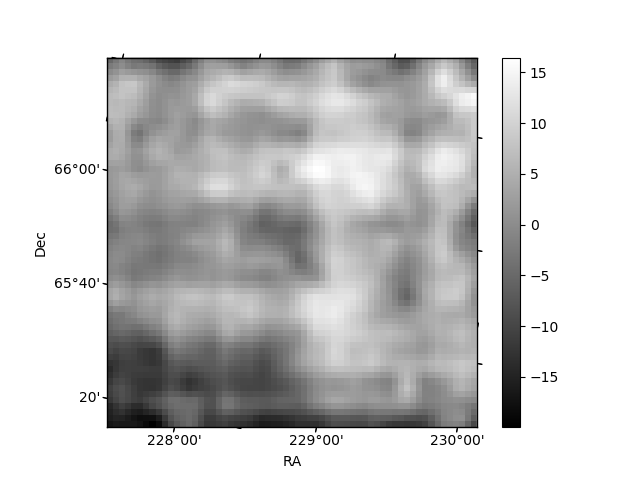
Histogram calculated using DETX and DETY for each event in the final _common_clean file
| Quadrant A | 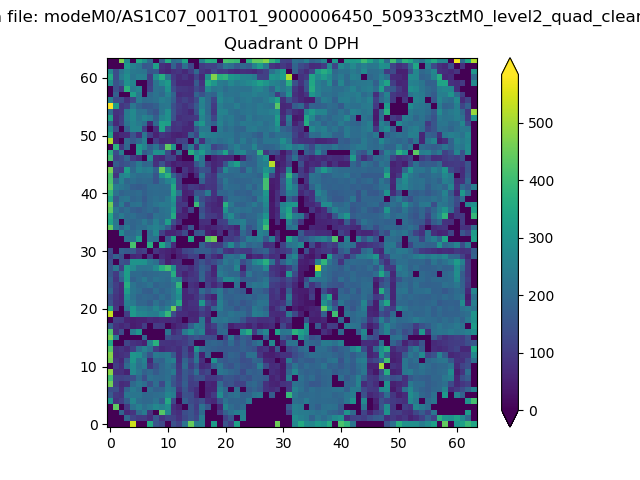 |
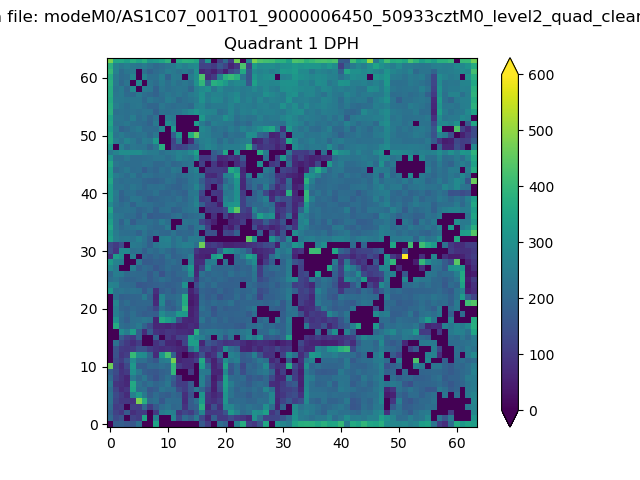 |
Quadrant B |
|---|---|---|---|
| Quadrant D | 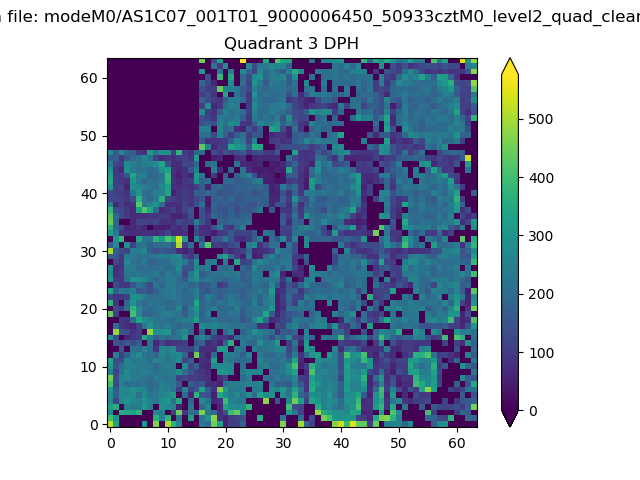 |
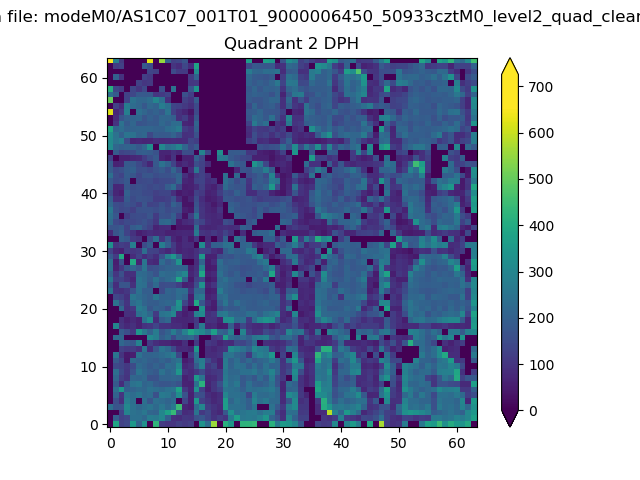 |
Quadrant C |
| Plot type | Count rate plots | Images |
|---|---|---|
| Comparison with Poisson distribution Blue bars denote a histogram of data divided into 1 sec bins. Red curve is a Poisson curve with rate = median count rate of data. |
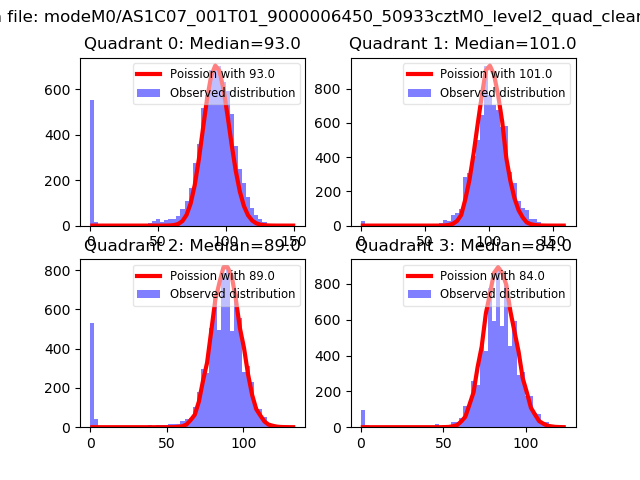 |
 |
| Quadrant-wise count rates Data is divided into 100 sec bins |
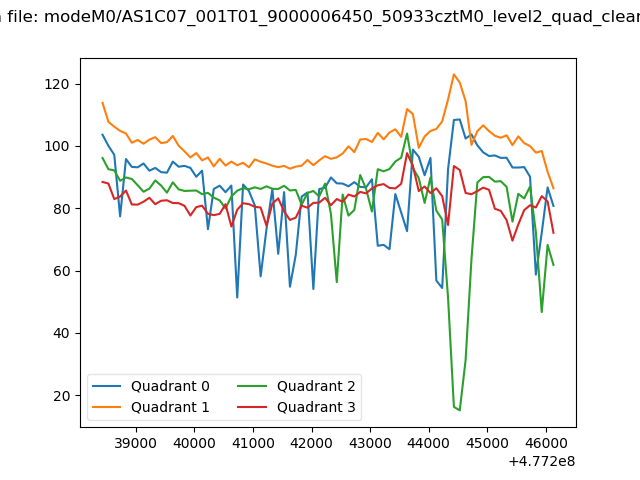 |
|
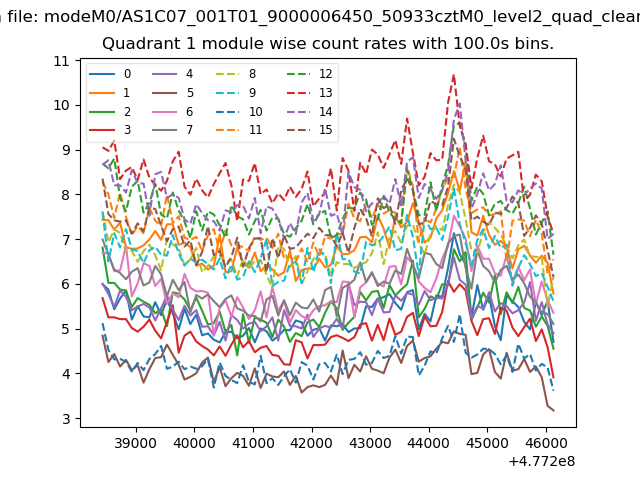
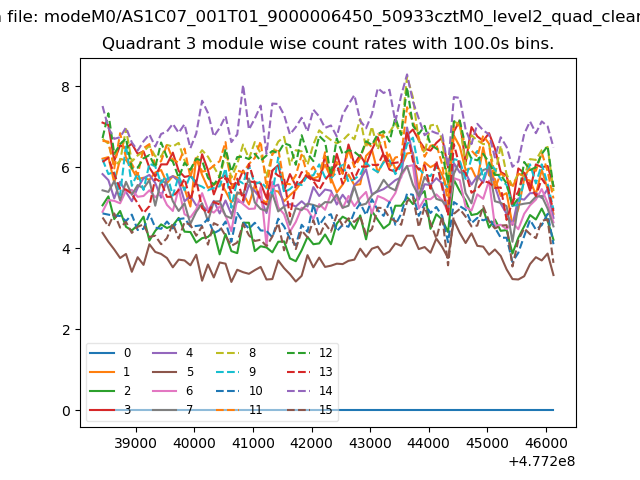
| Module-wise count rates for Quadrant A Data is divided into 100 sec bins |
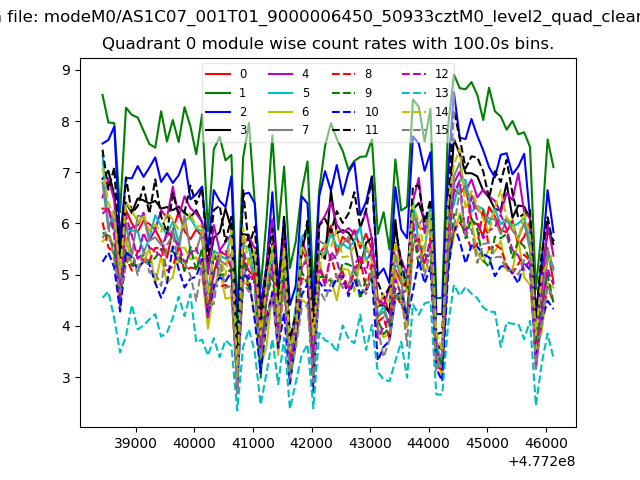 |
 |
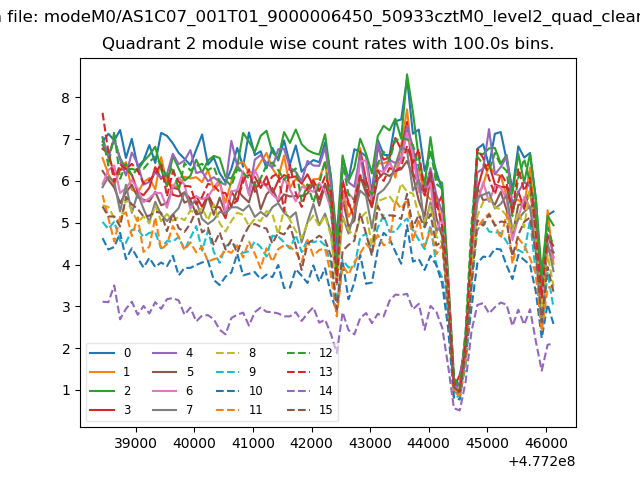
| Module-wise count rates for Quadrant B Data is divided into 100 sec bins |
 |
 |
| Module-wise count rates for Quadrant C Data is divided into 100 sec bins |
 |
 |
| Module-wise count rates for Quadrant D Data is divided into 100 sec bins |
 |
 |
| Parameter | Plot |
|---|---|
| CZT HV Monitor | 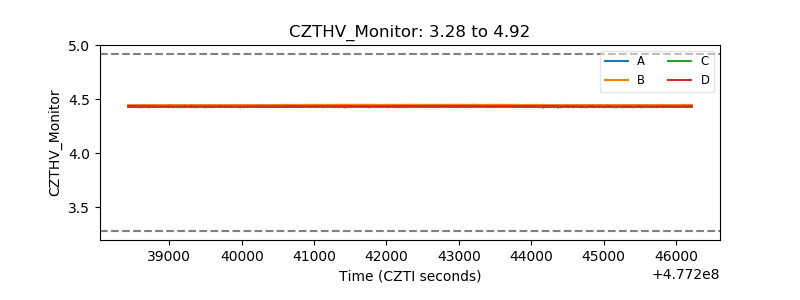 |
| D_VDD | 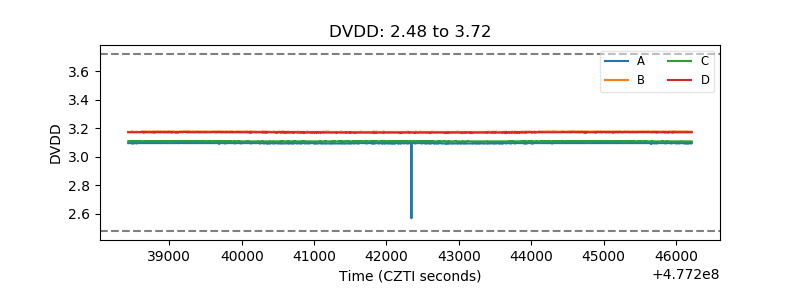 |
| Temperature 1 | 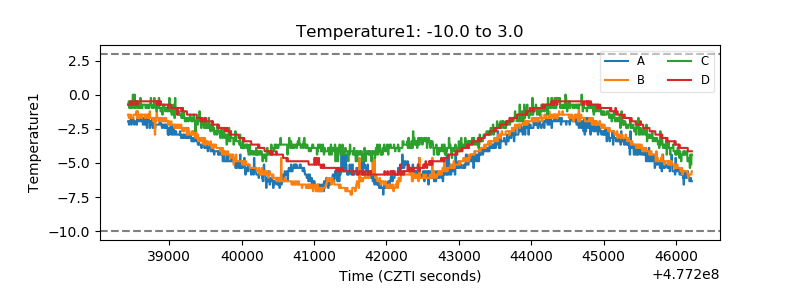 |
| Veto HV Monitor |  |
| Veto LLD |  |
| Alpha Counter | 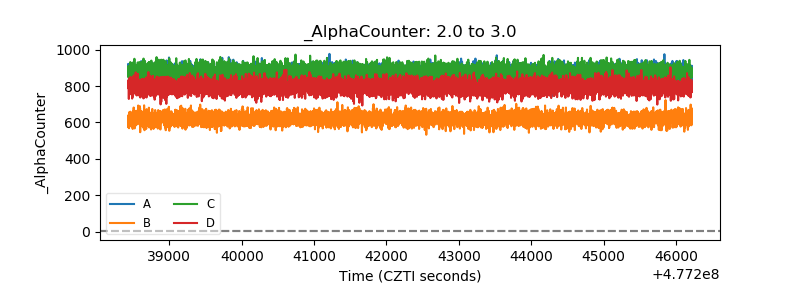 |
| _CPM_Rate | 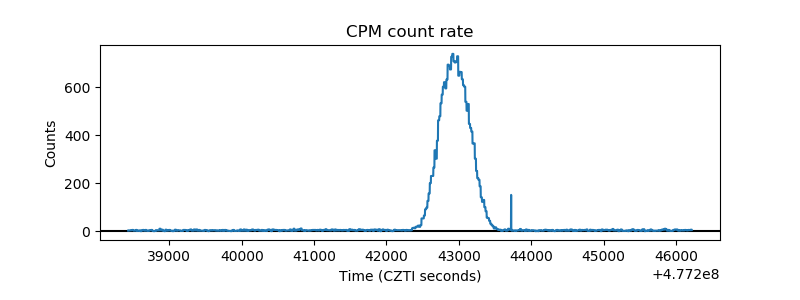 |
| CZT Counter | 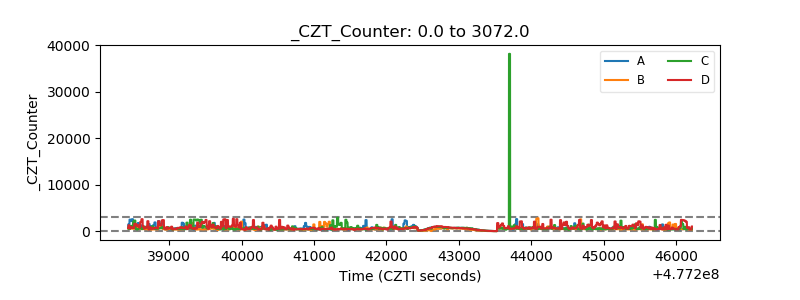 |
| +2.5 Volts monitor | 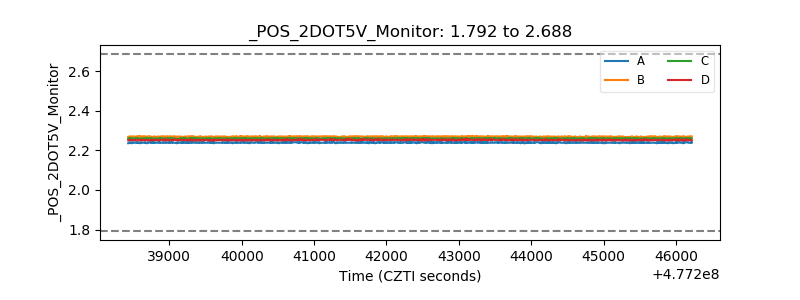 |
| +5 Volts monitor | 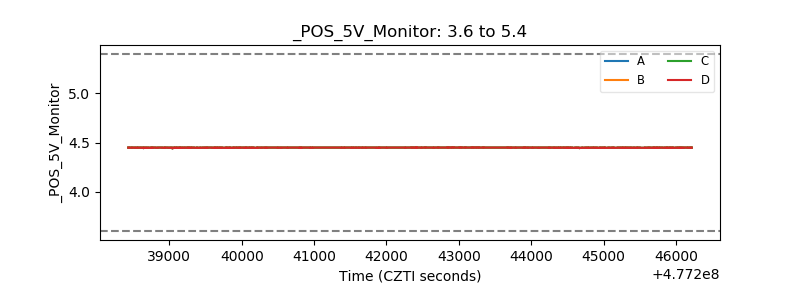 |
| _ROLL_ROT | 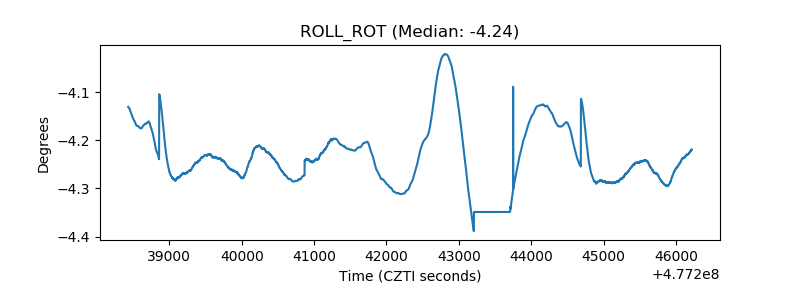 |
| _Roll_DEC | 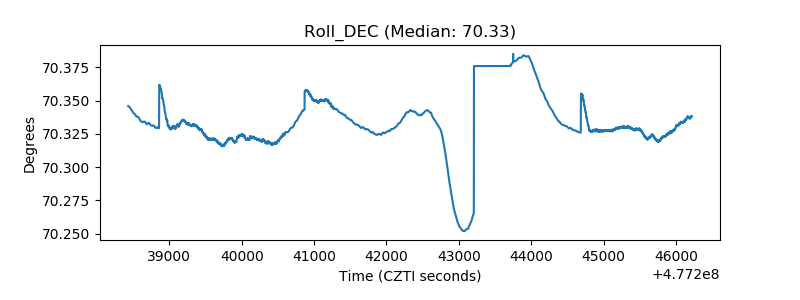 |
| _Roll_RA | 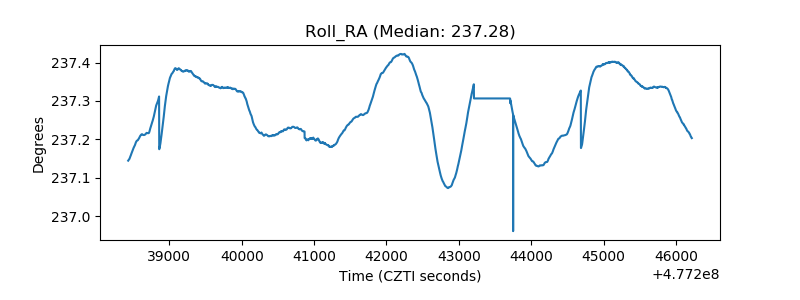 |
| Veto Counter | 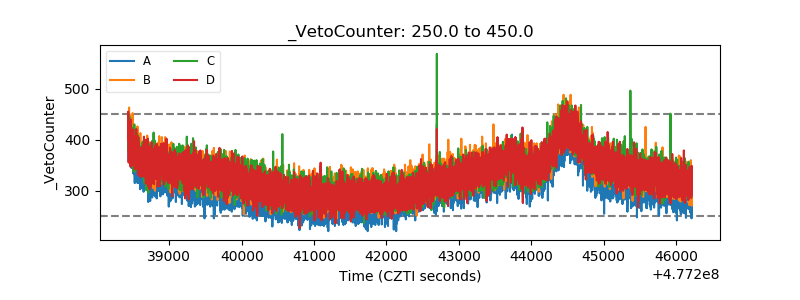 |