| Param | Original file | Final file |
|---|---|---|
| Filename | modeM0/AS1C07_001T01_9000006450_50934cztM0_level2.fits | modeM0/AS1C07_001T01_9000006450_50934cztM0_level2_quad_clean.evt |
| Size (bytes) | 864,639,360 | 102,021,120 |
| Size | 824.6 MB | 97.3 MB |
| Events in quadrant A | 5,920,401 | 736,251 |
| Events in quadrant B | 4,070,491 | 825,954 |
| Events in quadrant C | 12,491,541 | 409,222 |
| Events in quadrant D | 8,891,950 | 550,293 |
| Mode SS | |||
|---|---|---|---|
| Quadrant | BADHDUFLAG | Total packets | Discarded packets |
| A | 0 | 164 | 0 |
| B | 0 | 164 | 0 |
| C | 0 | 164 | 0 |
| D | 0 | 164 | 0 |
| Mode M0 | |||
|---|---|---|---|
| Quadrant | BADHDUFLAG | Total packets | Discarded packets |
| A | 0 | 23348 | 0 |
| B | 0 | 17982 | 0 |
| C | 0 | 42756 | 0 |
| D | 0 | 32177 | 7 |
| Quadrant | Total seconds | Saturated seconds | Saturation percentage |
|---|---|---|---|
| A | 8153 | 457 | 5.605299% |
| B | 8153 | 81 | 0.993499% |
| C | 8154 | 3831 | 46.983076% |
| D | 8153 | 1702 | 20.875751% |
Noise dominated data is calculated using 1-second bins in cleaned event files. If a bin has >2000 counts, and if more than 50% of those come from <1% of pixels, then it is considered to be noise-dominated and hence unusable.
| Quadrant | # 1 sec bins | Bins with >0 counts | Bins with >2000 counts | High rate bins dominated by noise | Noise dominated (total time) | Noise dominated (detector-on time) | Marked lightcurve |
|---|---|---|---|---|---|---|---|
| A | 8153 | 8153 | 429 | 429 | 5.26% | 5.26% | 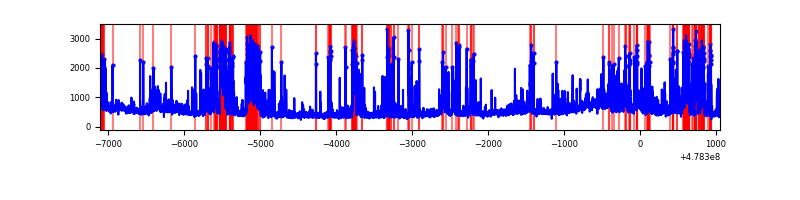 |
| B | 8153 | 8153 | 42 | 42 | 0.52% | 0.52% |  |
| C | 8154 | 8154 | 3065 | 3065 | 37.59% | 37.59% | 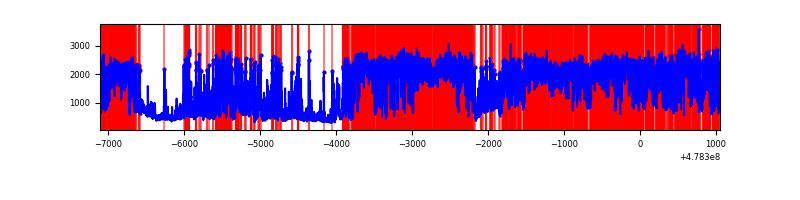 |
| D | 8153 | 8153 | 1680 | 1680 | 20.61% | 20.61% | 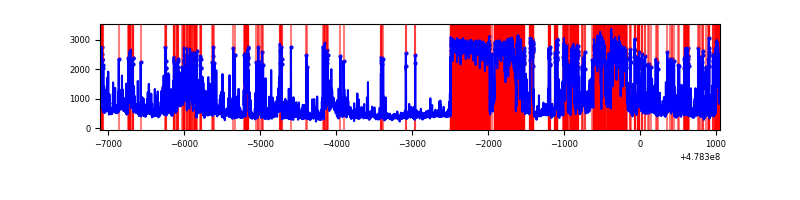 |
Top three noisy pixels from each quadrant. If the there are fewer than three noisy pixels in the level2.evt file, extra rows are filled as -1
| Pixel properties | Quadrant properties | ||||||
|---|---|---|---|---|---|---|---|
| Quadrant | DetID | PixID | Counts | Sigma | Mean | Median | Sigma |
| A | 14 | 254 | 1489635 | 6960.4 | 851 | 830 | 213.9 |
| A | 4 | 3 | 224145 | 1044.03 | 851 | 830 | 213.9 |
| A | 3 | 130 | 215443 | 1003.35 | 851 | 830 | 213.9 |
| B | 10 | 247 | 201096 | 1082.17 | 862 | 829 | 185.1 |
| B | 0 | 171 | 155097 | 833.61 | 862 | 829 | 185.1 |
| B | 7 | 252 | 78696 | 420.77 | 862 | 829 | 185.1 |
| C | 4 | 210 | 6158656 | 34477.41 | 634 | 629 | 178.6 |
| C | 5 | 10 | 1477211 | 8267.05 | 634 | 629 | 178.6 |
| C | 12 | 247 | 703930 | 3937.62 | 634 | 629 | 178.6 |
| D | 15 | 184 | 2779511 | 13725.77 | 728 | 701 | 202.5 |
| D | 8 | 176 | 730994 | 3607.24 | 728 | 701 | 202.5 |
| D | 15 | 185 | 645749 | 3186.18 | 728 | 701 | 202.5 |
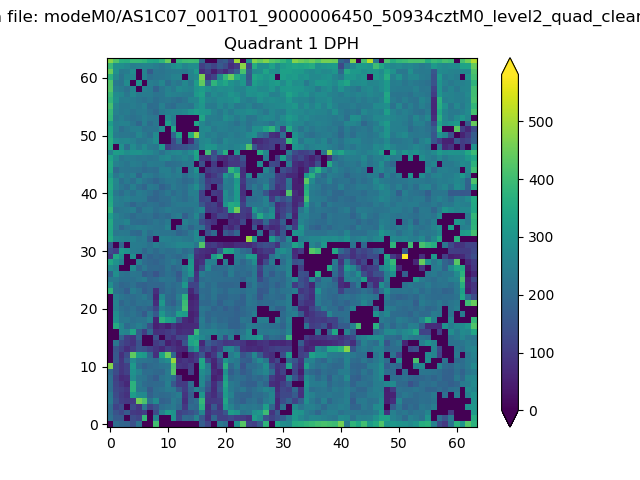
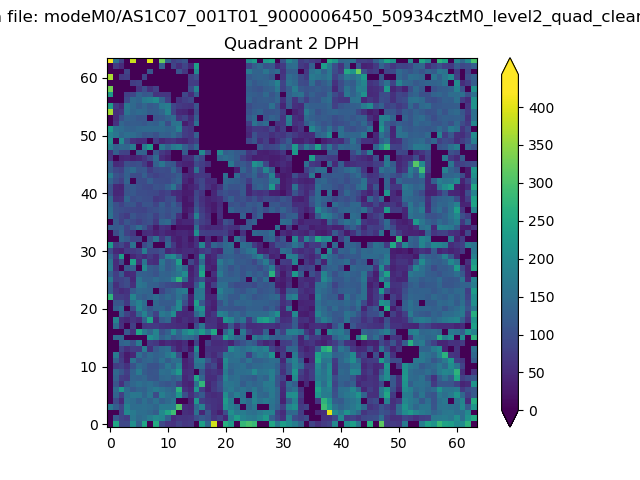
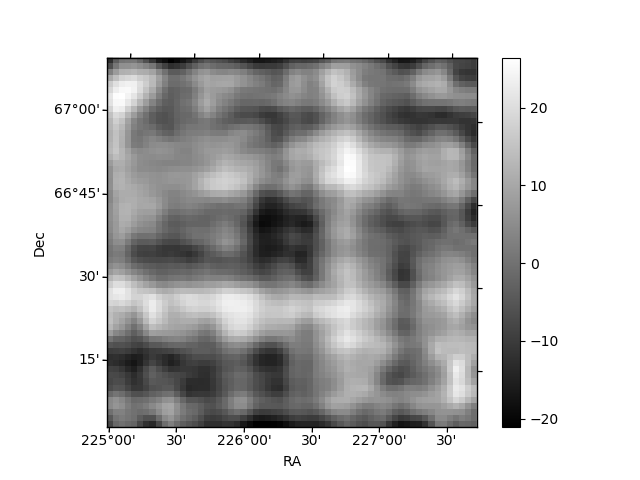
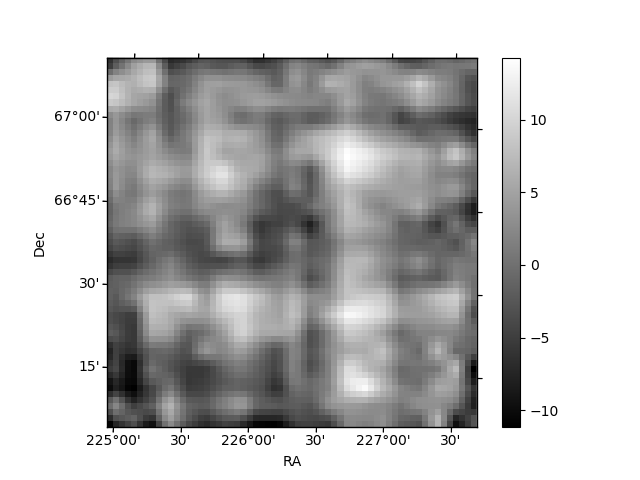
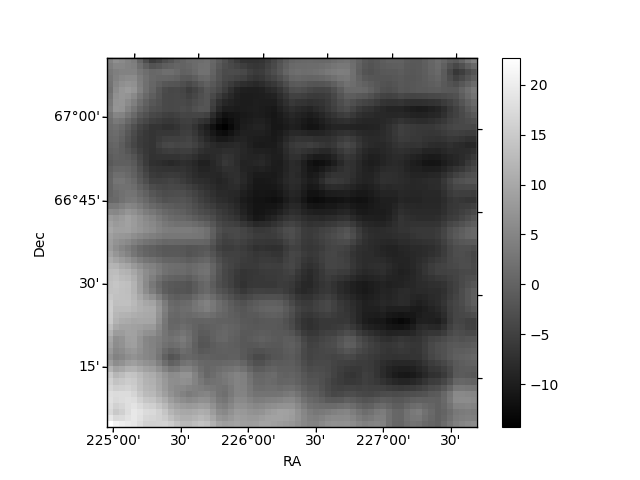
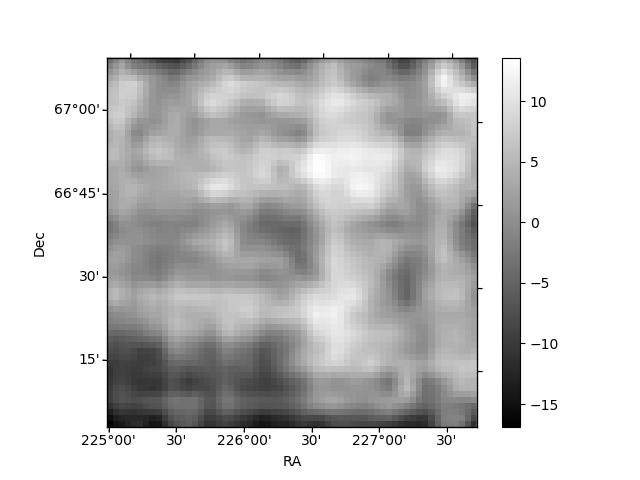
Histogram calculated using DETX and DETY for each event in the final _common_clean file
| Quadrant A | 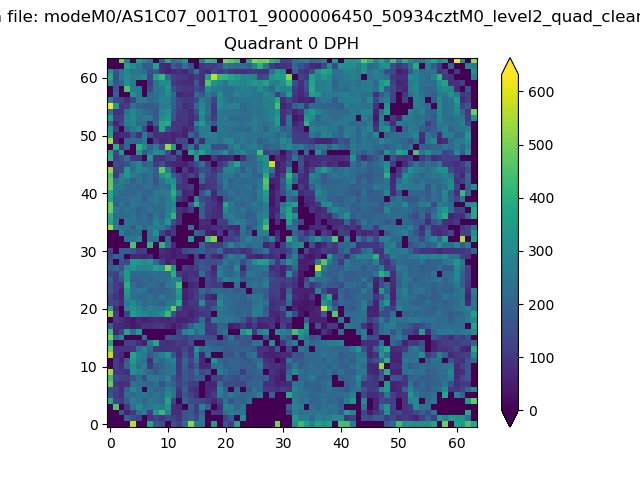 |
 |
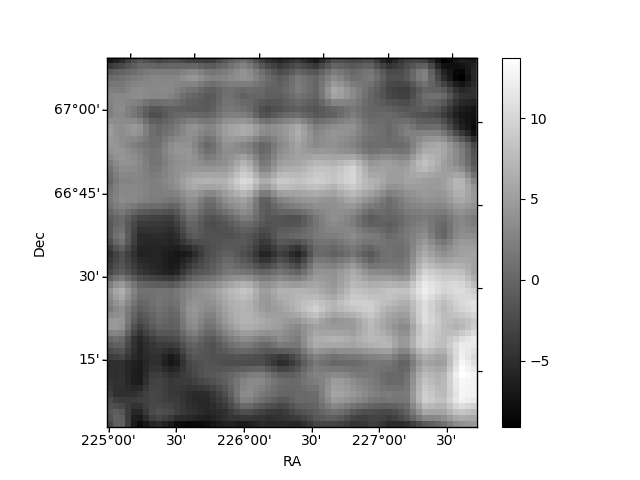
Quadrant B |
|---|---|---|---|
| Quadrant D | 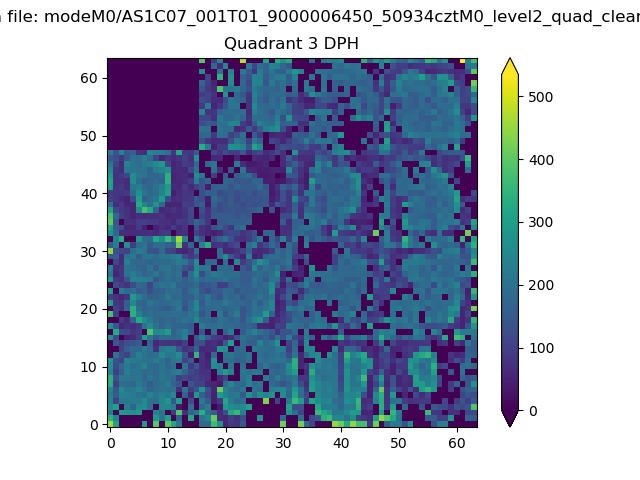 |
 |
Quadrant C |
| Plot type | Count rate plots | Images |
|---|---|---|
| Comparison with Poisson distribution Blue bars denote a histogram of data divided into 1 sec bins. Red curve is a Poisson curve with rate = median count rate of data. |
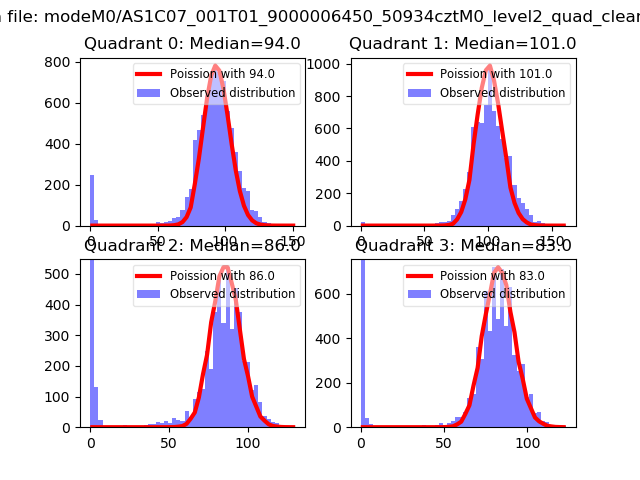 |
 |
| Quadrant-wise count rates Data is divided into 100 sec bins |
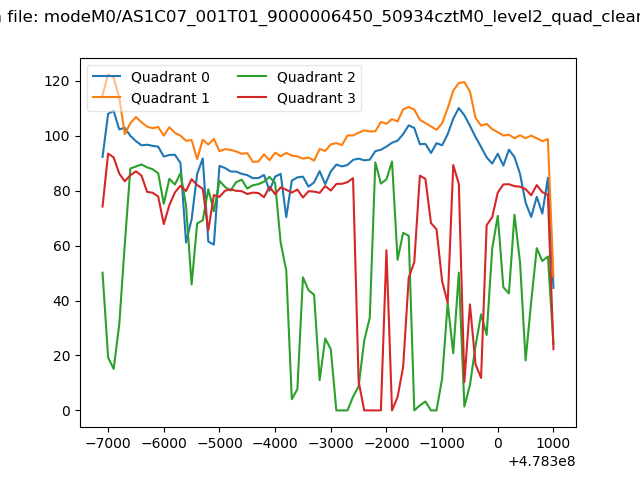 |
|
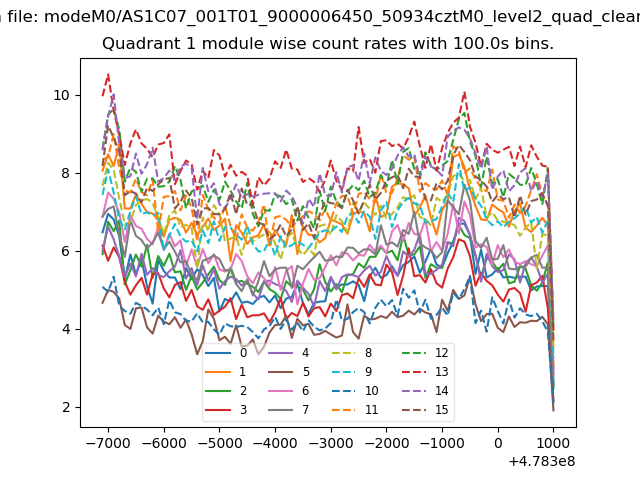
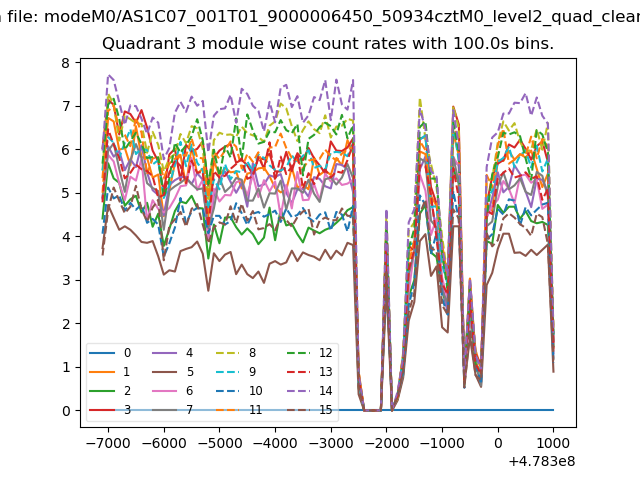
| Module-wise count rates for Quadrant A Data is divided into 100 sec bins |
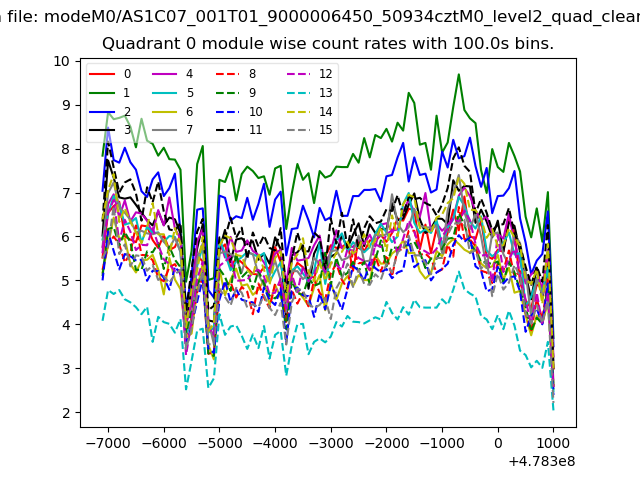 |
 |
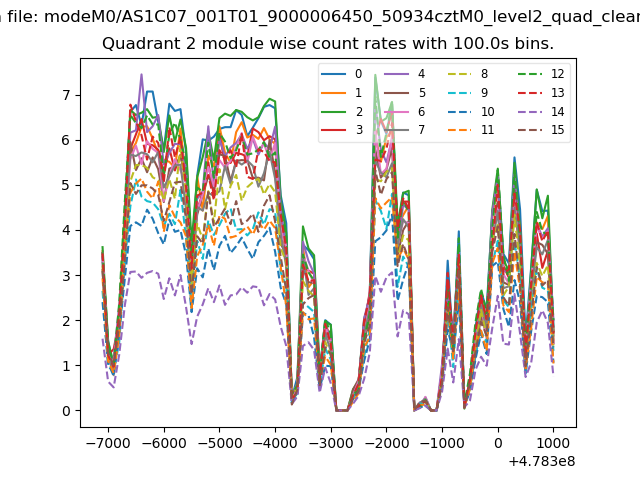
| Module-wise count rates for Quadrant B Data is divided into 100 sec bins |
 |
 |
| Module-wise count rates for Quadrant C Data is divided into 100 sec bins |
 |
 |
| Module-wise count rates for Quadrant D Data is divided into 100 sec bins |
 |
 |
| Parameter | Plot |
|---|---|
| CZT HV Monitor | 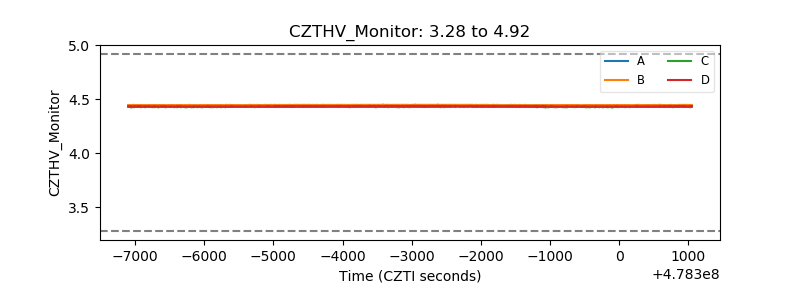 |
| D_VDD | 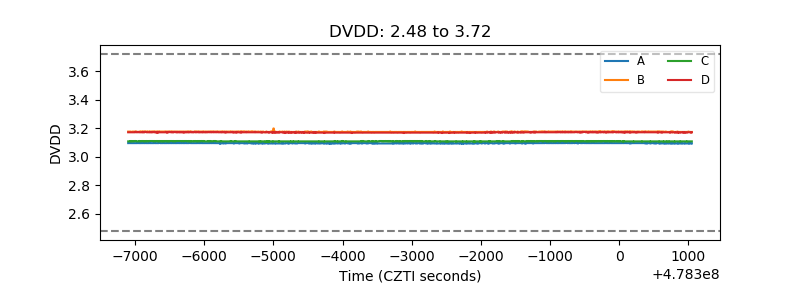 |
| Temperature 1 | 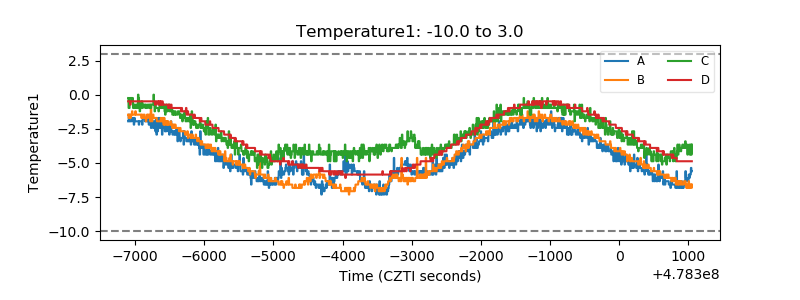 |
| Veto HV Monitor | 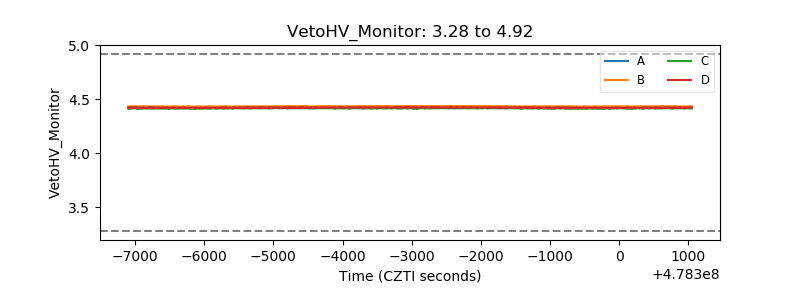 |
| Veto LLD | 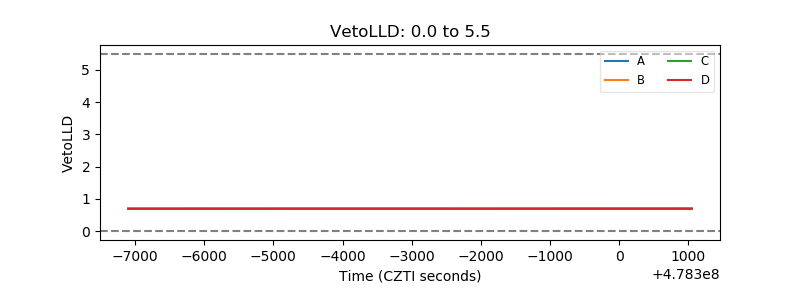 |
| Alpha Counter | 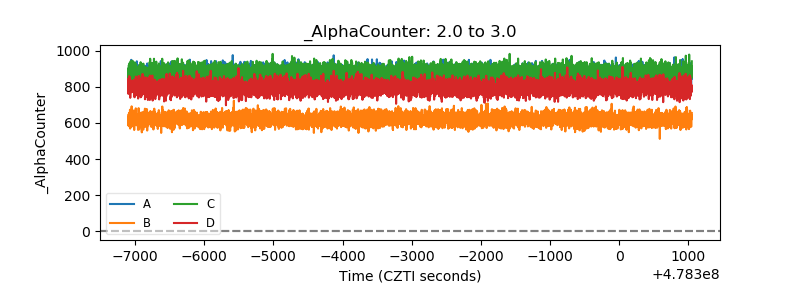 |
| _CPM_Rate | 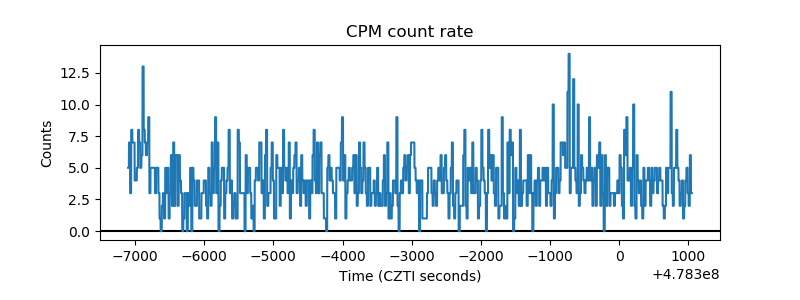 |
| CZT Counter | 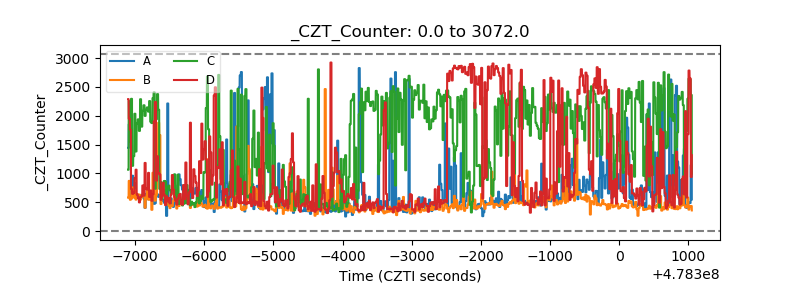 |
| +2.5 Volts monitor |  |
| +5 Volts monitor |  |
| _ROLL_ROT | 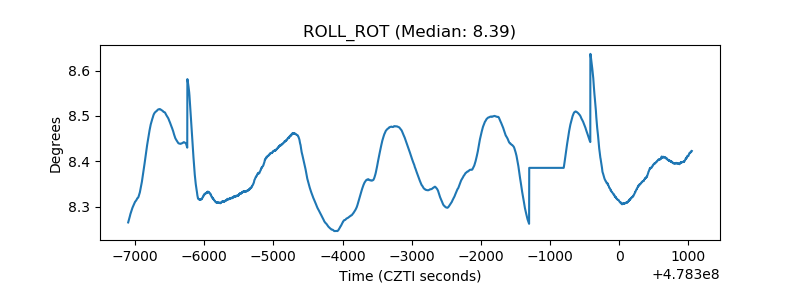 |
| _Roll_DEC | 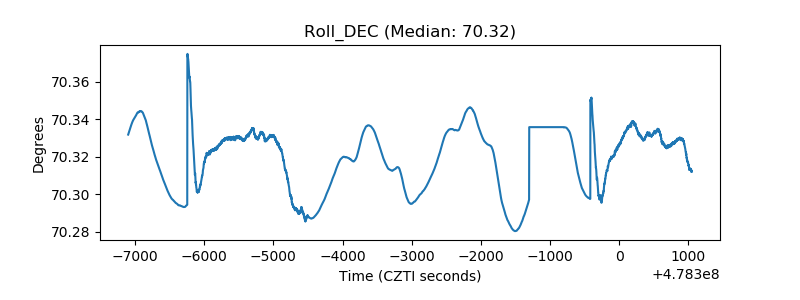 |
| _Roll_RA | 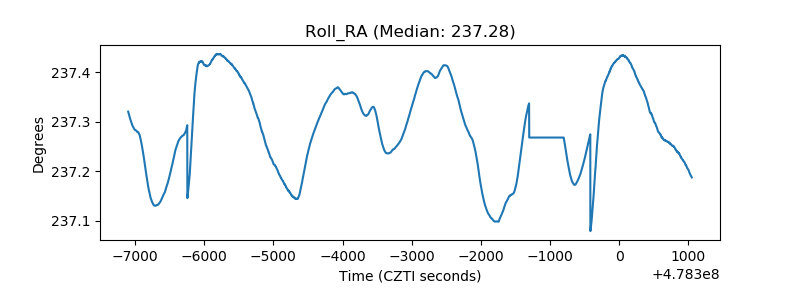 |
| Veto Counter | 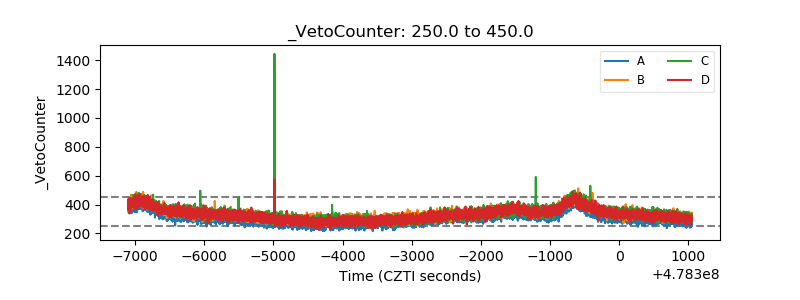 |