| Param | Original file | Final file |
|---|---|---|
| Filename | modeM0/AS1C07_001T01_9000006450_50942cztM0_level2.fits | modeM0/AS1C07_001T01_9000006450_50942cztM0_level2_quad_clean.evt |
| Size (bytes) | 649,278,720 | 83,024,640 |
| Size | 619.2 MB | 79.2 MB |
| Events in quadrant A | 8,507,389 | 462,231 |
| Events in quadrant B | 3,854,272 | 631,857 |
| Events in quadrant C | 5,995,503 | 502,071 |
| Events in quadrant D | 5,205,789 | 493,001 |
| Mode SS | |||
|---|---|---|---|
| Quadrant | BADHDUFLAG | Total packets | Discarded packets |
| A | 0 | 122 | 0 |
| B | 0 | 122 | 0 |
| C | 0 | 122 | 0 |
| D | 0 | 122 | 0 |
| Mode M0 | |||
|---|---|---|---|
| Quadrant | BADHDUFLAG | Total packets | Discarded packets |
| A | 0 | 29472 | 1 |
| B | 0 | 15648 | 2 |
| C | 0 | 21944 | 1 |
| D | 0 | 19584 | 1 |
| Mode M9 | |||
|---|---|---|---|
| Quadrant | BADHDUFLAG | Total packets | Discarded packets |
| A | 0 | 12 | 0 |
| B | 0 | 12 | 0 |
| C | 0 | 12 | 0 |
| D | 0 | 12 | 0 |
| Quadrant | Total seconds | Saturated seconds | Saturation percentage |
|---|---|---|---|
| A | 6086 | 1690 | 27.768649% |
| B | 6085 | 251 | 4.124897% |
| C | 6086 | 909 | 14.935919% |
| D | 6086 | 585 | 9.612225% |
Noise dominated data is calculated using 1-second bins in cleaned event files. If a bin has >2000 counts, and if more than 50% of those come from <1% of pixels, then it is considered to be noise-dominated and hence unusable.
| Quadrant | # 1 sec bins | Bins with >0 counts | Bins with >2000 counts | High rate bins dominated by noise | Noise dominated (total time) | Noise dominated (detector-on time) | Marked lightcurve |
|---|---|---|---|---|---|---|---|
| A | 7226 | 6087 | 1624 | 1624 | 22.47% | 26.68% | 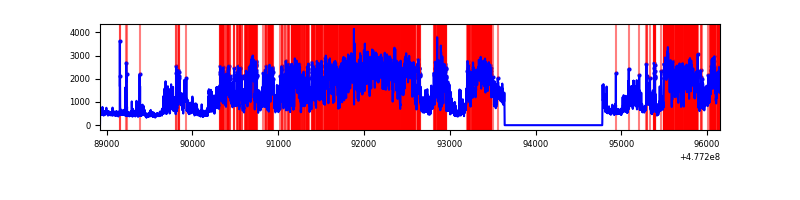 |
| B | 7225 | 6086 | 135 | 135 | 1.87% | 2.22% | 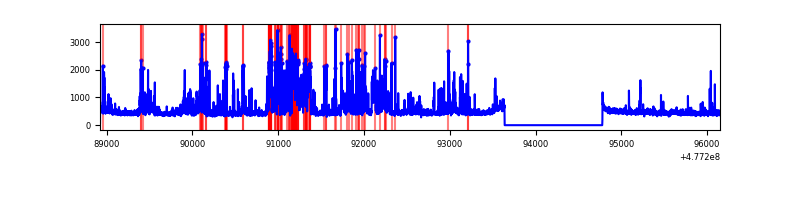 |
| C | 7226 | 6087 | 753 | 753 | 10.42% | 12.37% |  |
| D | 7226 | 6087 | 541 | 541 | 7.49% | 8.89% | 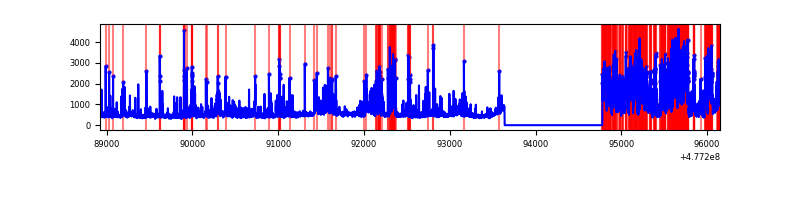 |
Top three noisy pixels from each quadrant. If the there are fewer than three noisy pixels in the level2.evt file, extra rows are filled as -1
| Pixel properties | Quadrant properties | ||||||
|---|---|---|---|---|---|---|---|
| Quadrant | DetID | PixID | Counts | Sigma | Mean | Median | Sigma |
| A | 8 | 43 | 4103686 | 27149.12 | 598 | 583 | 151.1 |
| A | 12 | 3 | 589552 | 3897.05 | 598 | 583 | 151.1 |
| A | 12 | 80 | 449718 | 2971.8 | 598 | 583 | 151.1 |
| B | 4 | 81 | 787135 | 5844.2 | 637 | 616 | 134.6 |
| B | 4 | 171 | 185465 | 1373.51 | 637 | 616 | 134.6 |
| B | 0 | 171 | 122483 | 905.53 | 637 | 616 | 134.6 |
| C | 5 | 10 | 1596020 | 9766.17 | 585 | 579 | 163.4 |
| C | 4 | 12 | 439581 | 2687.26 | 585 | 579 | 163.4 |
| C | 12 | 252 | 374234 | 2287.25 | 585 | 579 | 163.4 |
| D | 8 | 176 | 1720968 | 10027.13 | 602 | 580 | 171.6 |
| D | 7 | 96 | 365347 | 2126.01 | 602 | 580 | 171.6 |
| D | 10 | 181 | 108730 | 630.34 | 602 | 580 | 171.6 |
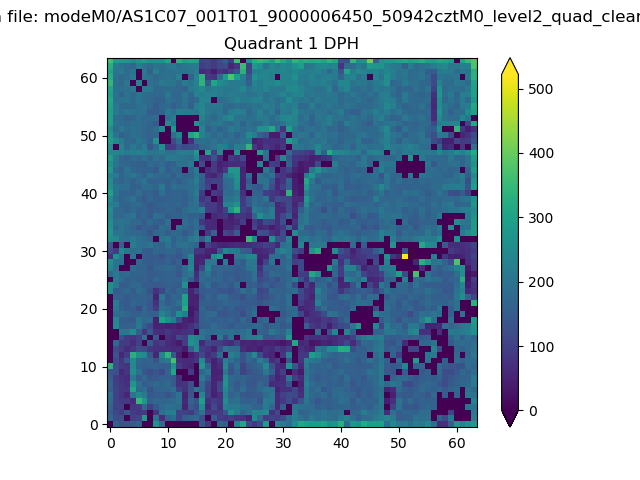
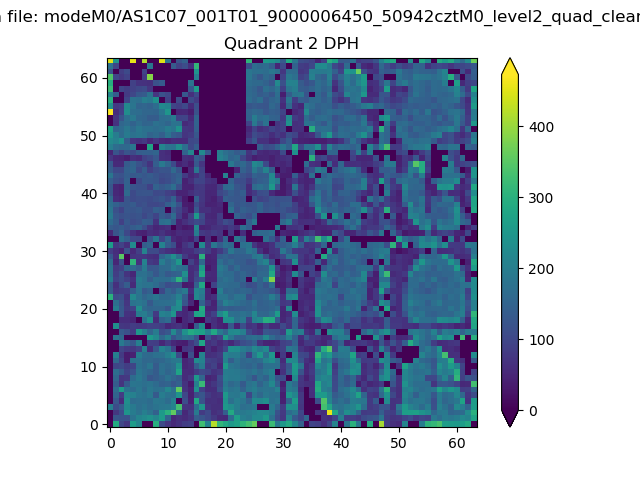
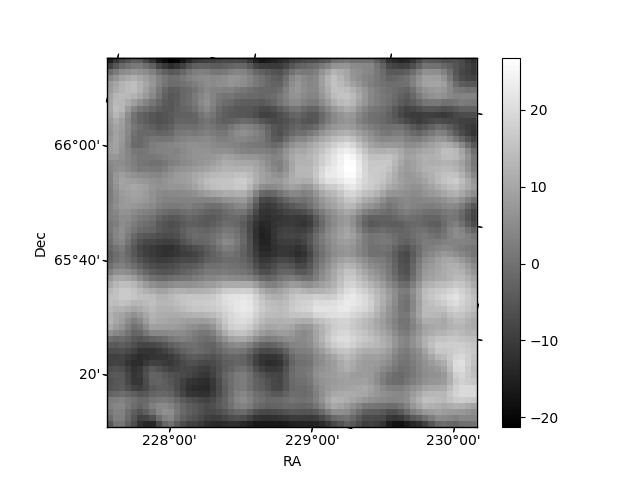
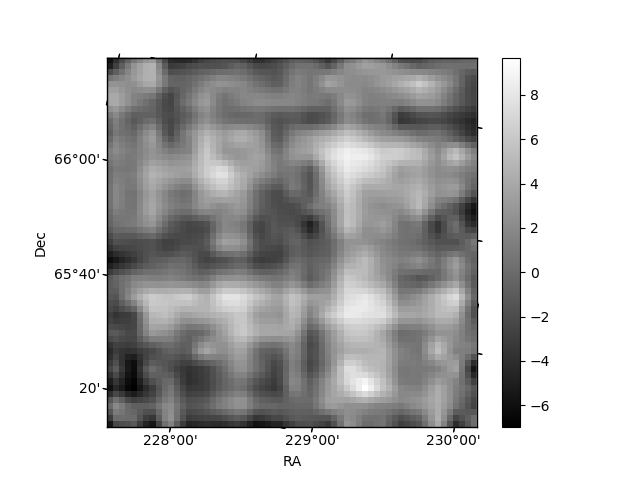
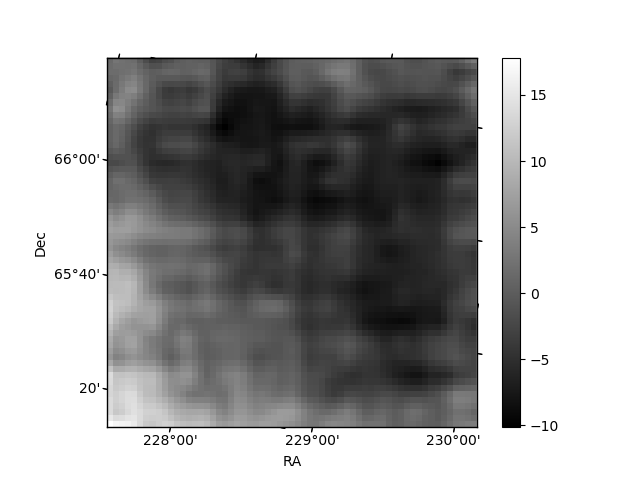
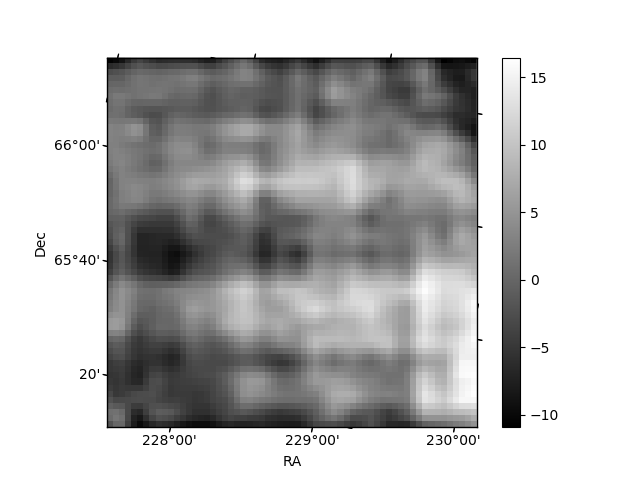
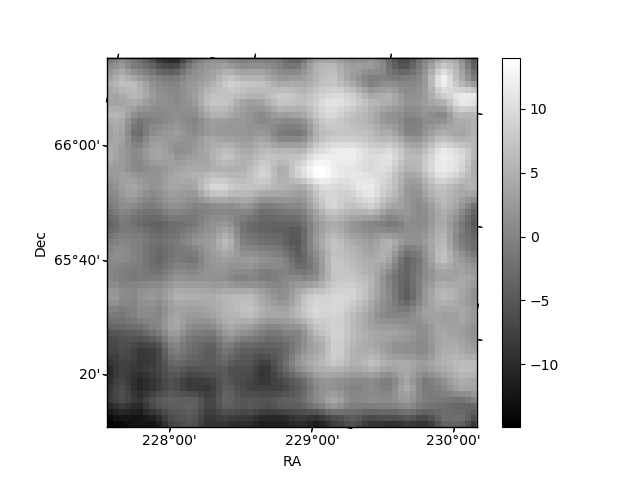
Histogram calculated using DETX and DETY for each event in the final _common_clean file
| Quadrant A | 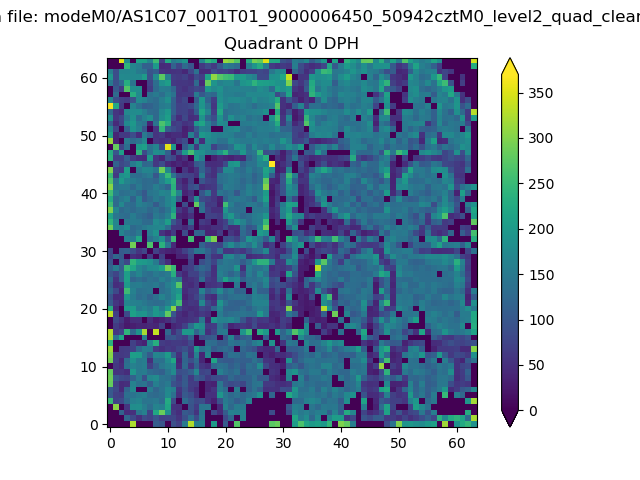 |
 |
Quadrant B |
|---|---|---|---|
| Quadrant D | 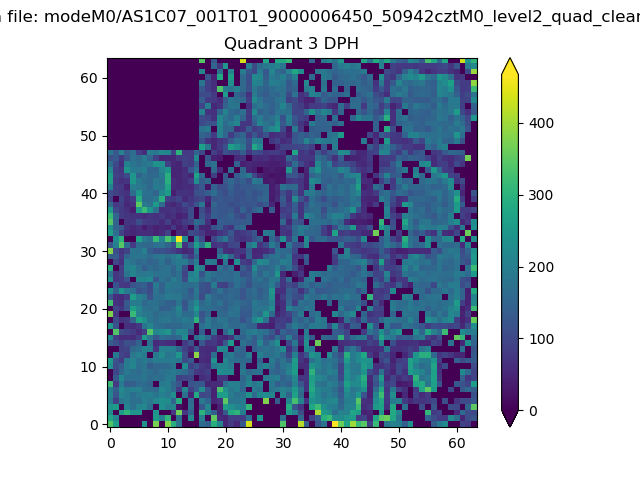 |
 |
Quadrant C |
| Plot type | Count rate plots | Images |
|---|---|---|
| Comparison with Poisson distribution Blue bars denote a histogram of data divided into 1 sec bins. Red curve is a Poisson curve with rate = median count rate of data. |
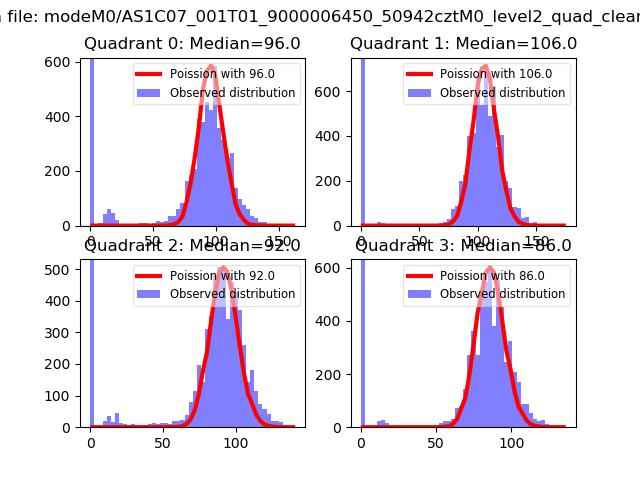 |
 |
| Quadrant-wise count rates Data is divided into 100 sec bins |
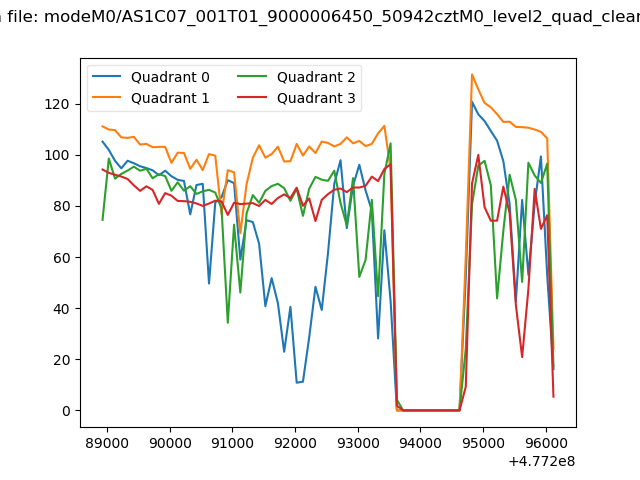 |
|
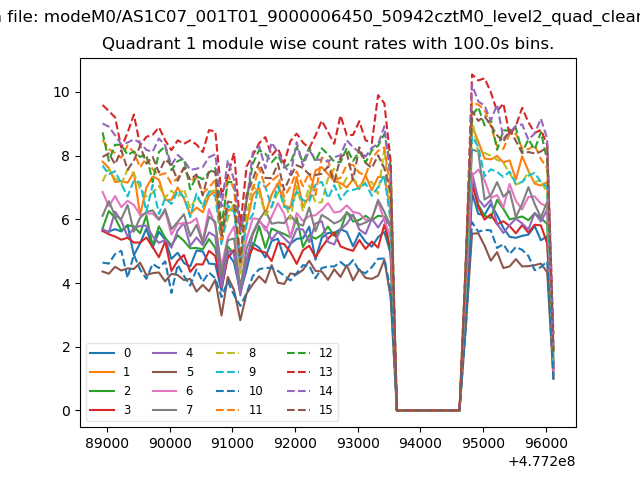
| Module-wise count rates for Quadrant A Data is divided into 100 sec bins |
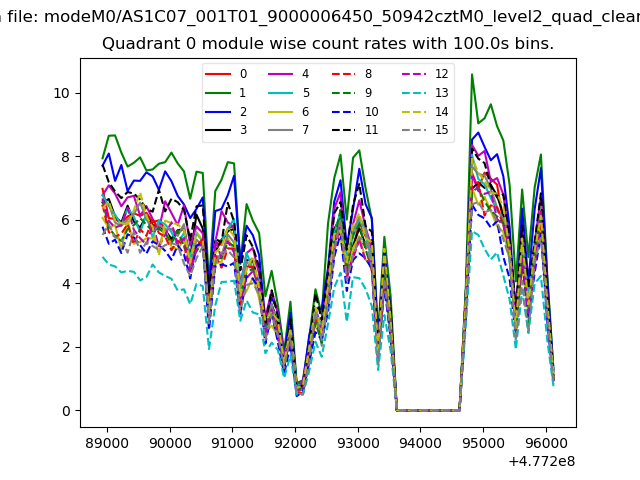 |
 |
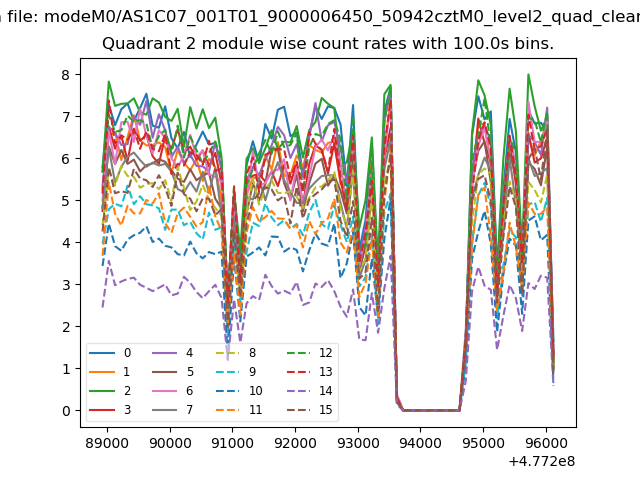
| Module-wise count rates for Quadrant B Data is divided into 100 sec bins |
 |
 |
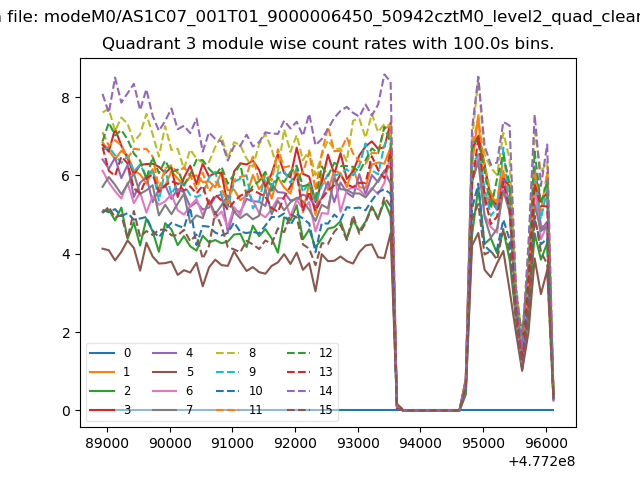
| Module-wise count rates for Quadrant C Data is divided into 100 sec bins |
 |
 |
| Module-wise count rates for Quadrant D Data is divided into 100 sec bins |
 |
 |
| Parameter | Plot |
|---|---|
| CZT HV Monitor | 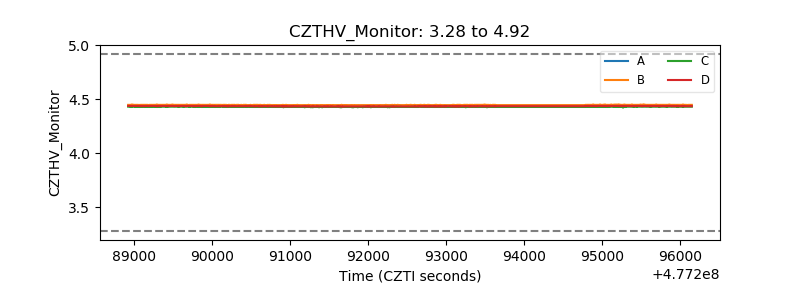 |
| D_VDD | 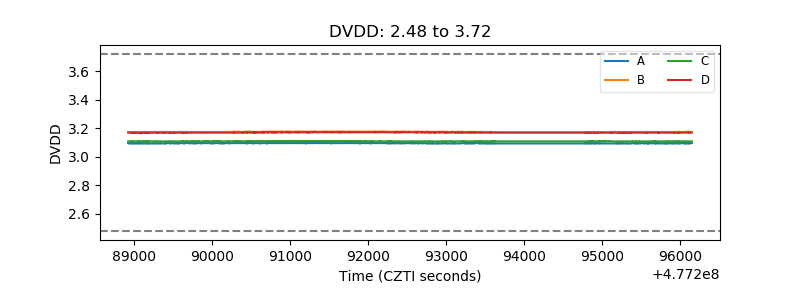 |
| Temperature 1 | 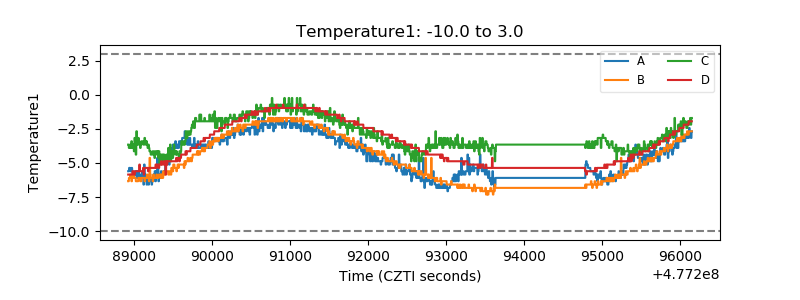 |
| Veto HV Monitor | 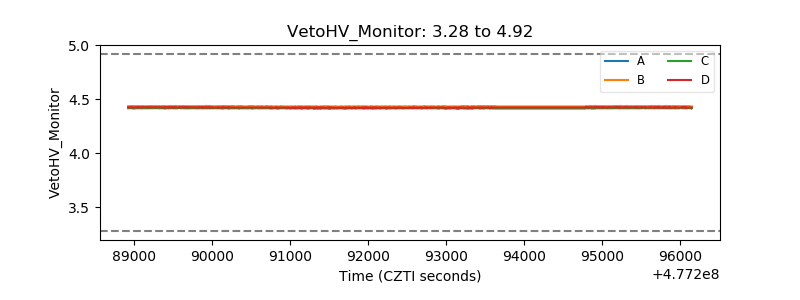 |
| Veto LLD | 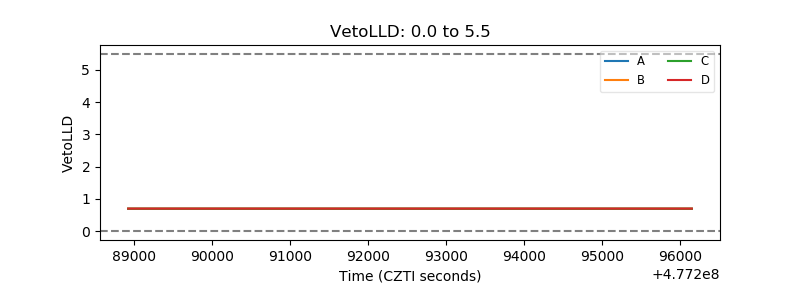 |
| Alpha Counter | 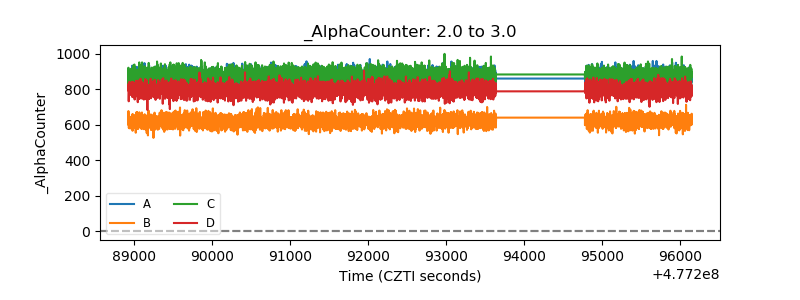 |
| _CPM_Rate | 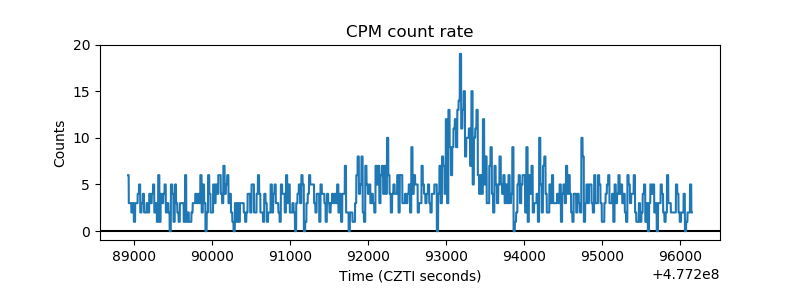 |
| CZT Counter | 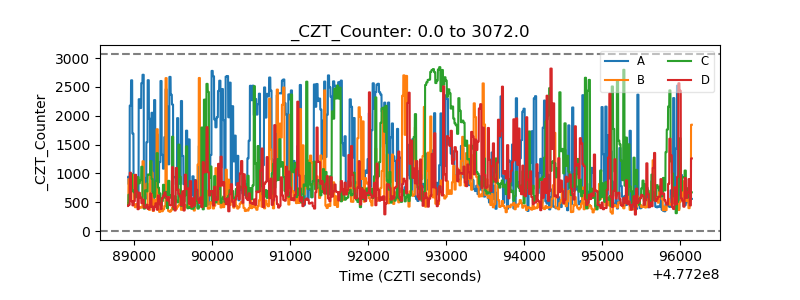 |
| +2.5 Volts monitor | 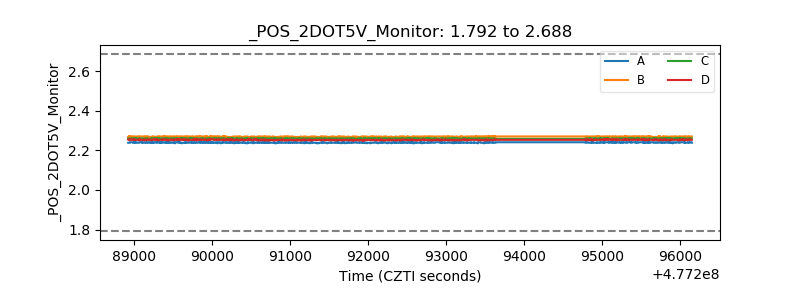 |
| +5 Volts monitor |  |
| _ROLL_ROT | 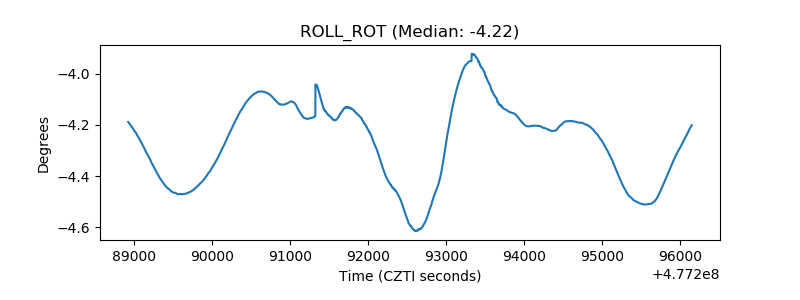 |
| _Roll_DEC | 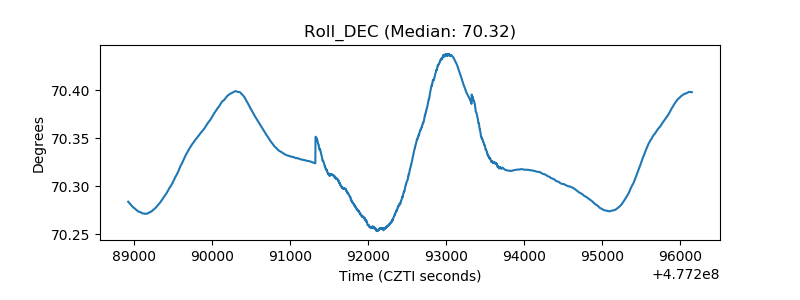 |
| _Roll_RA | 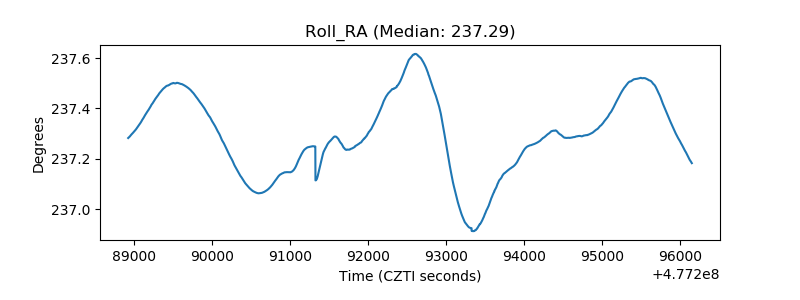 |
| Veto Counter | 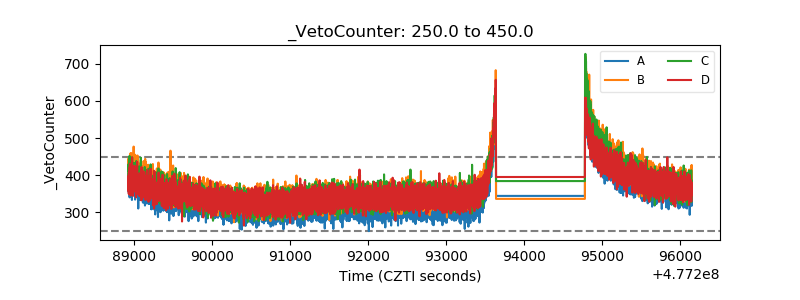 |