| Param | Original file | Final file |
|---|---|---|
| Filename | modeM0/AS1C07_001T01_9000006450_50943cztM0_level2.fits | modeM0/AS1C07_001T01_9000006450_50943cztM0_level2_quad_clean.evt |
| Size (bytes) | 764,288,640 | 73,229,760 |
| Size | 728.9 MB | 69.8 MB |
| Events in quadrant A | 10,891,861 | 300,337 |
| Events in quadrant B | 3,616,311 | 602,386 |
| Events in quadrant C | 6,590,049 | 460,485 |
| Events in quadrant D | 6,742,793 | 446,810 |
| Mode SS | |||
|---|---|---|---|
| Quadrant | BADHDUFLAG | Total packets | Discarded packets |
| A | 0 | 118 | 0 |
| B | 0 | 118 | 0 |
| C | 0 | 118 | 0 |
| D | 0 | 118 | 0 |
| Mode M0 | |||
|---|---|---|---|
| Quadrant | BADHDUFLAG | Total packets | Discarded packets |
| A | 0 | 36478 | 1 |
| B | 0 | 14820 | 1 |
| C | 0 | 23584 | 6 |
| D | 0 | 24046 | 1 |
| Mode M9 | |||
|---|---|---|---|
| Quadrant | BADHDUFLAG | Total packets | Discarded packets |
| A | 0 | 11 | 0 |
| B | 0 | 11 | 0 |
| C | 0 | 11 | 0 |
| D | 0 | 11 | 0 |
| Quadrant | Total seconds | Saturated seconds | Saturation percentage |
|---|---|---|---|
| A | 5824 | 3110 | 53.399725% |
| B | 5825 | 333 | 5.716738% |
| C | 5824 | 1203 | 20.655907% |
| D | 5824 | 1018 | 17.479396% |
Noise dominated data is calculated using 1-second bins in cleaned event files. If a bin has >2000 counts, and if more than 50% of those come from <1% of pixels, then it is considered to be noise-dominated and hence unusable.
| Quadrant | # 1 sec bins | Bins with >0 counts | Bins with >2000 counts | High rate bins dominated by noise | Noise dominated (total time) | Noise dominated (detector-on time) | Marked lightcurve |
|---|---|---|---|---|---|---|---|
| A | 6934 | 5825 | 2925 | 2925 | 42.18% | 50.21% | 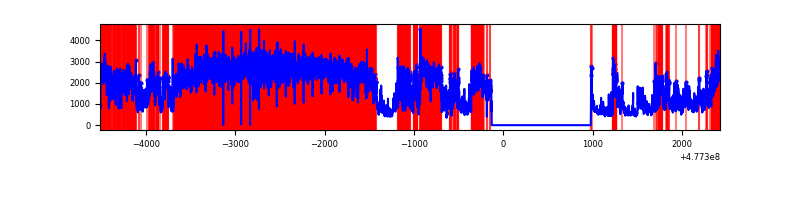 |
| B | 6935 | 5826 | 117 | 117 | 1.69% | 2.01% | 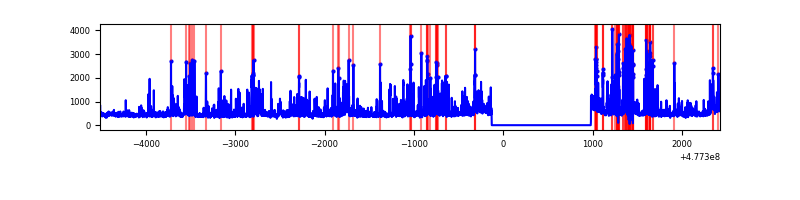 |
| C | 6934 | 5825 | 960 | 960 | 13.84% | 16.48% | 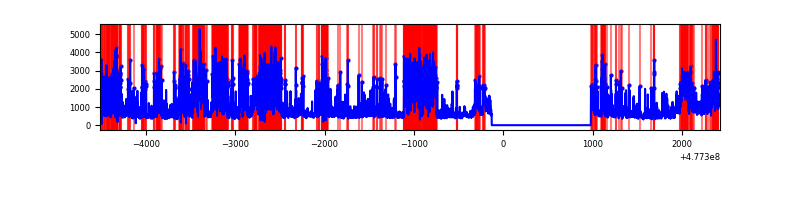 |
| D | 6934 | 5825 | 889 | 889 | 12.82% | 15.26% | 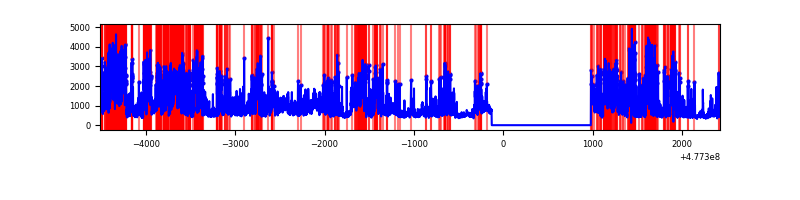 |
Top three noisy pixels from each quadrant. If the there are fewer than three noisy pixels in the level2.evt file, extra rows are filled as -1
| Pixel properties | Quadrant properties | ||||||
|---|---|---|---|---|---|---|---|
| Quadrant | DetID | PixID | Counts | Sigma | Mean | Median | Sigma |
| A | 8 | 43 | 6899704 | 60878.98 | 456 | 445 | 113.3 |
| A | 12 | 80 | 817715 | 7211.58 | 456 | 445 | 113.3 |
| A | 12 | 3 | 735730 | 6488.15 | 456 | 445 | 113.3 |
| B | 4 | 206 | 412972 | 3173.1 | 612 | 591 | 130.0 |
| B | 10 | 247 | 246920 | 1895.4 | 612 | 591 | 130.0 |
| B | 4 | 171 | 169976 | 1303.35 | 612 | 591 | 130.0 |
| C | 5 | 10 | 2319019 | 14635.58 | 562 | 555 | 158.4 |
| C | 4 | 12 | 920060 | 5804.48 | 562 | 555 | 158.4 |
| C | 14 | 245 | 340568 | 2146.37 | 562 | 555 | 158.4 |
| D | 8 | 176 | 3877633 | 24039.9 | 570 | 549 | 161.3 |
| D | 2 | 249 | 126317 | 779.83 | 570 | 549 | 161.3 |
| D | 3 | 12 | 73793 | 454.15 | 570 | 549 | 161.3 |
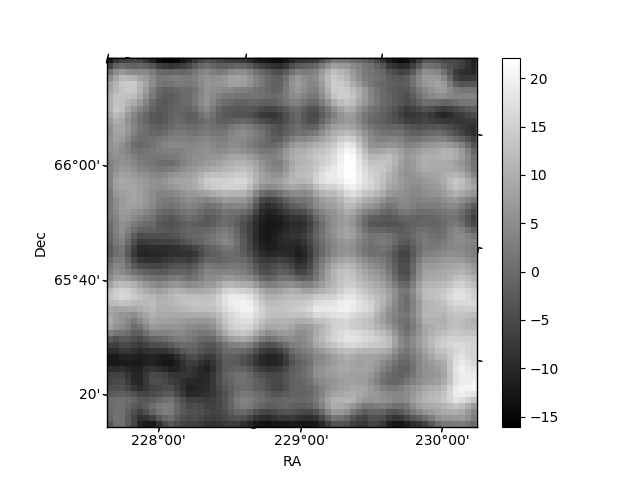
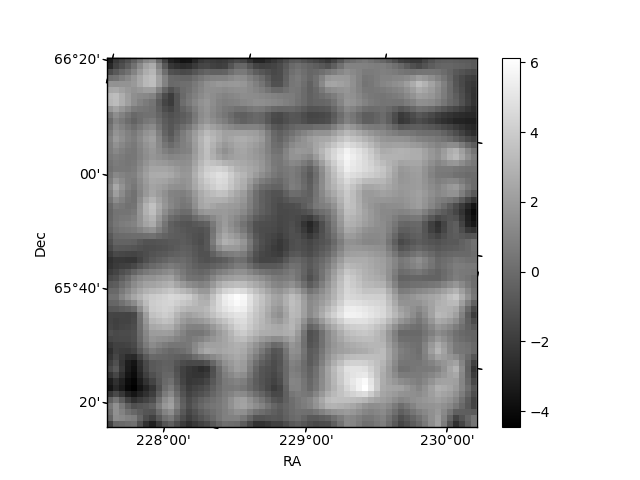
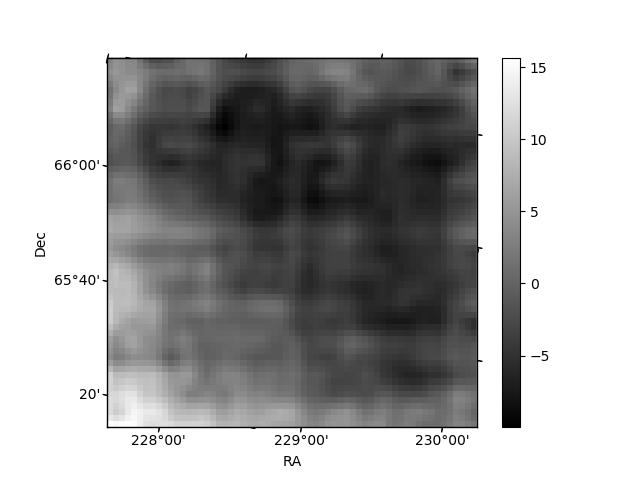
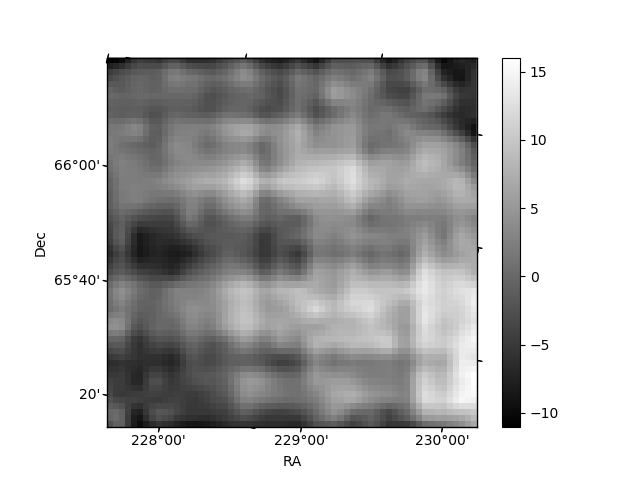
Histogram calculated using DETX and DETY for each event in the final _common_clean file
| Quadrant A | 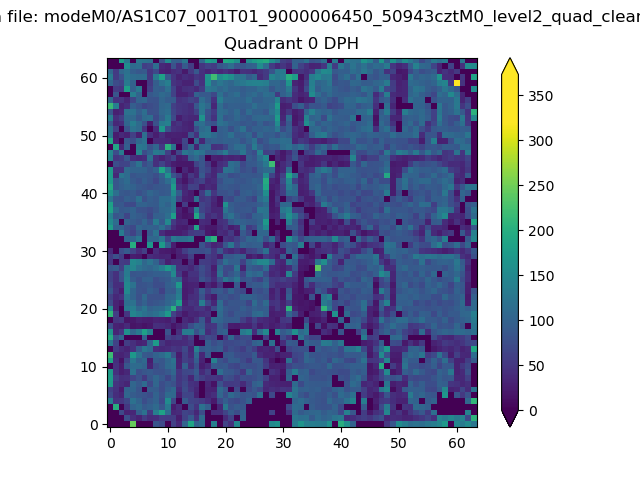 |
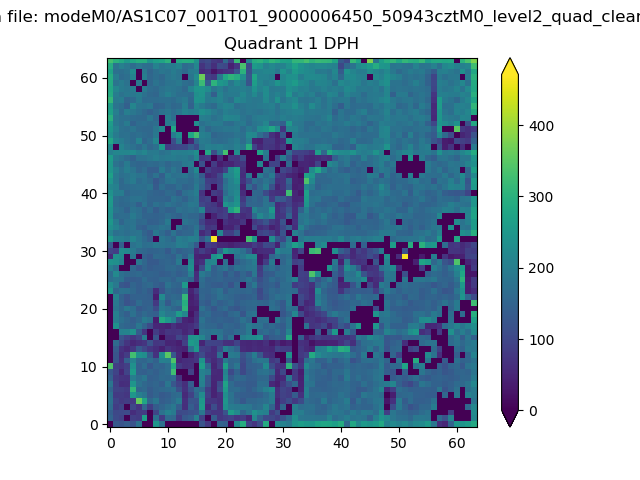 |
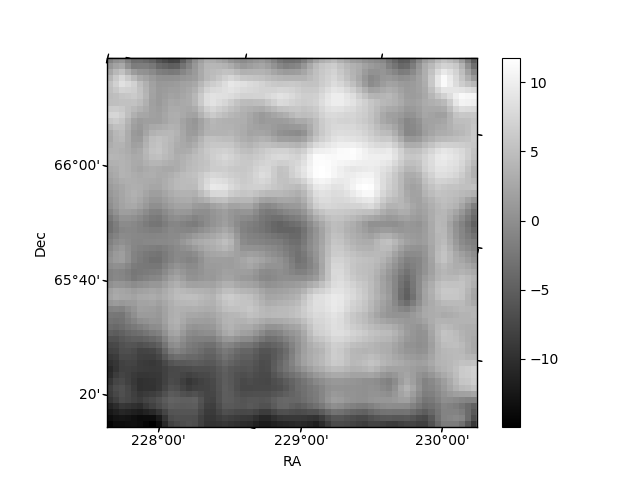
Quadrant B |
|---|---|---|---|
| Quadrant D | 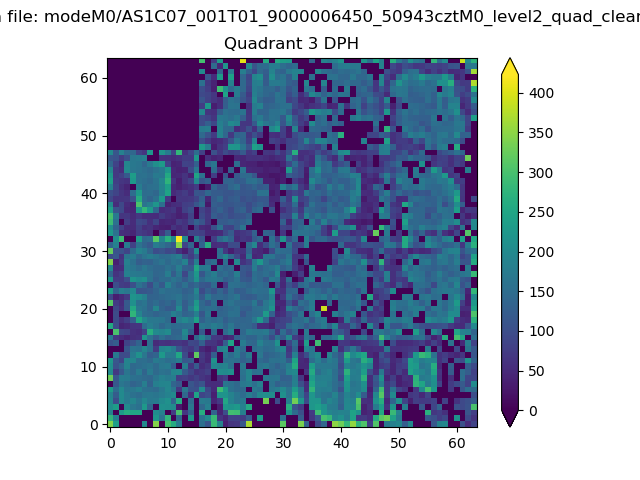 |
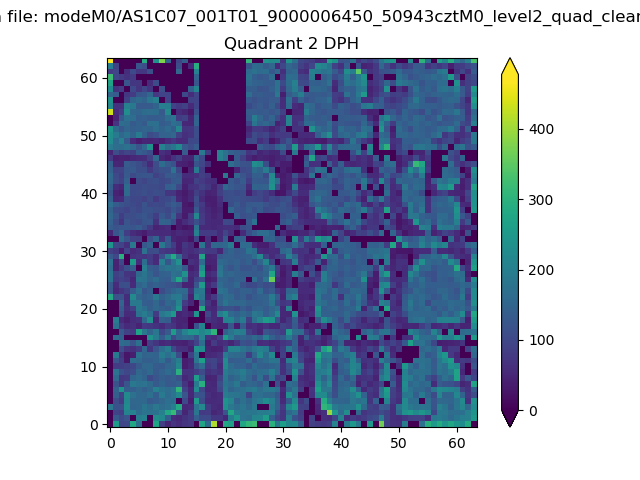 |
Quadrant C |
| Plot type | Count rate plots | Images |
|---|---|---|
| Comparison with Poisson distribution Blue bars denote a histogram of data divided into 1 sec bins. Red curve is a Poisson curve with rate = median count rate of data. |
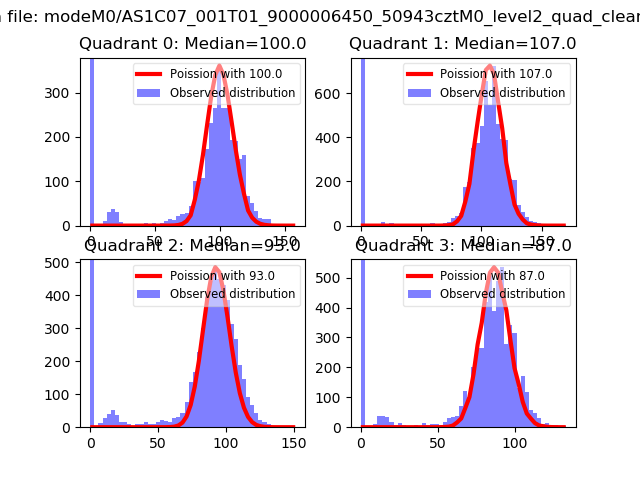 |
 |
| Quadrant-wise count rates Data is divided into 100 sec bins |
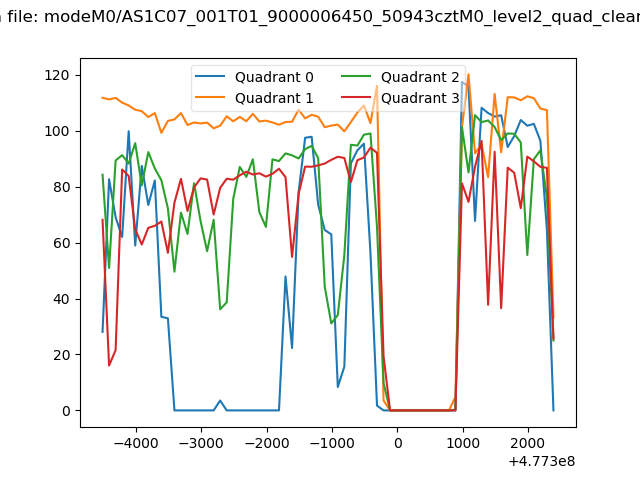 |
|
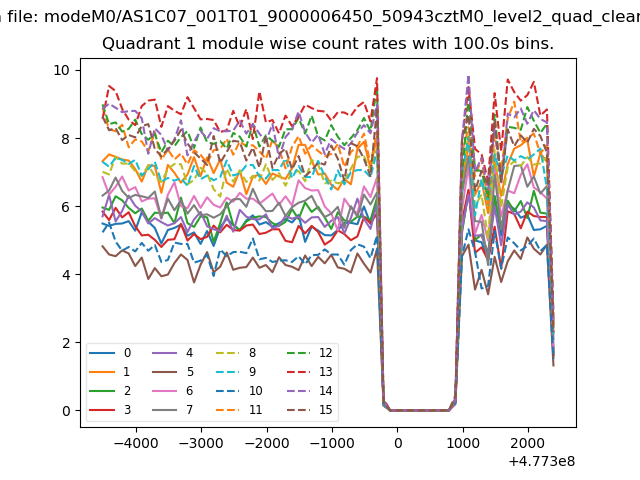
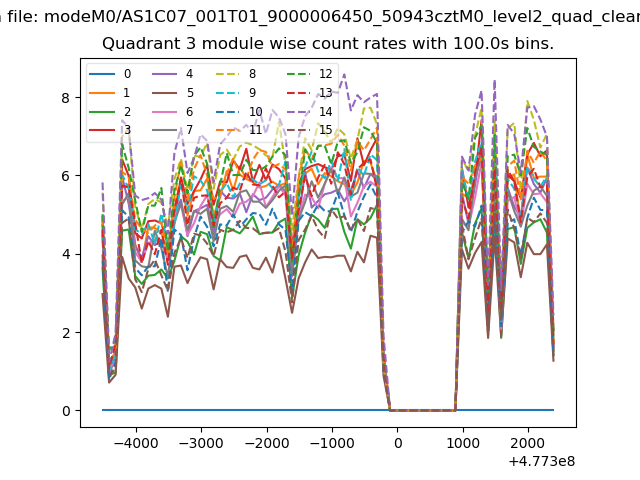
| Module-wise count rates for Quadrant A Data is divided into 100 sec bins |
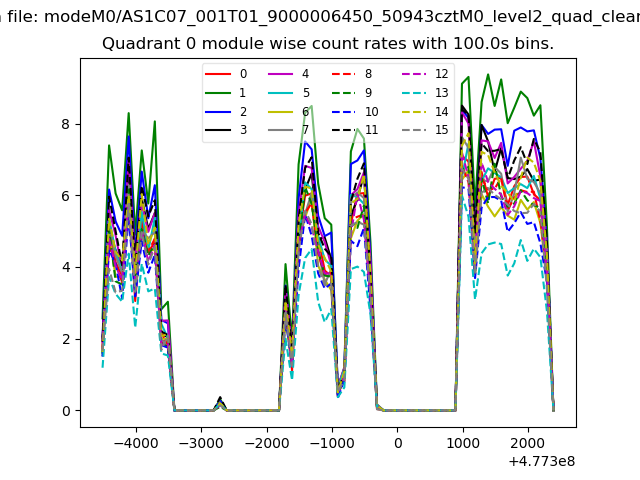 |
 |
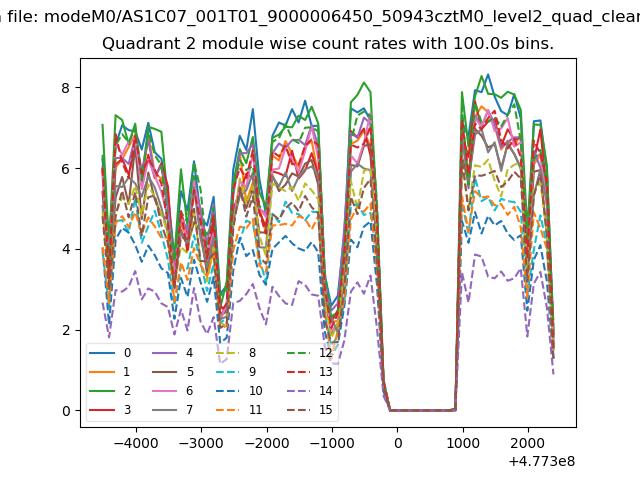
| Module-wise count rates for Quadrant B Data is divided into 100 sec bins |
 |
 |
| Module-wise count rates for Quadrant C Data is divided into 100 sec bins |
 |
 |
| Module-wise count rates for Quadrant D Data is divided into 100 sec bins |
 |
 |
| Parameter | Plot |
|---|---|
| CZT HV Monitor |  |
| D_VDD | 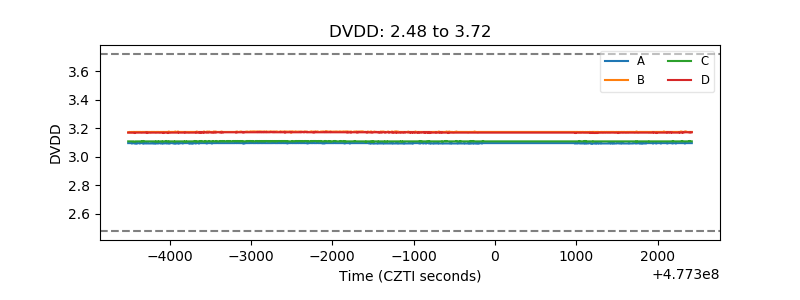 |
| Temperature 1 | 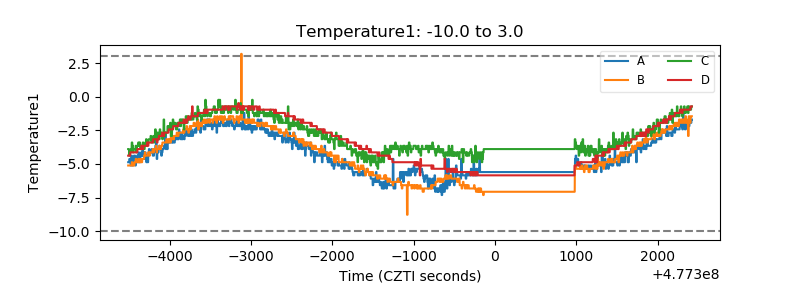 |
| Veto HV Monitor | 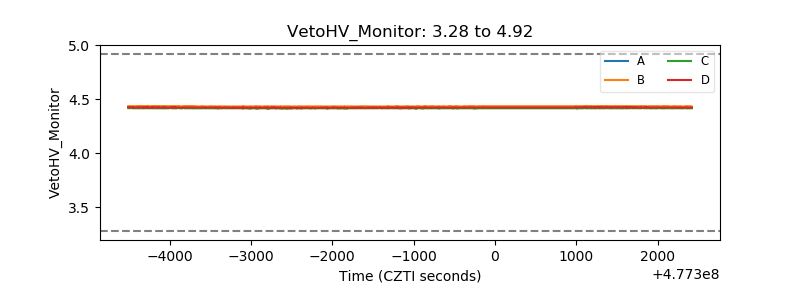 |
| Veto LLD | 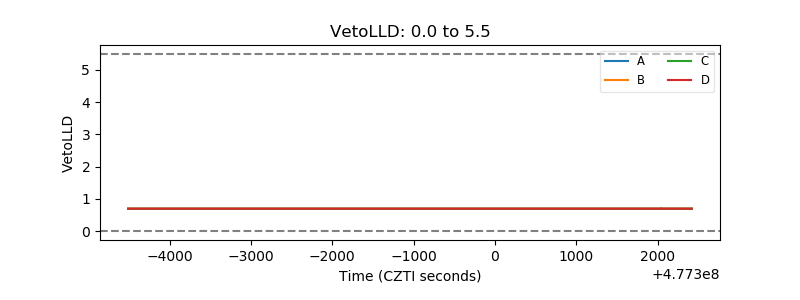 |
| Alpha Counter | 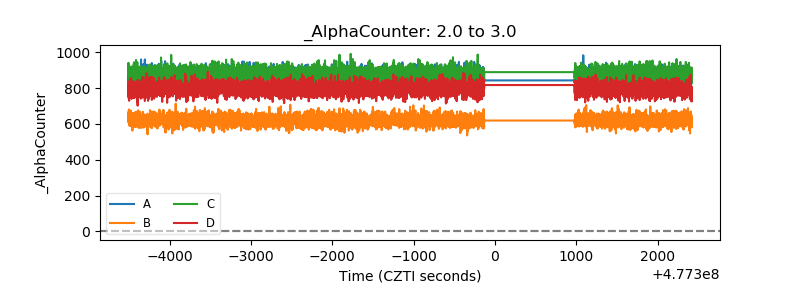 |
| _CPM_Rate | 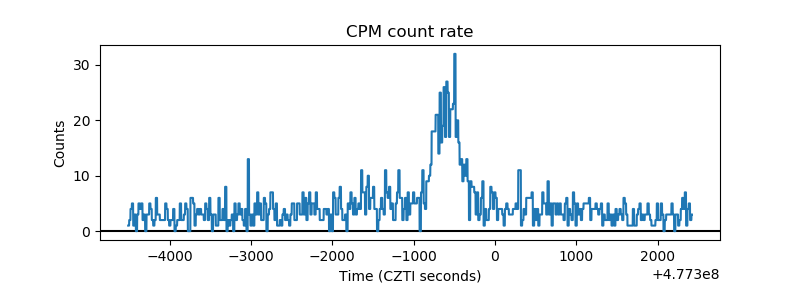 |
| CZT Counter | 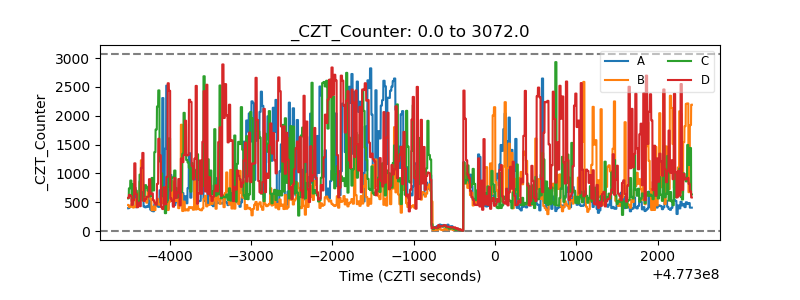 |
| +2.5 Volts monitor | 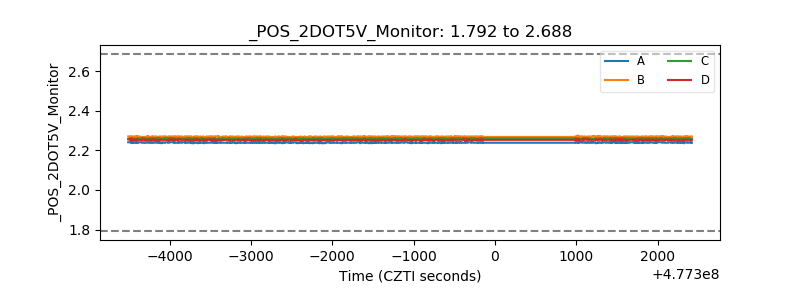 |
| +5 Volts monitor | 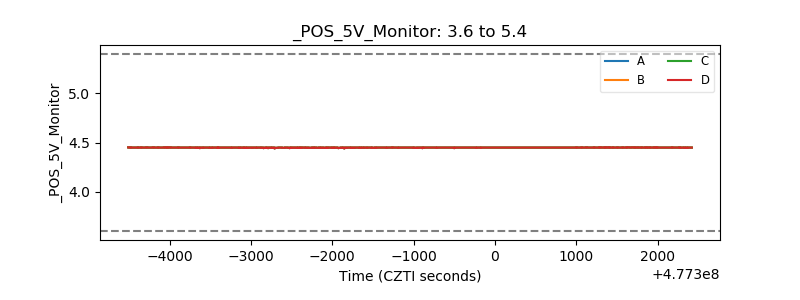 |
| _ROLL_ROT | 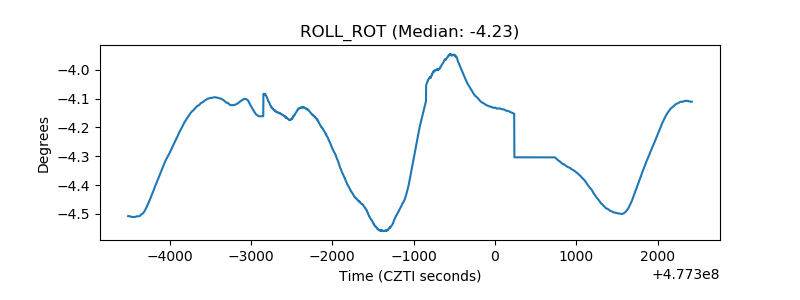 |
| _Roll_DEC | 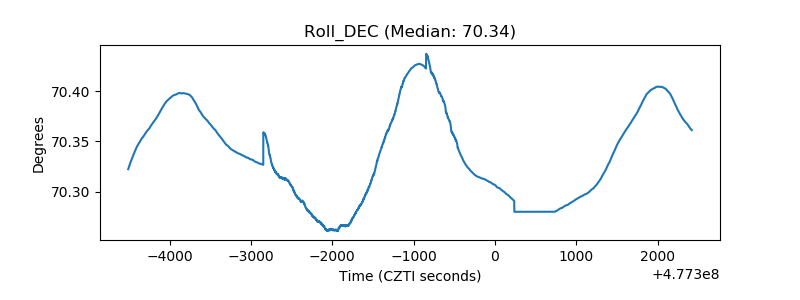 |
| _Roll_RA | 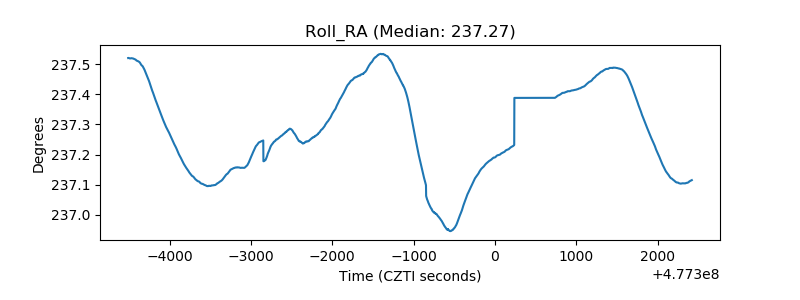 |
| Veto Counter | 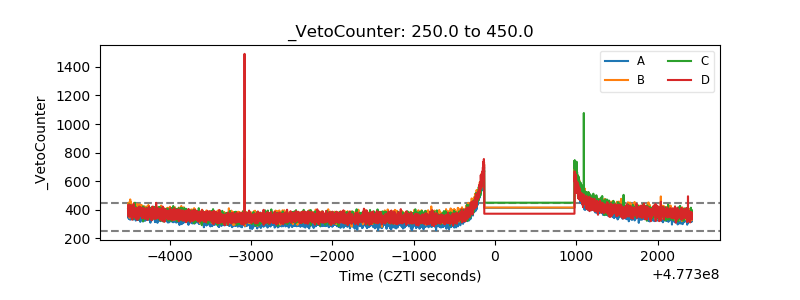 |