| Param | Original file | Final file |
|---|---|---|
| Filename | modeM0/AS1C07_001T01_9000006450_50944cztM0_level2.fits | modeM0/AS1C07_001T01_9000006450_50944cztM0_level2_quad_clean.evt |
| Size (bytes) | 843,235,200 | 73,356,480 |
| Size | 804.2 MB | 70.0 MB |
| Events in quadrant A | 11,531,094 | 289,776 |
| Events in quadrant B | 6,646,501 | 545,741 |
| Events in quadrant C | 7,320,717 | 468,918 |
| Events in quadrant D | 5,241,586 | 488,357 |
| Mode SS | |||
|---|---|---|---|
| Quadrant | BADHDUFLAG | Total packets | Discarded packets |
| A | 0 | 124 | 0 |
| B | 0 | 124 | 0 |
| C | 0 | 124 | 0 |
| D | 0 | 124 | 0 |
| Mode M0 | |||
|---|---|---|---|
| Quadrant | BADHDUFLAG | Total packets | Discarded packets |
| A | 0 | 38564 | 1 |
| B | 0 | 23991 | 1 |
| C | 0 | 26063 | 1 |
| D | 0 | 19744 | 1 |
| Mode M9 | |||
|---|---|---|---|
| Quadrant | BADHDUFLAG | Total packets | Discarded packets |
| A | 0 | 11 | 0 |
| B | 0 | 11 | 0 |
| C | 0 | 11 | 0 |
| D | 0 | 11 | 0 |
| Quadrant | Total seconds | Saturated seconds | Saturation percentage |
|---|---|---|---|
| A | 6130 | 3488 | 56.900489% |
| B | 6130 | 1285 | 20.962480% |
| C | 6131 | 1284 | 20.942750% |
| D | 6131 | 710 | 11.580493% |
Noise dominated data is calculated using 1-second bins in cleaned event files. If a bin has >2000 counts, and if more than 50% of those come from <1% of pixels, then it is considered to be noise-dominated and hence unusable.
| Quadrant | # 1 sec bins | Bins with >0 counts | Bins with >2000 counts | High rate bins dominated by noise | Noise dominated (total time) | Noise dominated (detector-on time) | Marked lightcurve |
|---|---|---|---|---|---|---|---|
| A | 7165 | 6131 | 3157 | 3157 | 44.06% | 51.49% | 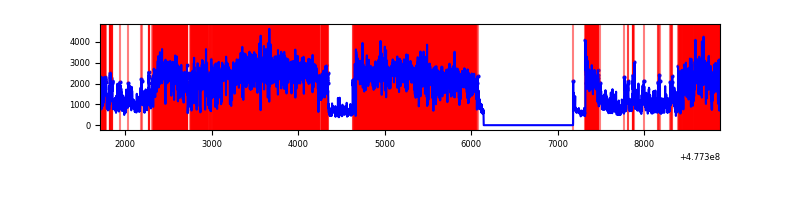 |
| B | 7165 | 6131 | 925 | 925 | 12.91% | 15.09% | 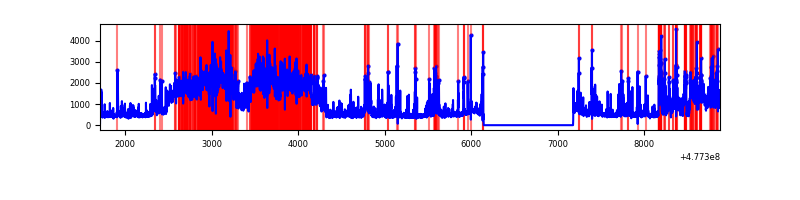 |
| C | 7166 | 6132 | 978 | 978 | 13.65% | 15.95% | 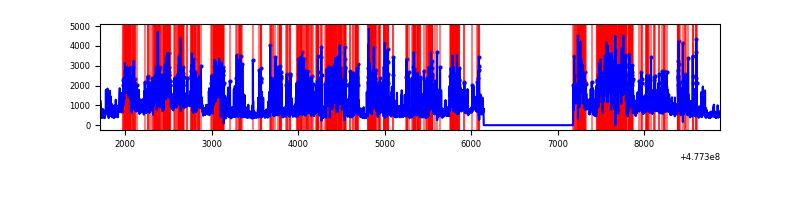 |
| D | 7166 | 6132 | 519 | 519 | 7.24% | 8.46% | 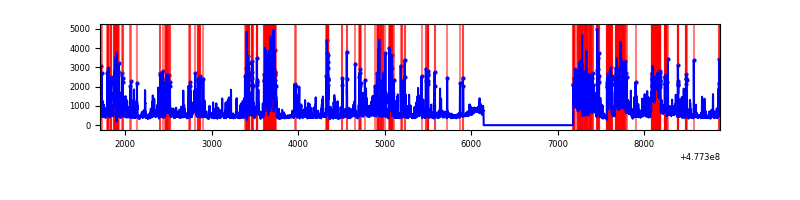 |
Top three noisy pixels from each quadrant. If the there are fewer than three noisy pixels in the level2.evt file, extra rows are filled as -1
| Pixel properties | Quadrant properties | ||||||
|---|---|---|---|---|---|---|---|
| Quadrant | DetID | PixID | Counts | Sigma | Mean | Median | Sigma |
| A | 8 | 43 | 8253014 | 65131.28 | 503 | 489 | 126.7 |
| A | 12 | 3 | 351832 | 2772.9 | 503 | 489 | 126.7 |
| A | 9 | 13 | 192044 | 1511.81 | 503 | 489 | 126.7 |
| B | 4 | 81 | 2563874 | 19473.61 | 623 | 601 | 131.6 |
| B | 4 | 206 | 1058568 | 8037.55 | 623 | 601 | 131.6 |
| B | 4 | 171 | 214704 | 1626.58 | 623 | 601 | 131.6 |
| C | 5 | 10 | 1571458 | 9544.3 | 595 | 589 | 164.6 |
| C | 12 | 252 | 898301 | 5454.32 | 595 | 589 | 164.6 |
| C | 14 | 245 | 631323 | 3832.22 | 595 | 589 | 164.6 |
| D | 8 | 176 | 1255996 | 7223.98 | 618 | 594 | 173.8 |
| D | 3 | 12 | 504446 | 2899.32 | 618 | 594 | 173.8 |
| D | 2 | 62 | 398102 | 2287.39 | 618 | 594 | 173.8 |
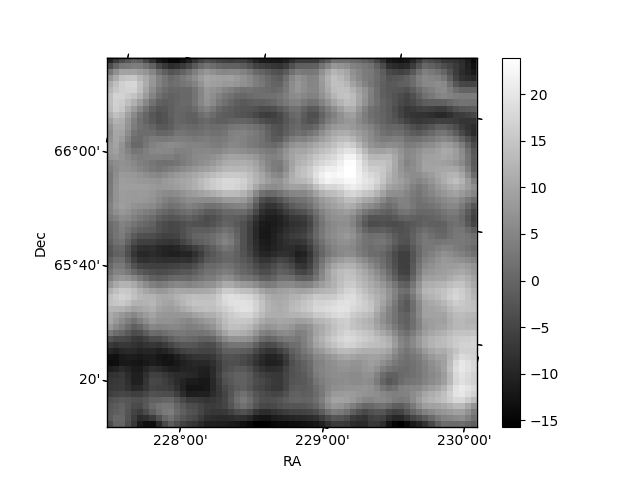
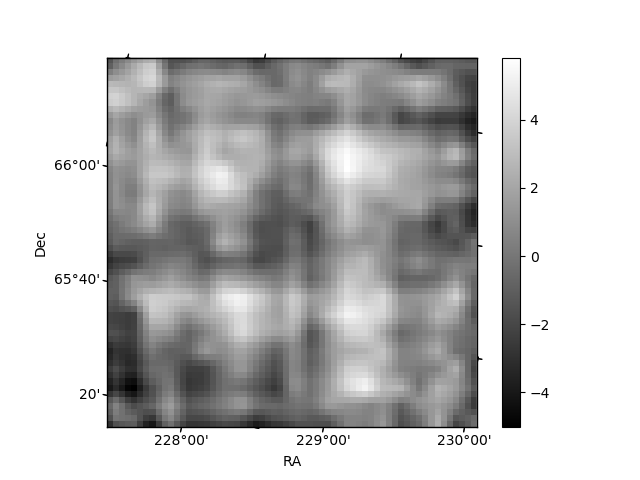
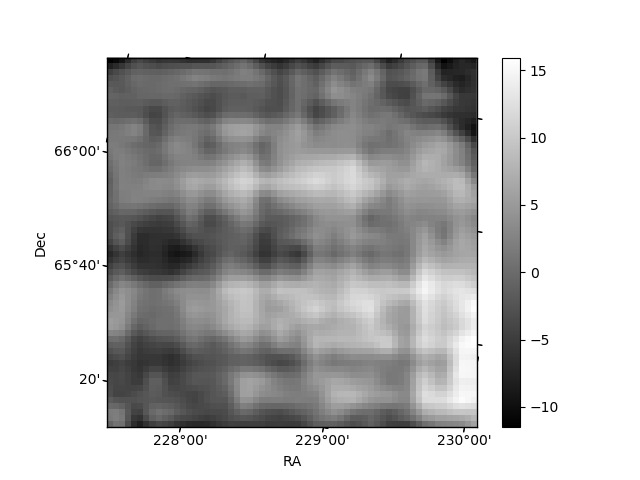
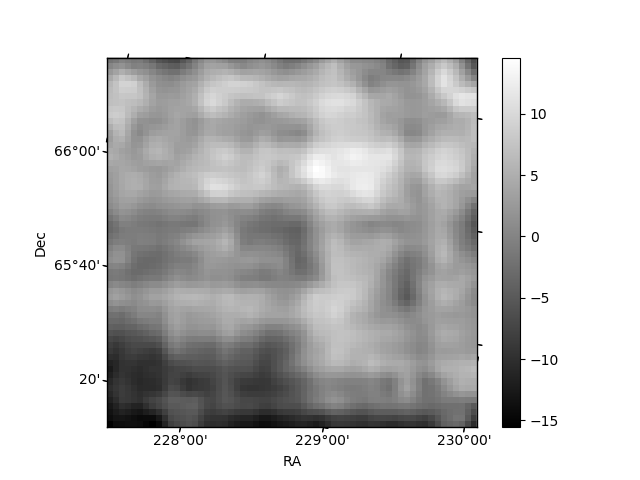
Histogram calculated using DETX and DETY for each event in the final _common_clean file
| Quadrant A | 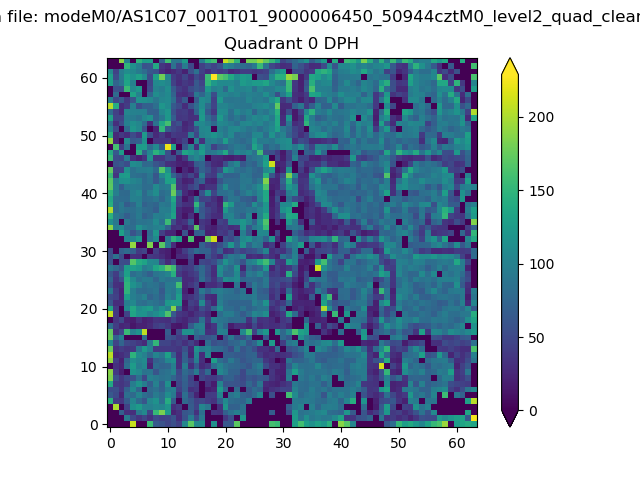 |
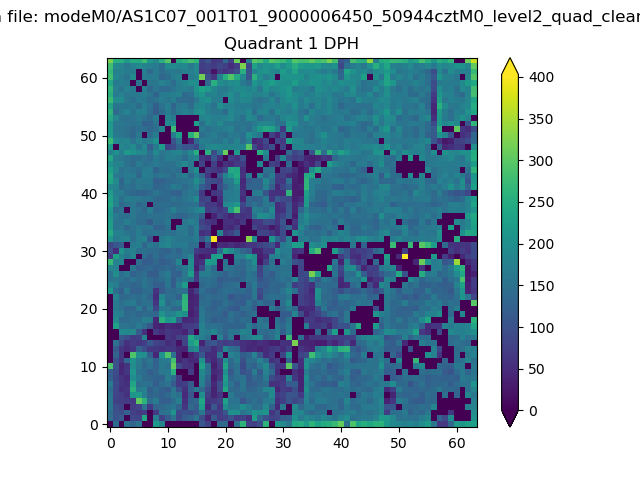 |
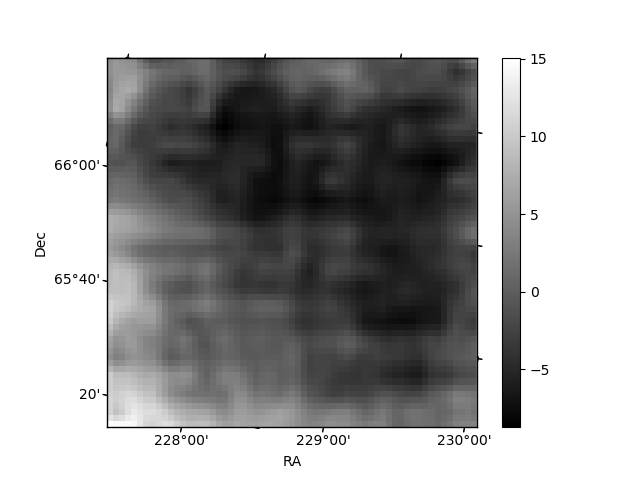
Quadrant B |
|---|---|---|---|
| Quadrant D | 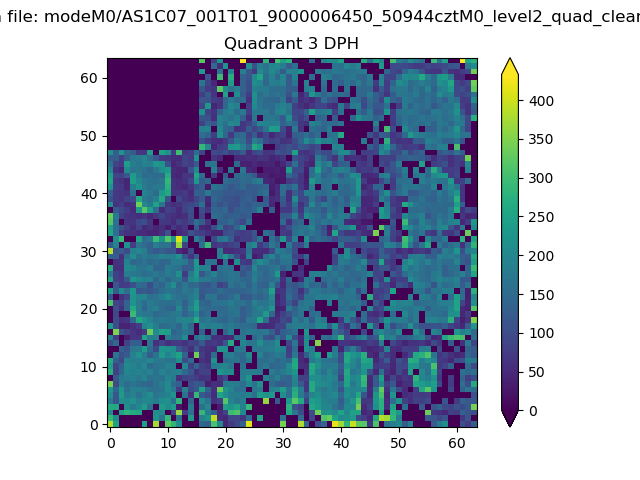 |
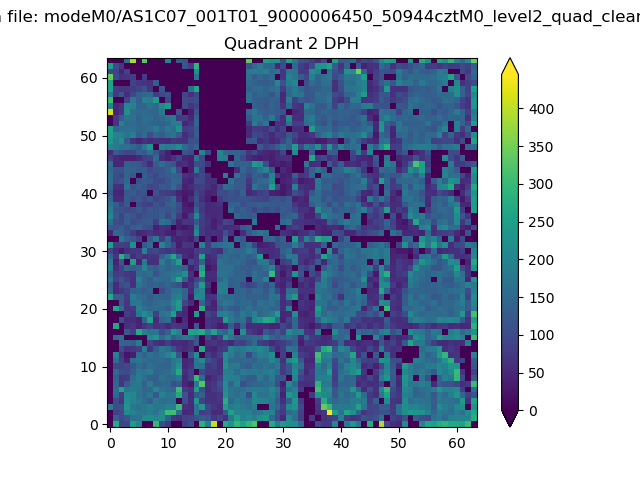 |
Quadrant C |
| Plot type | Count rate plots | Images |
|---|---|---|
| Comparison with Poisson distribution Blue bars denote a histogram of data divided into 1 sec bins. Red curve is a Poisson curve with rate = median count rate of data. |
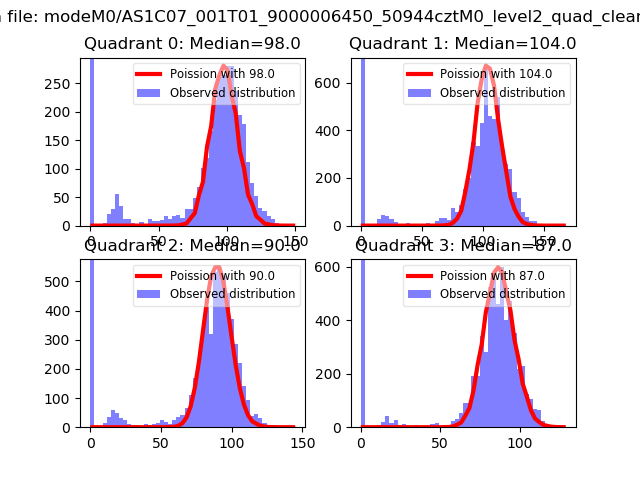 |
 |
| Quadrant-wise count rates Data is divided into 100 sec bins |
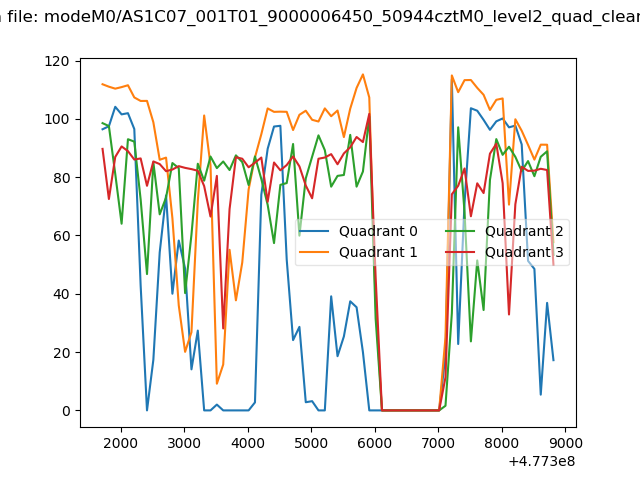 |
|
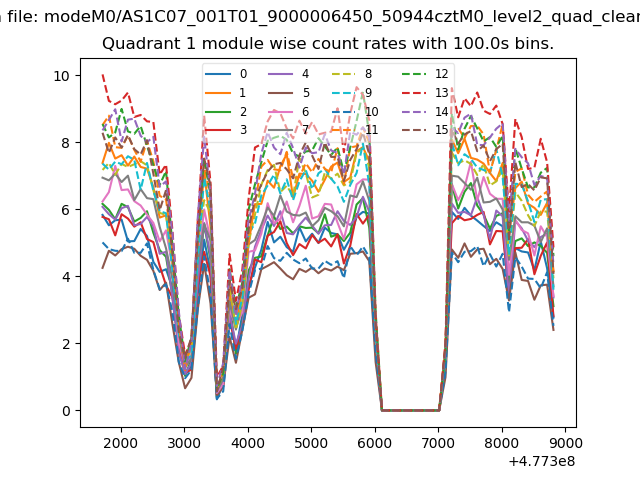
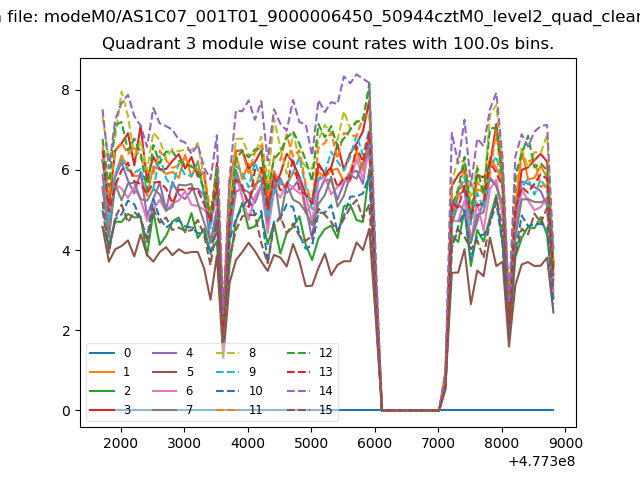
| Module-wise count rates for Quadrant A Data is divided into 100 sec bins |
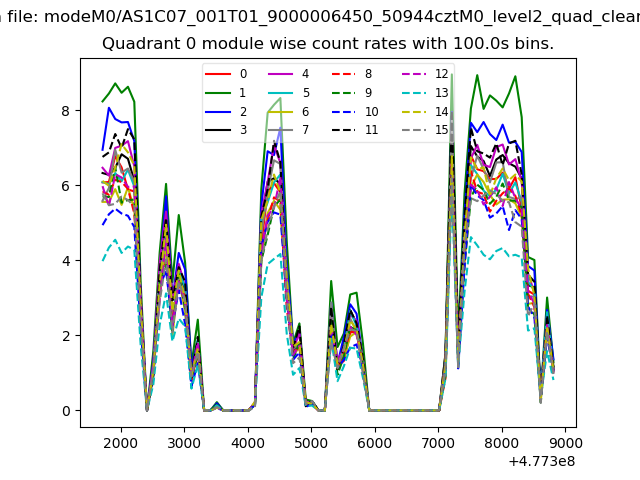 |
 |
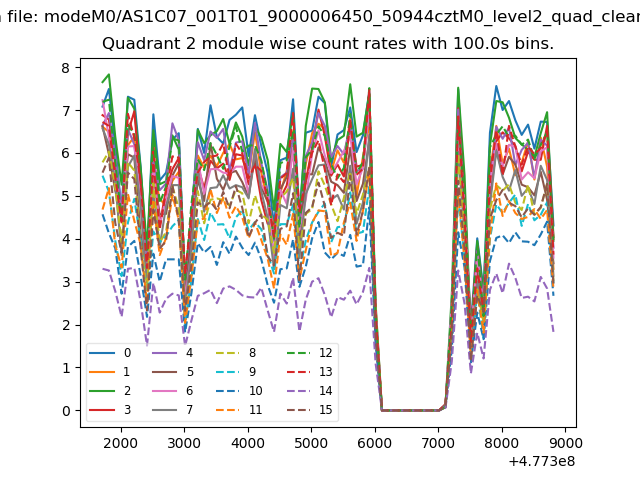
| Module-wise count rates for Quadrant B Data is divided into 100 sec bins |
 |
 |
| Module-wise count rates for Quadrant C Data is divided into 100 sec bins |
 |
 |
| Module-wise count rates for Quadrant D Data is divided into 100 sec bins |
 |
 |
| Parameter | Plot |
|---|---|
| CZT HV Monitor | 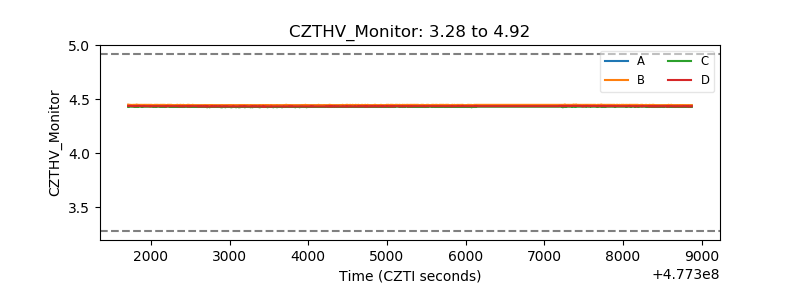 |
| D_VDD | 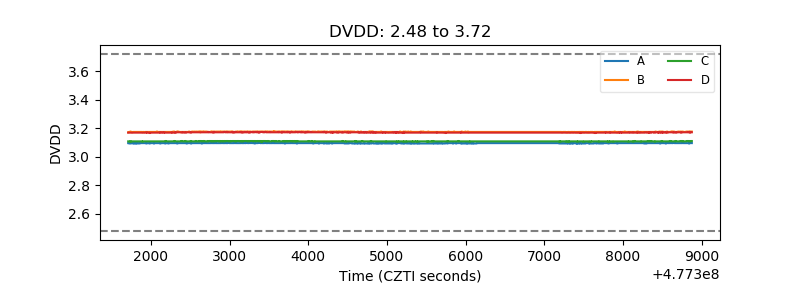 |
| Temperature 1 | 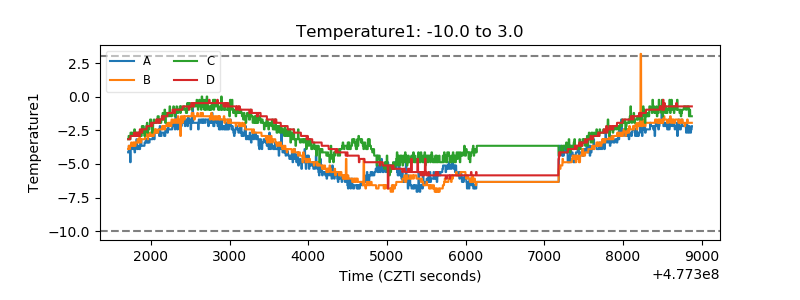 |
| Veto HV Monitor |  |
| Veto LLD | 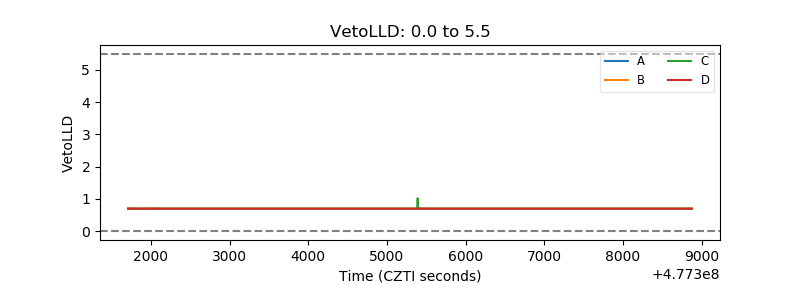 |
| Alpha Counter | 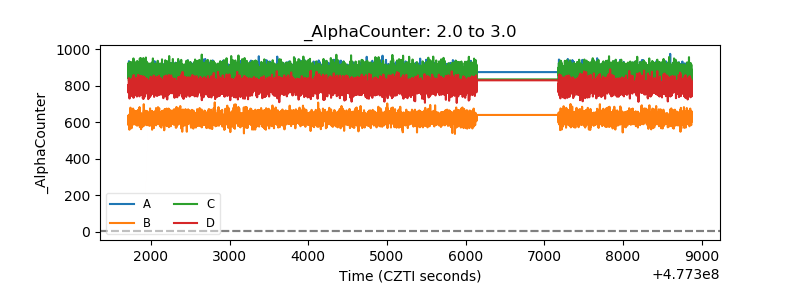 |
| _CPM_Rate | 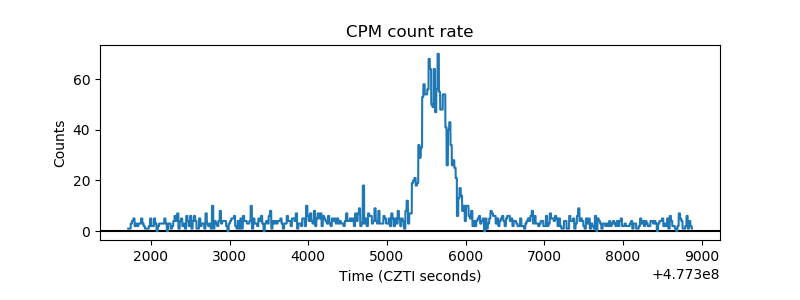 |
| CZT Counter | 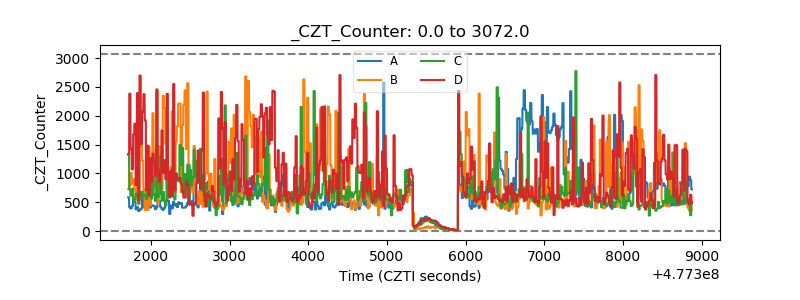 |
| +2.5 Volts monitor | 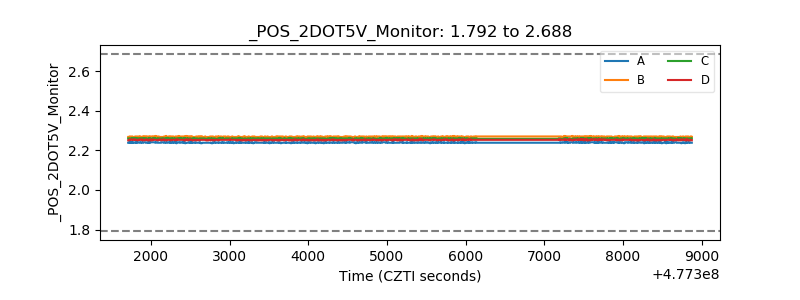 |
| +5 Volts monitor | 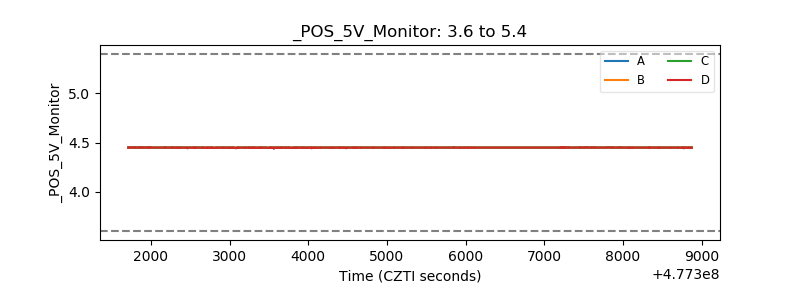 |
| _ROLL_ROT | 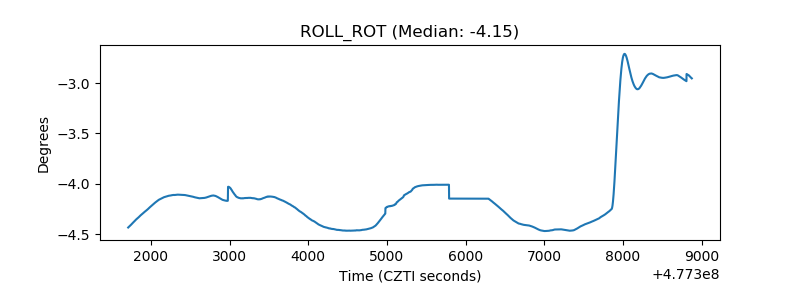 |
| _Roll_DEC | 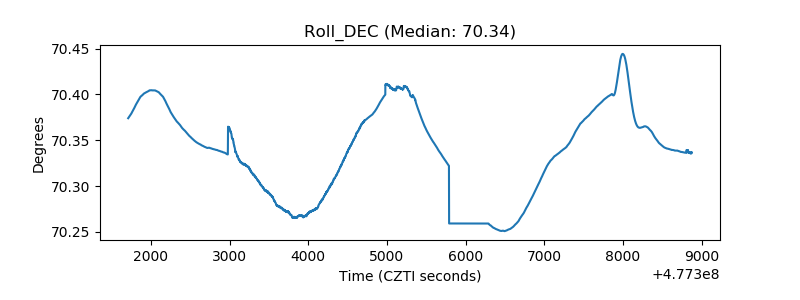 |
| _Roll_RA | 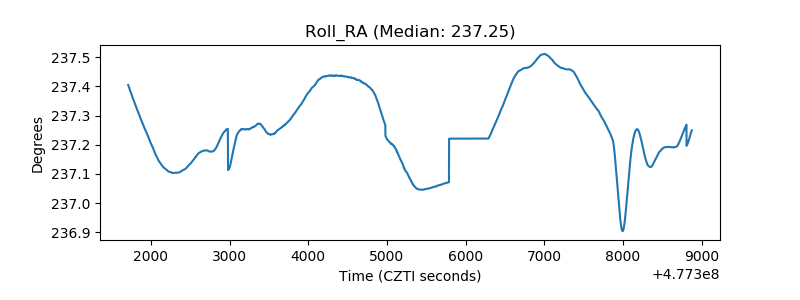 |
| Veto Counter | 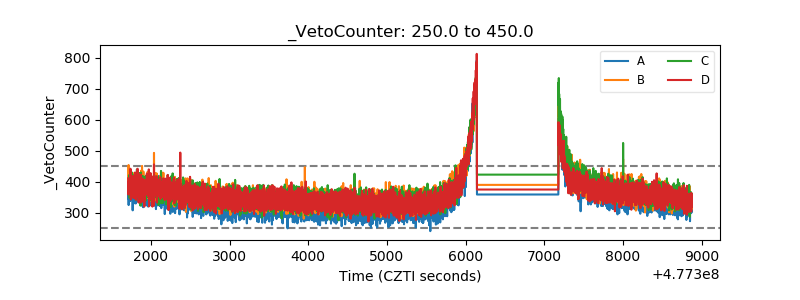 |