| Param | Original file | Final file |
|---|---|---|
| Filename | modeM0/AS1C07_001T01_9000006450_50945cztM0_level2.fits | modeM0/AS1C07_001T01_9000006450_50945cztM0_level2_quad_clean.evt |
| Size (bytes) | 675,244,800 | 81,276,480 |
| Size | 644.0 MB | 77.5 MB |
| Events in quadrant A | 9,445,307 | 409,339 |
| Events in quadrant B | 5,067,551 | 588,230 |
| Events in quadrant C | 4,707,162 | 543,026 |
| Events in quadrant D | 5,297,719 | 489,244 |
| Mode SS | |||
|---|---|---|---|
| Quadrant | BADHDUFLAG | Total packets | Discarded packets |
| A | 0 | 126 | 0 |
| B | 0 | 126 | 0 |
| C | 0 | 126 | 0 |
| D | 0 | 126 | 0 |
| Mode M0 | |||
|---|---|---|---|
| Quadrant | BADHDUFLAG | Total packets | Discarded packets |
| A | 0 | 32357 | 1 |
| B | 0 | 19345 | 1 |
| C | 0 | 18183 | 1 |
| D | 0 | 19950 | 1 |
| Mode M9 | |||
|---|---|---|---|
| Quadrant | BADHDUFLAG | Total packets | Discarded packets |
| A | 0 | 10 | 0 |
| B | 0 | 10 | 0 |
| C | 0 | 10 | 0 |
| D | 0 | 10 | 0 |
| Quadrant | Total seconds | Saturated seconds | Saturation percentage |
|---|---|---|---|
| A | 6169 | 2194 | 35.564921% |
| B | 6168 | 668 | 10.830091% |
| C | 6168 | 315 | 5.107004% |
| D | 6168 | 626 | 10.149157% |
Noise dominated data is calculated using 1-second bins in cleaned event files. If a bin has >2000 counts, and if more than 50% of those come from <1% of pixels, then it is considered to be noise-dominated and hence unusable.
| Quadrant | # 1 sec bins | Bins with >0 counts | Bins with >2000 counts | High rate bins dominated by noise | Noise dominated (total time) | Noise dominated (detector-on time) | Marked lightcurve |
|---|---|---|---|---|---|---|---|
| A | 7139 | 6170 | 1891 | 1891 | 26.49% | 30.65% | 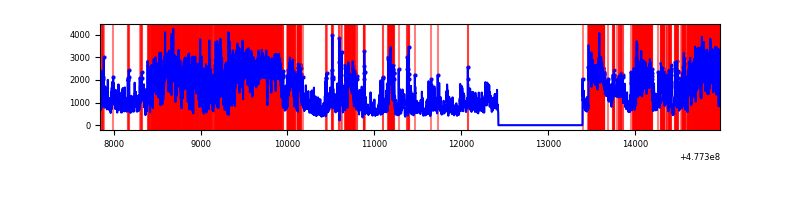 |
| B | 7138 | 6169 | 376 | 376 | 5.27% | 6.09% | 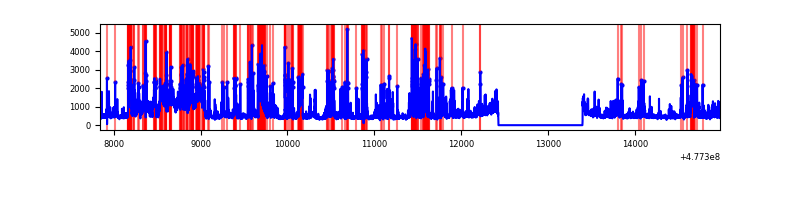 |
| C | 7138 | 6169 | 210 | 210 | 2.94% | 3.40% | 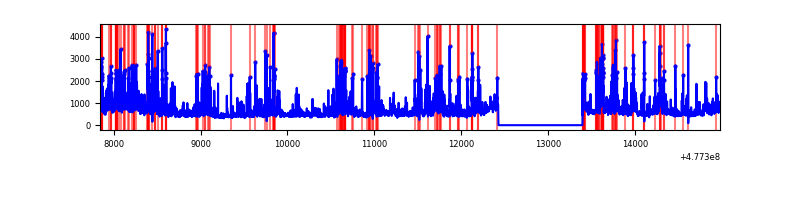 |
| D | 7138 | 6168 | 488 | 488 | 6.84% | 7.91% | 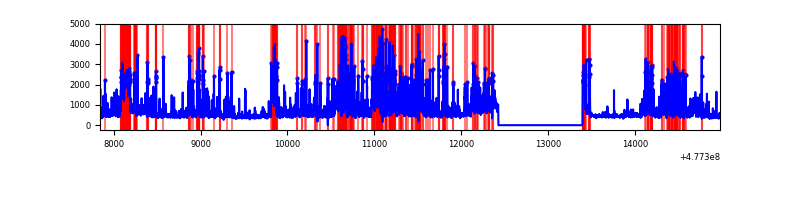 |
Top three noisy pixels from each quadrant. If the there are fewer than three noisy pixels in the level2.evt file, extra rows are filled as -1
| Pixel properties | Quadrant properties | ||||||
|---|---|---|---|---|---|---|---|
| Quadrant | DetID | PixID | Counts | Sigma | Mean | Median | Sigma |
| A | 8 | 43 | 5415203 | 37728.07 | 571 | 555 | 143.5 |
| A | 9 | 13 | 559364 | 3893.66 | 571 | 555 | 143.5 |
| A | 12 | 3 | 452024 | 3145.74 | 571 | 555 | 143.5 |
| B | 4 | 206 | 1415698 | 10484.76 | 630 | 607 | 135.0 |
| B | 4 | 81 | 579422 | 4288.58 | 630 | 607 | 135.0 |
| B | 4 | 171 | 257656 | 1904.54 | 630 | 607 | 135.0 |
| C | 12 | 252 | 504633 | 2934.36 | 629 | 623 | 171.8 |
| C | 14 | 245 | 427454 | 2485.02 | 629 | 623 | 171.8 |
| C | 13 | 3 | 222628 | 1292.52 | 629 | 623 | 171.8 |
| D | 8 | 176 | 1312459 | 7656.58 | 613 | 590 | 171.3 |
| D | 10 | 181 | 330472 | 1925.32 | 613 | 590 | 171.3 |
| D | 3 | 12 | 320291 | 1865.9 | 613 | 590 | 171.3 |
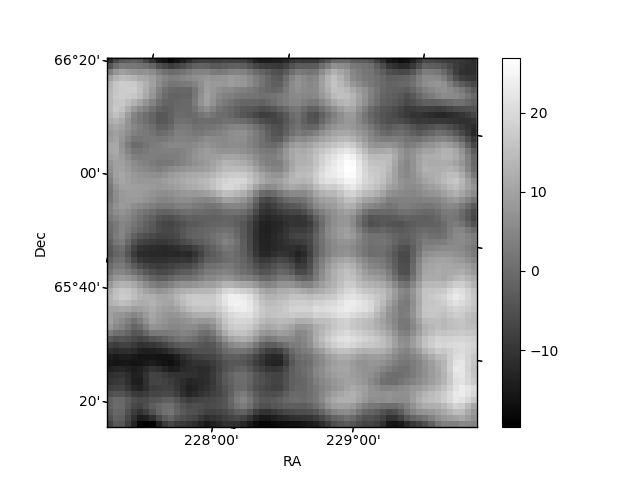
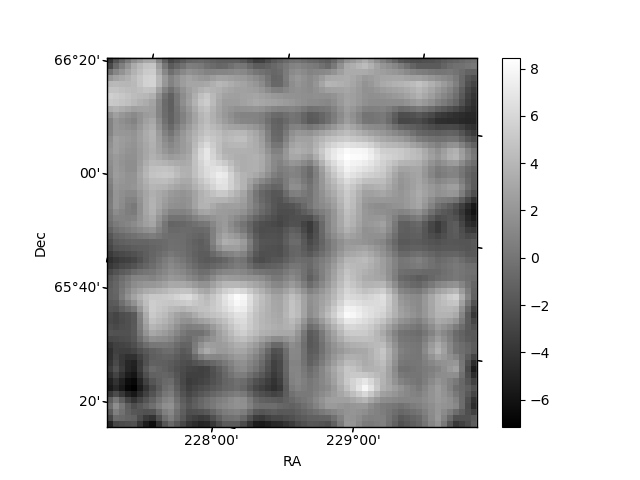
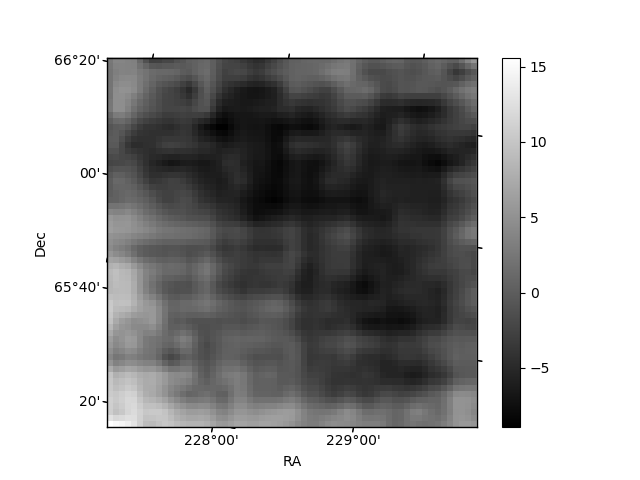
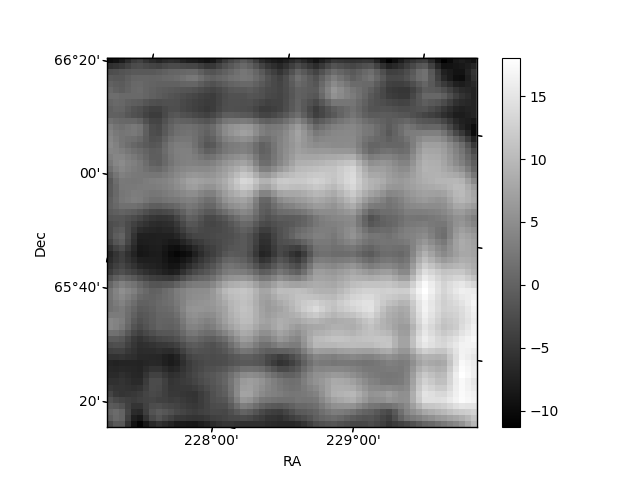
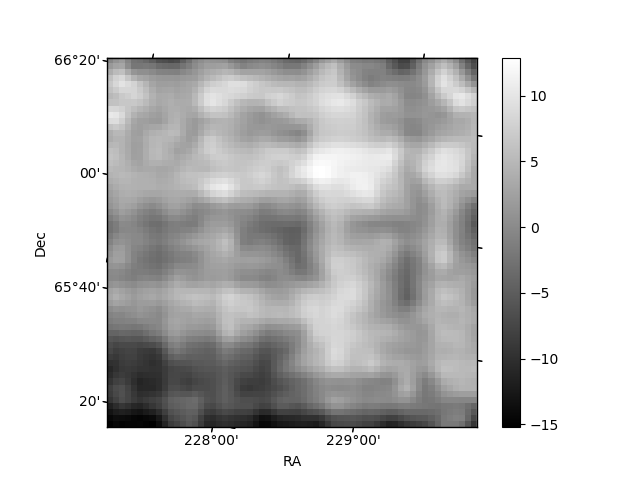
Histogram calculated using DETX and DETY for each event in the final _common_clean file
| Quadrant A | 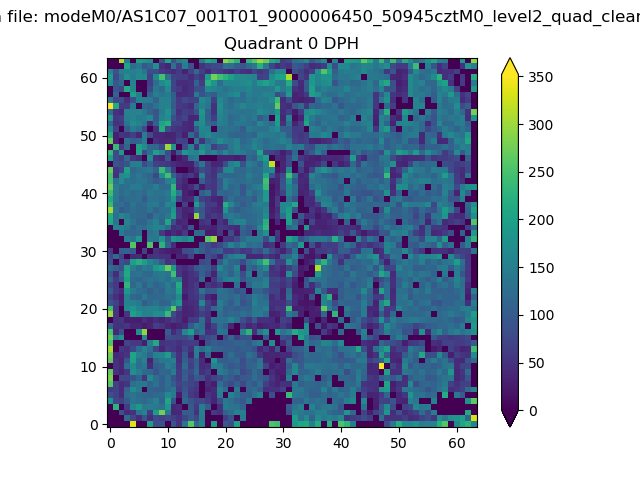 |
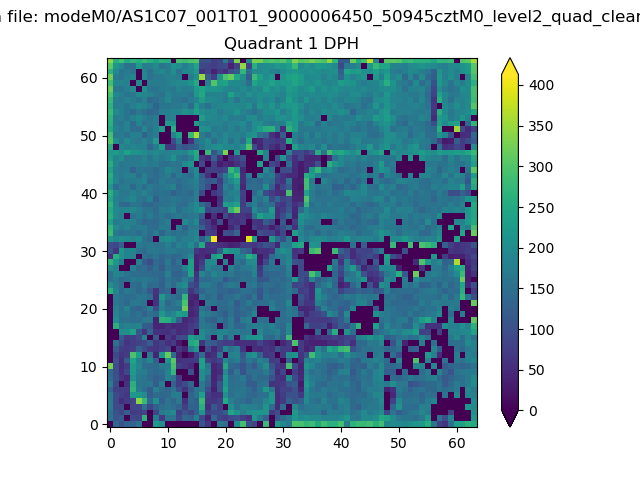 |
Quadrant B |
|---|---|---|---|
| Quadrant D | 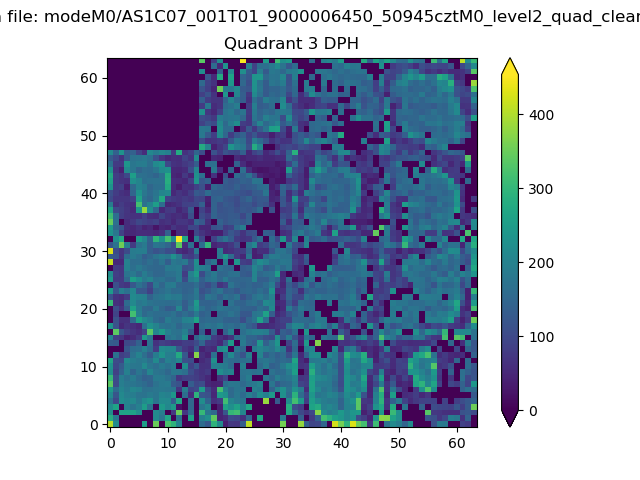 |
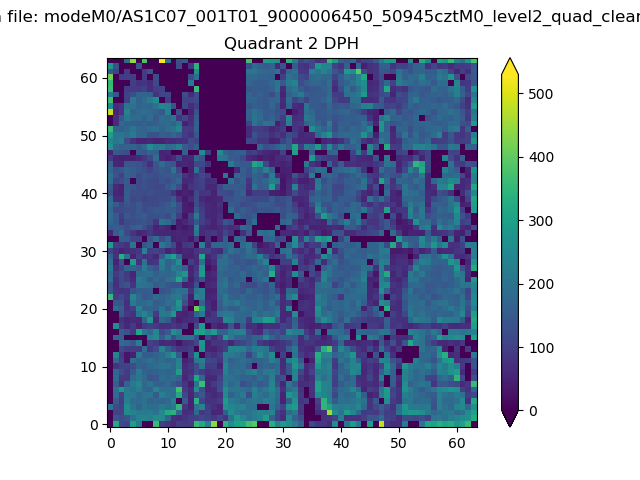 |
Quadrant C |
| Plot type | Count rate plots | Images |
|---|---|---|
| Comparison with Poisson distribution Blue bars denote a histogram of data divided into 1 sec bins. Red curve is a Poisson curve with rate = median count rate of data. |
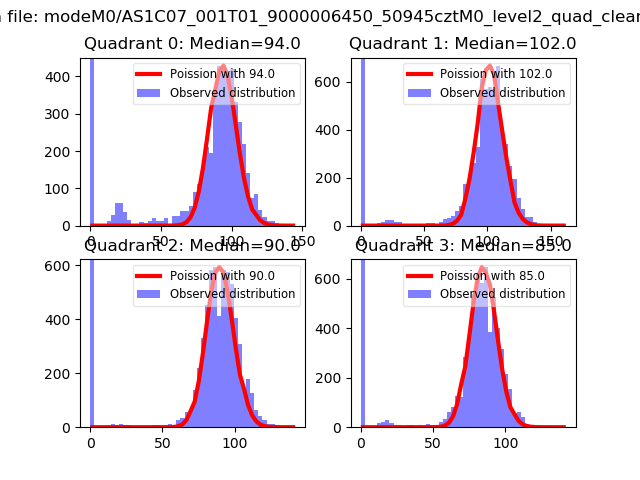 |
 |
| Quadrant-wise count rates Data is divided into 100 sec bins |
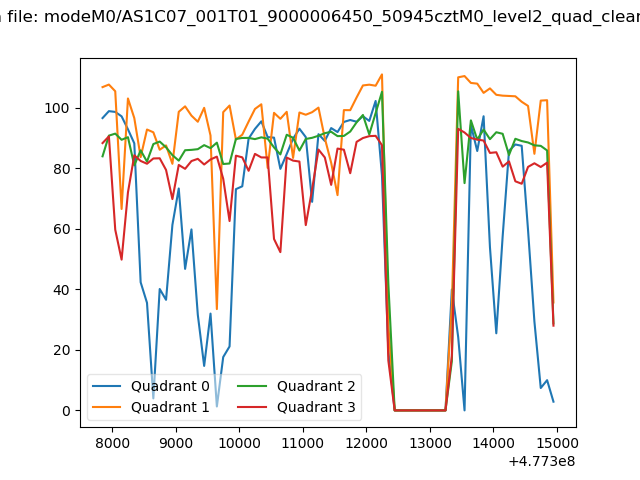 |
|
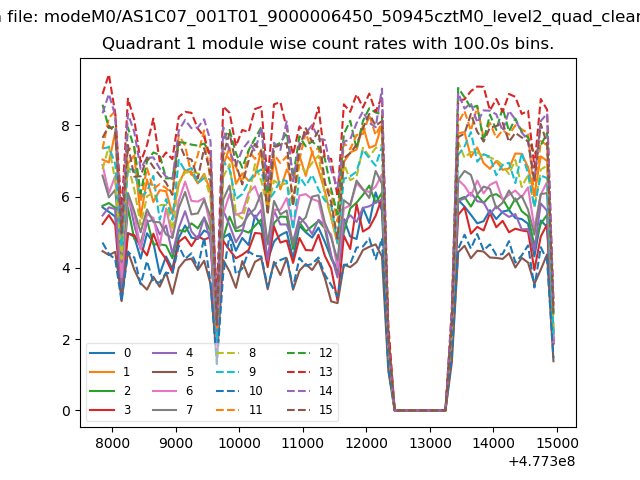
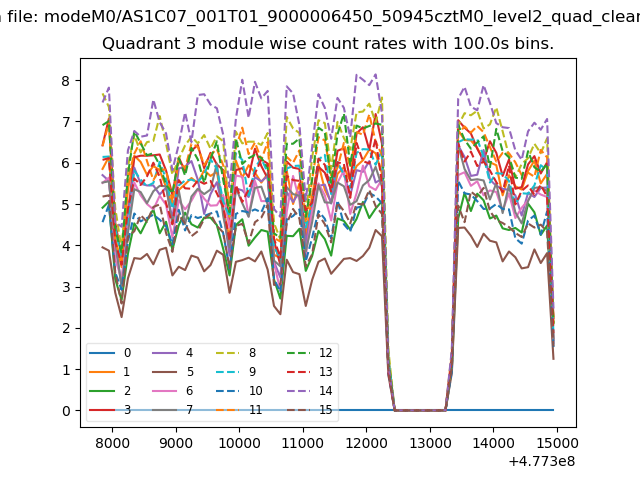
| Module-wise count rates for Quadrant A Data is divided into 100 sec bins |
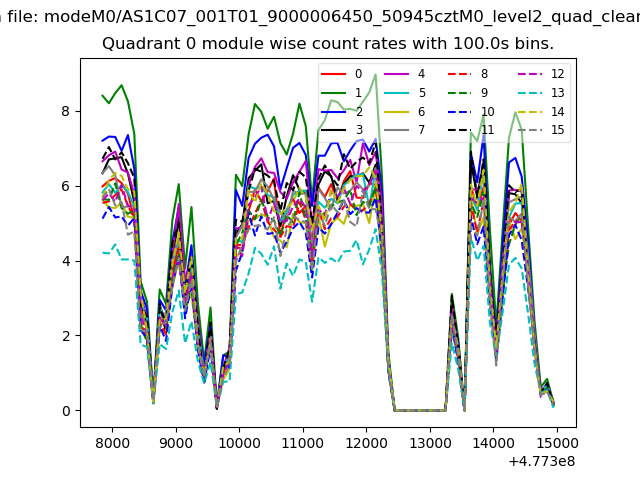 |
 |
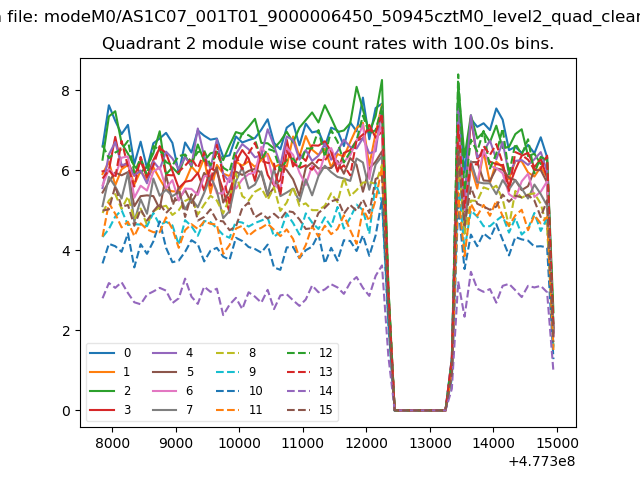
| Module-wise count rates for Quadrant B Data is divided into 100 sec bins |
 |
 |
| Module-wise count rates for Quadrant C Data is divided into 100 sec bins |
 |
 |
| Module-wise count rates for Quadrant D Data is divided into 100 sec bins |
 |
 |
| Parameter | Plot |
|---|---|
| CZT HV Monitor | 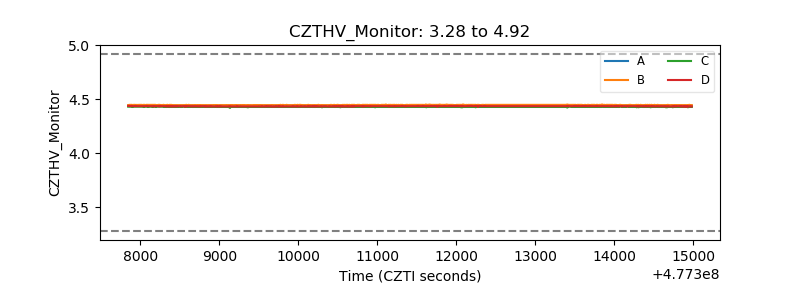 |
| D_VDD | 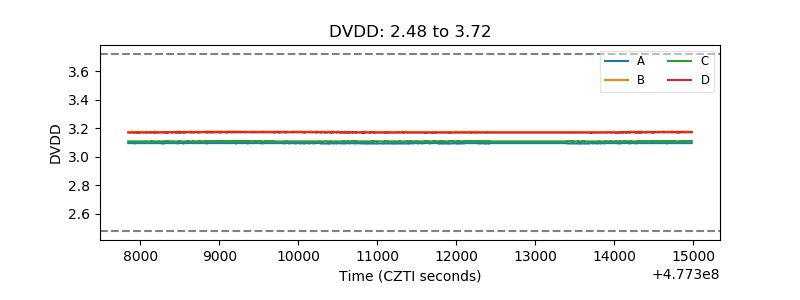 |
| Temperature 1 | 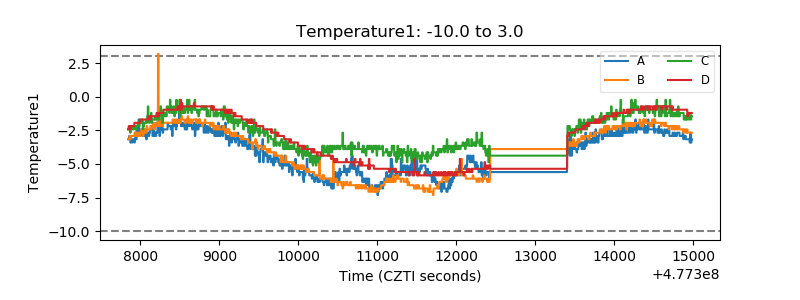 |
| Veto HV Monitor |  |
| Veto LLD | 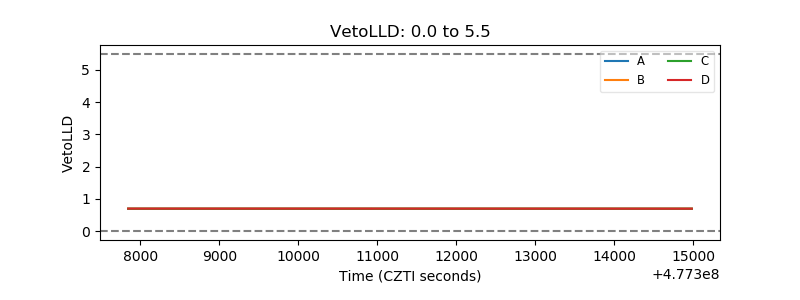 |
| Alpha Counter | 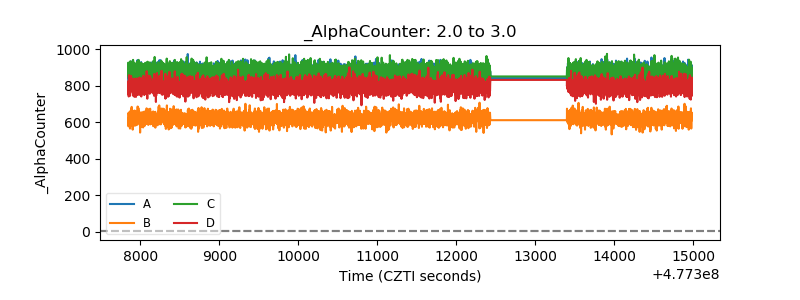 |
| _CPM_Rate | 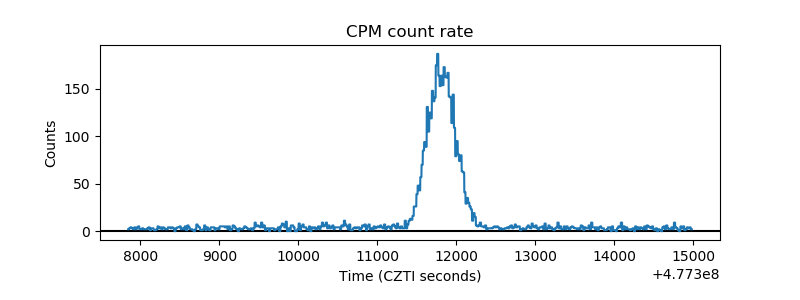 |
| CZT Counter | 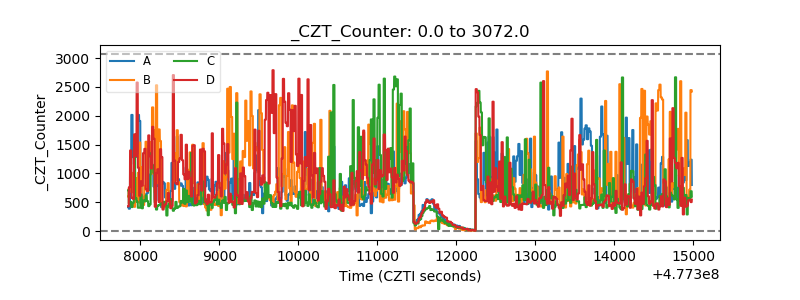 |
| +2.5 Volts monitor | 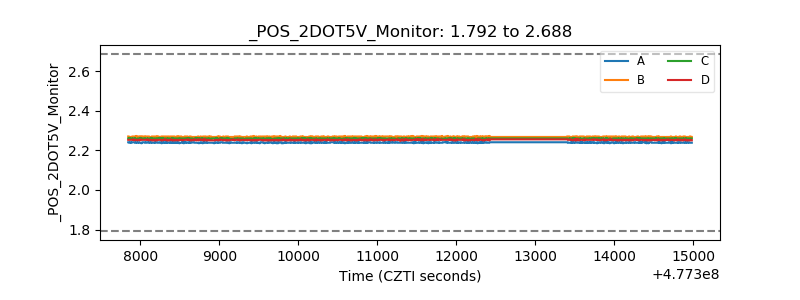 |
| +5 Volts monitor | 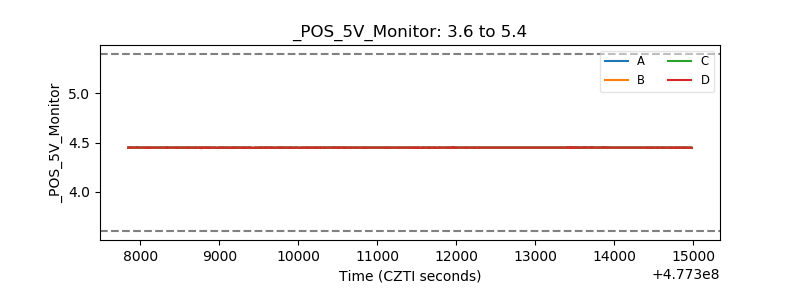 |
| _ROLL_ROT | 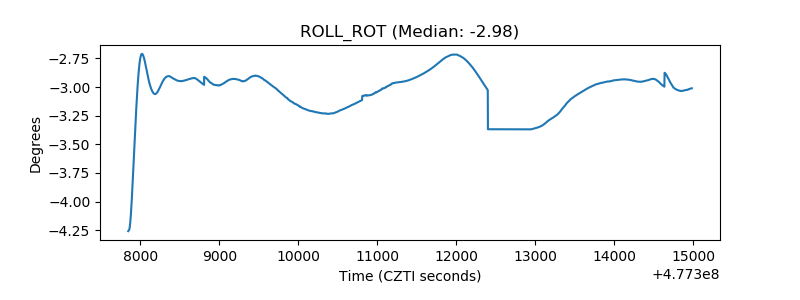 |
| _Roll_DEC | 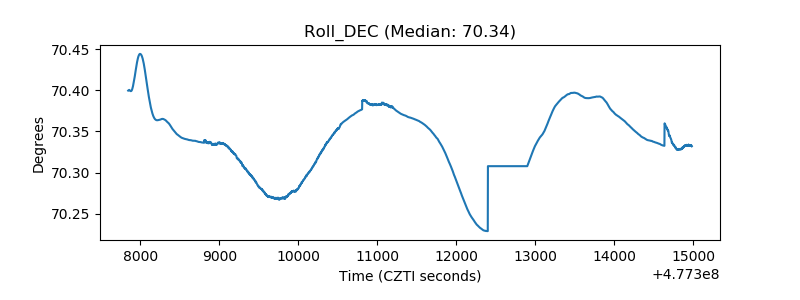 |
| _Roll_RA | 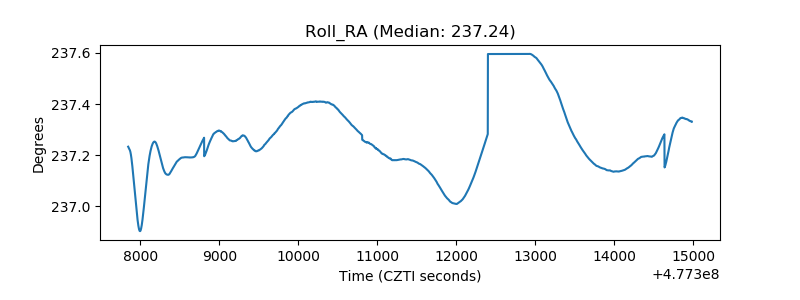 |
| Veto Counter | 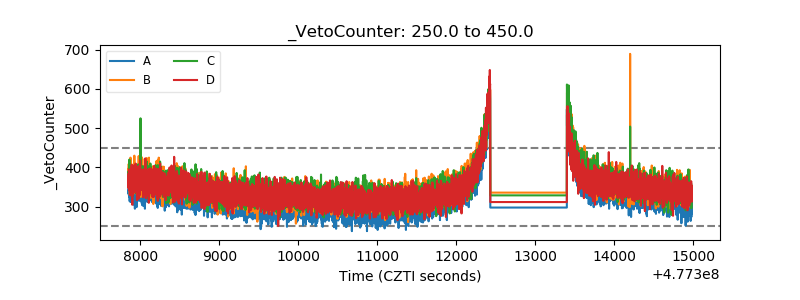 |