| Param | Original file | Final file |
|---|---|---|
| Filename | modeM0/AS1C07_001T01_9000006450_50946cztM0_level2.fits | modeM0/AS1C07_001T01_9000006450_50946cztM0_level2_quad_clean.evt |
| Size (bytes) | 896,604,480 | 81,264,960 |
| Size | 855.1 MB | 77.5 MB |
| Events in quadrant A | 16,039,712 | 140,103 |
| Events in quadrant B | 4,687,603 | 673,678 |
| Events in quadrant C | 5,091,729 | 611,691 |
| Events in quadrant D | 6,830,448 | 549,155 |
| Mode SS | |||
|---|---|---|---|
| Quadrant | BADHDUFLAG | Total packets | Discarded packets |
| A | 0 | 142 | 0 |
| B | 0 | 142 | 0 |
| C | 0 | 142 | 0 |
| D | 0 | 142 | 0 |
| Mode M0 | |||
|---|---|---|---|
| Quadrant | BADHDUFLAG | Total packets | Discarded packets |
| A | 0 | 52550 | 1 |
| B | 0 | 18865 | 1 |
| C | 0 | 19830 | 1 |
| D | 0 | 25185 | 1 |
| Mode M9 | |||
|---|---|---|---|
| Quadrant | BADHDUFLAG | Total packets | Discarded packets |
| A | 0 | 6 | 0 |
| B | 0 | 6 | 0 |
| C | 0 | 6 | 0 |
| D | 0 | 6 | 0 |
| Quadrant | Total seconds | Saturated seconds | Saturation percentage |
|---|---|---|---|
| A | 6970 | 5742 | 82.381636% |
| B | 6970 | 578 | 8.292683% |
| C | 6970 | 369 | 5.294118% |
| D | 6969 | 891 | 12.785192% |
Noise dominated data is calculated using 1-second bins in cleaned event files. If a bin has >2000 counts, and if more than 50% of those come from <1% of pixels, then it is considered to be noise-dominated and hence unusable.
| Quadrant | # 1 sec bins | Bins with >0 counts | Bins with >2000 counts | High rate bins dominated by noise | Noise dominated (total time) | Noise dominated (detector-on time) | Marked lightcurve |
|---|---|---|---|---|---|---|---|
| A | 7550 | 6971 | 5153 | 5153 | 68.25% | 73.92% | 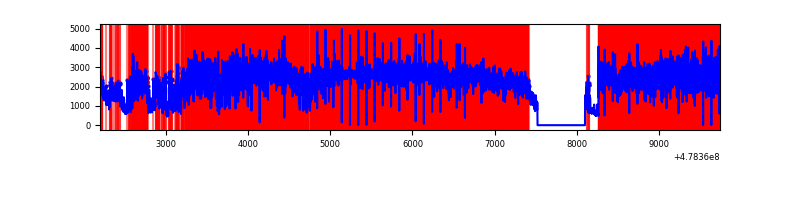 |
| B | 7550 | 6971 | 304 | 304 | 4.03% | 4.36% | 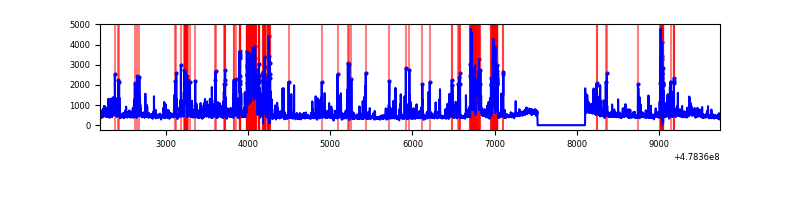 |
| C | 7550 | 6971 | 212 | 212 | 2.81% | 3.04% | 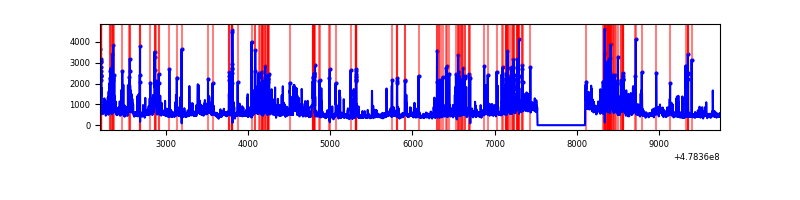 |
| D | 7549 | 6969 | 820 | 820 | 10.86% | 11.77% | 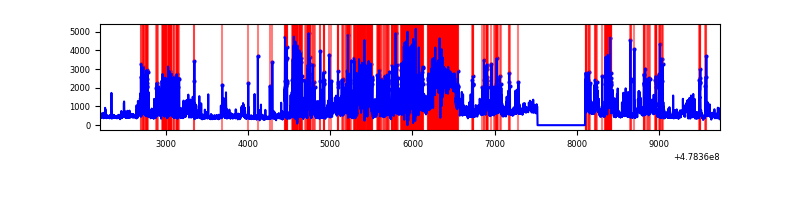 |
Top three noisy pixels from each quadrant. If the there are fewer than three noisy pixels in the level2.evt file, extra rows are filled as -1
| Pixel properties | Quadrant properties | ||||||
|---|---|---|---|---|---|---|---|
| Quadrant | DetID | PixID | Counts | Sigma | Mean | Median | Sigma |
| A | 8 | 43 | 13321938 | 127047.63 | 406 | 394 | 104.9 |
| A | 9 | 13 | 486717 | 4638.06 | 406 | 394 | 104.9 |
| A | 12 | 3 | 274725 | 2616.3 | 406 | 394 | 104.9 |
| B | 4 | 206 | 1052571 | 6904.6 | 718 | 693 | 152.3 |
| B | 8 | 128 | 281674 | 1844.38 | 718 | 693 | 152.3 |
| B | 4 | 171 | 182365 | 1192.51 | 718 | 693 | 152.3 |
| C | 14 | 245 | 579632 | 2985.48 | 712 | 706 | 193.9 |
| C | 3 | 233 | 290009 | 1491.92 | 712 | 706 | 193.9 |
| C | 13 | 3 | 242545 | 1247.15 | 712 | 706 | 193.9 |
| D | 8 | 176 | 2560160 | 13242.79 | 691 | 662 | 193.3 |
| D | 7 | 222 | 352241 | 1819.06 | 691 | 662 | 193.3 |
| D | 15 | 108 | 297205 | 1534.3 | 691 | 662 | 193.3 |
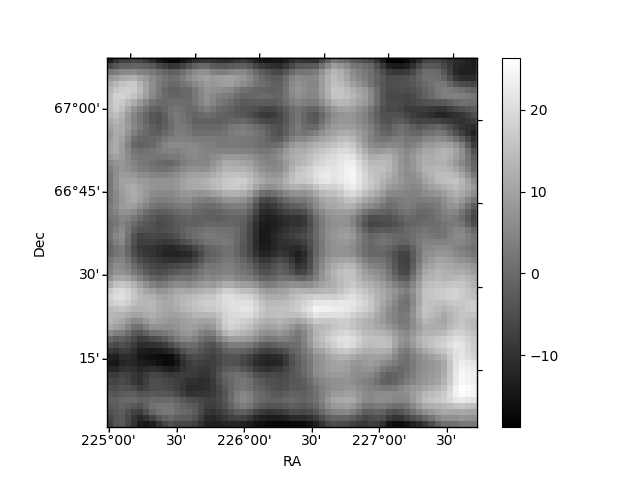
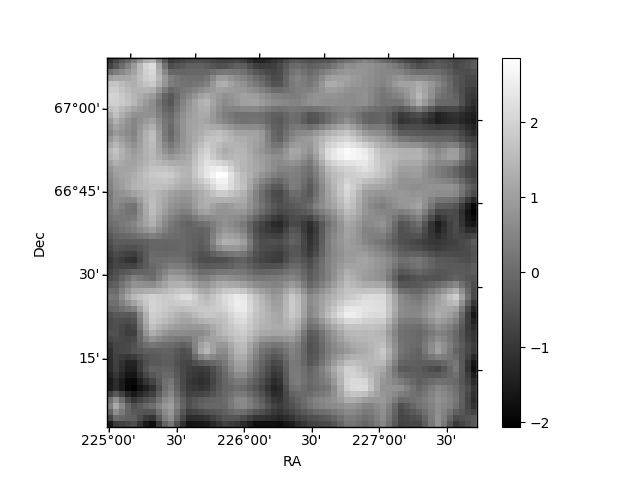
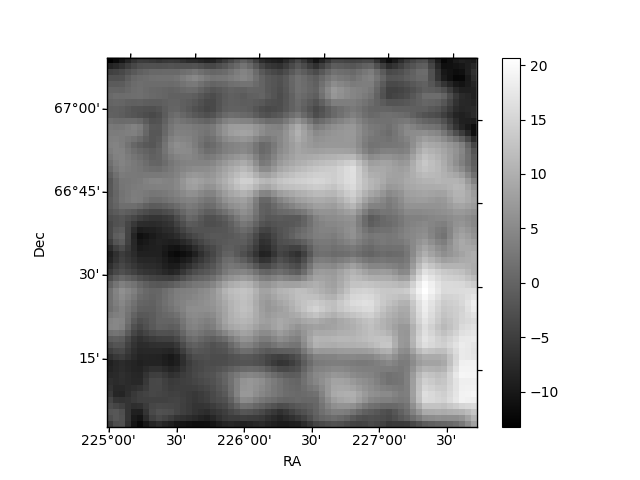
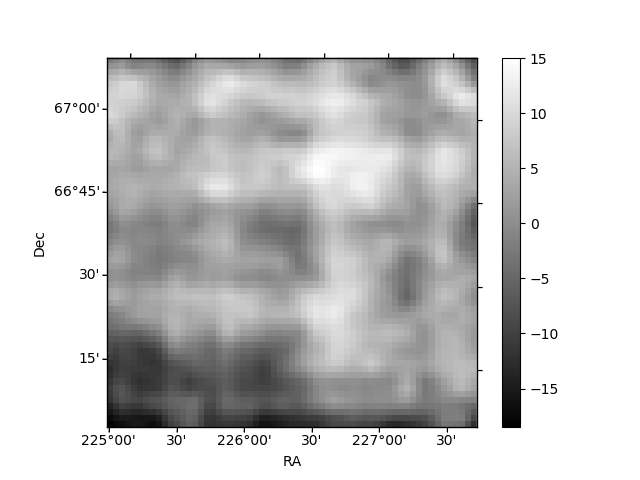
Histogram calculated using DETX and DETY for each event in the final _common_clean file
| Quadrant A | 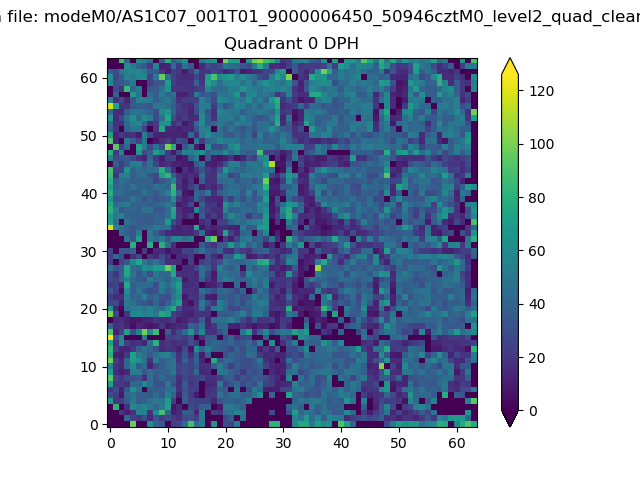 |
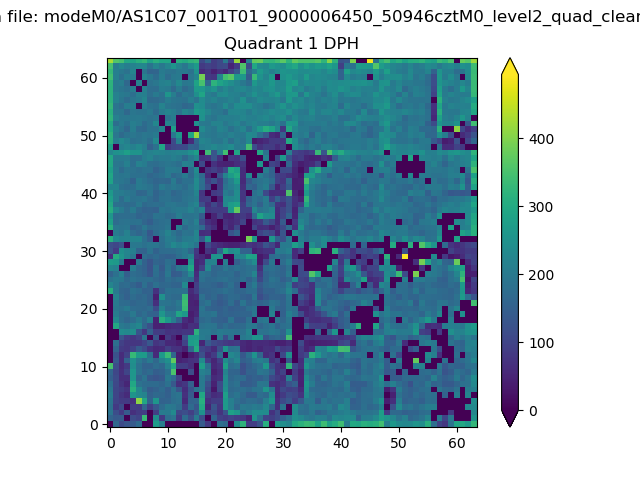 |
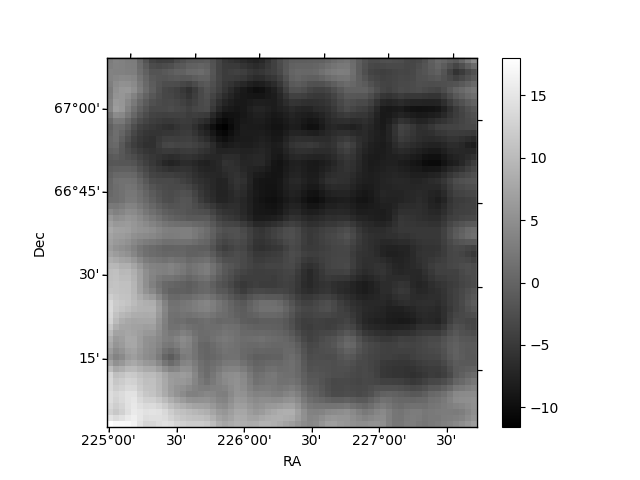
Quadrant B |
|---|---|---|---|
| Quadrant D | 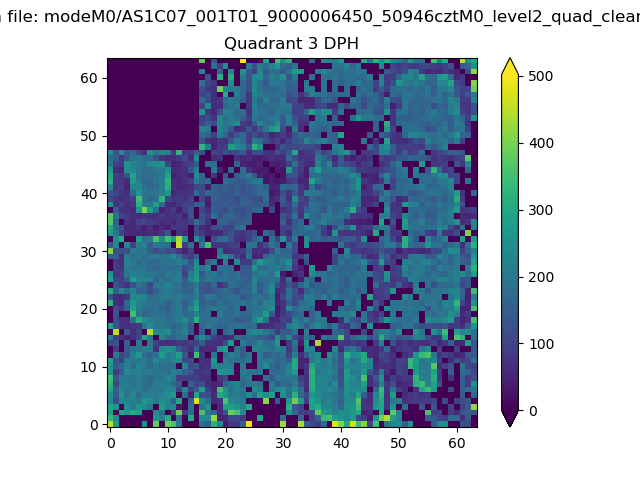 |
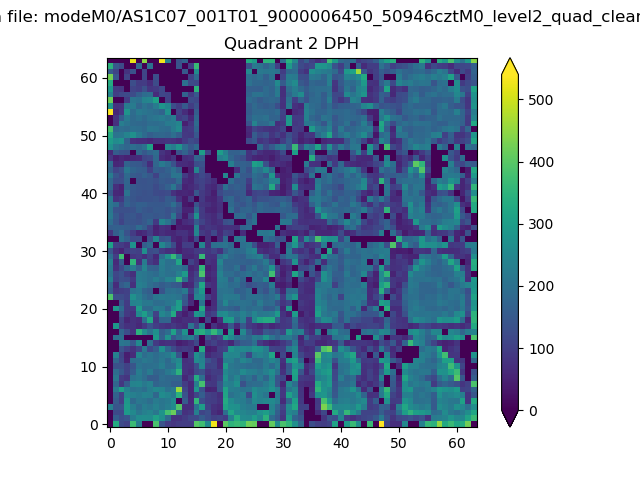 |
Quadrant C |
| Plot type | Count rate plots | Images |
|---|---|---|
| Comparison with Poisson distribution Blue bars denote a histogram of data divided into 1 sec bins. Red curve is a Poisson curve with rate = median count rate of data. |
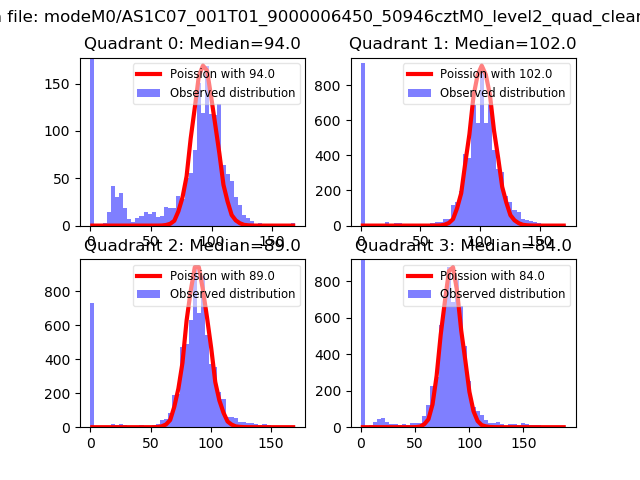 |
 |
| Quadrant-wise count rates Data is divided into 100 sec bins |
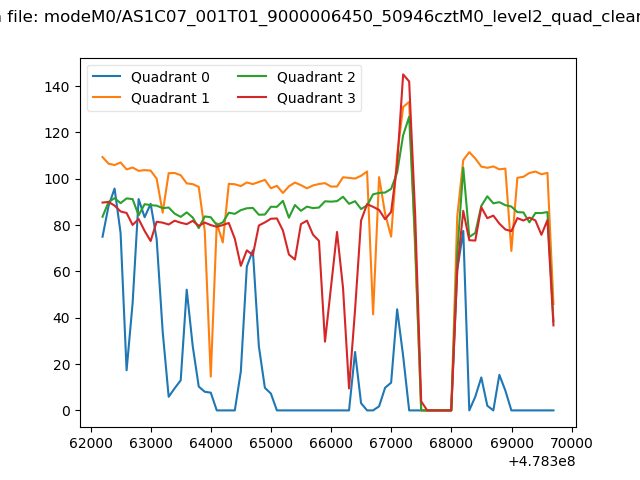 |
|
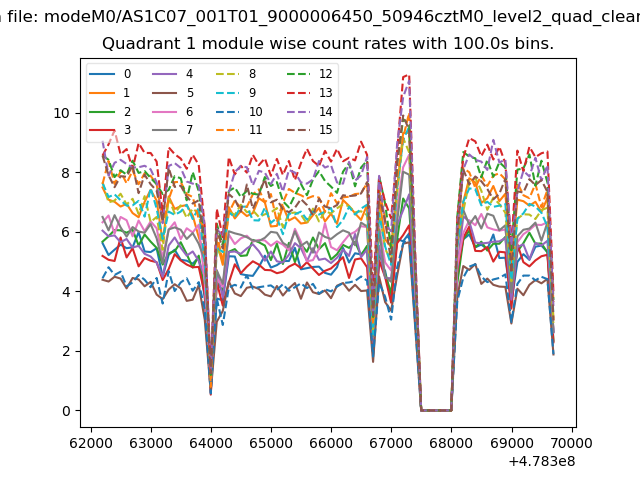
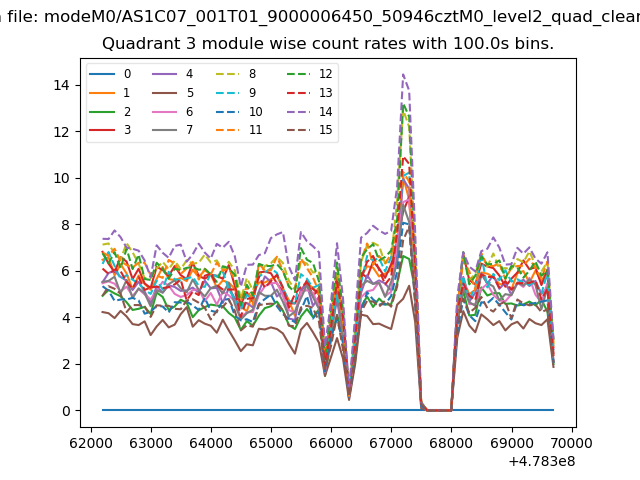
| Module-wise count rates for Quadrant A Data is divided into 100 sec bins |
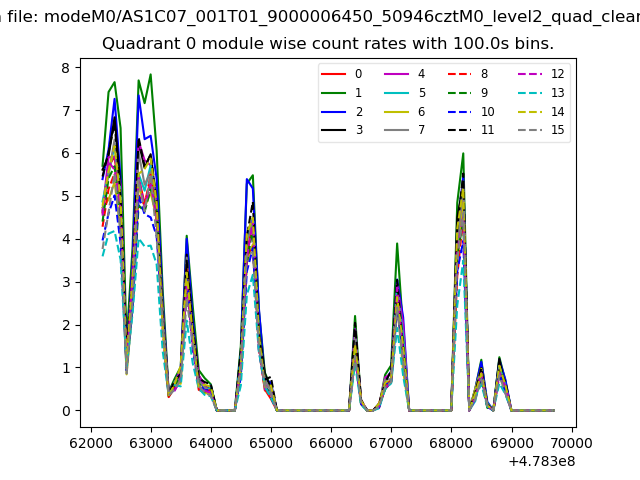 |
 |
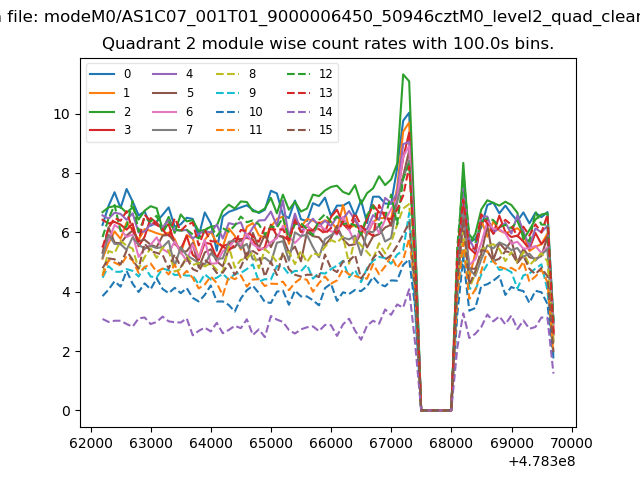
| Module-wise count rates for Quadrant B Data is divided into 100 sec bins |
 |
 |
| Module-wise count rates for Quadrant C Data is divided into 100 sec bins |
 |
 |
| Module-wise count rates for Quadrant D Data is divided into 100 sec bins |
 |
 |
| Parameter | Plot |
|---|---|
| CZT HV Monitor | 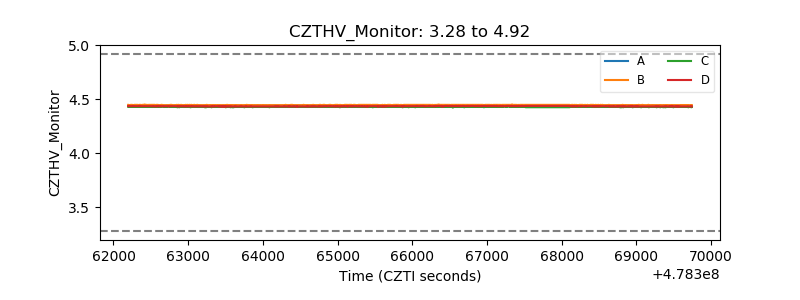 |
| D_VDD | 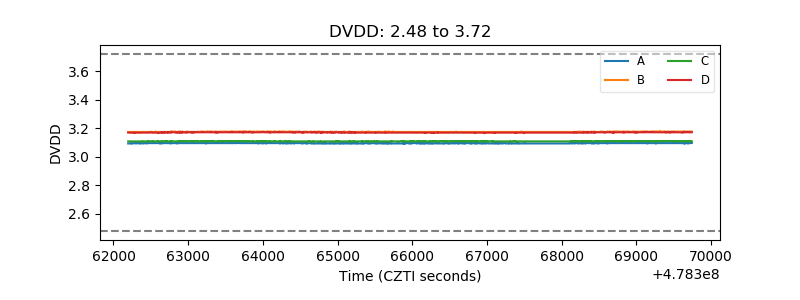 |
| Temperature 1 | 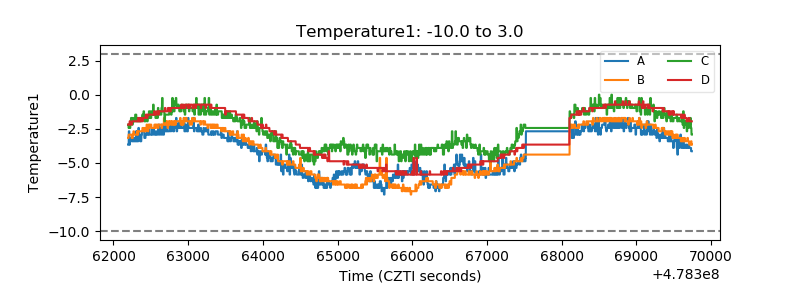 |
| Veto HV Monitor | 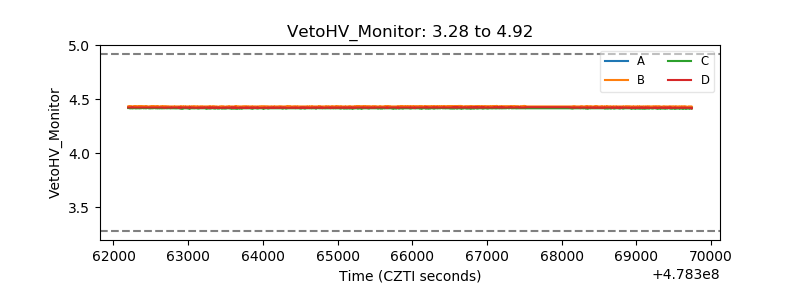 |
| Veto LLD | 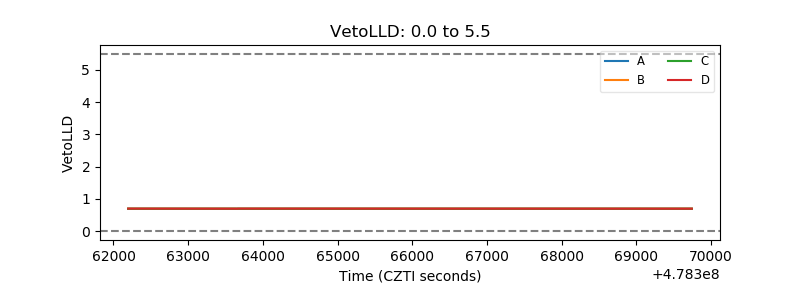 |
| Alpha Counter | 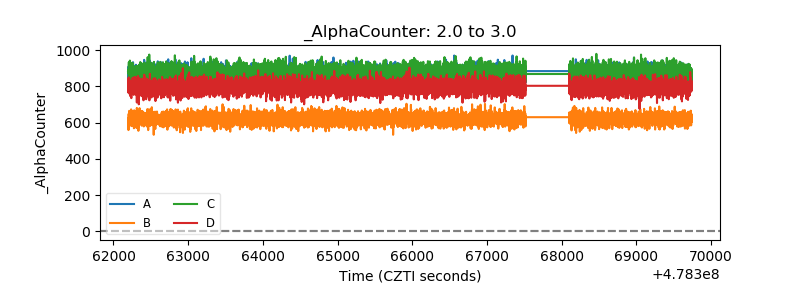 |
| _CPM_Rate | 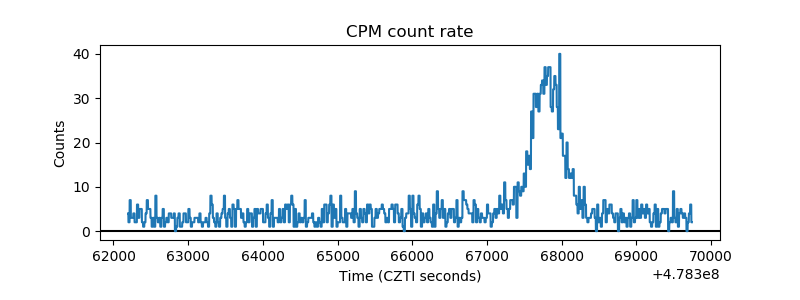 |
| CZT Counter | 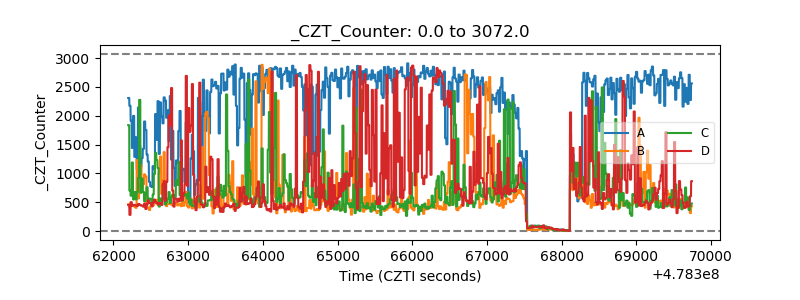 |
| +2.5 Volts monitor | 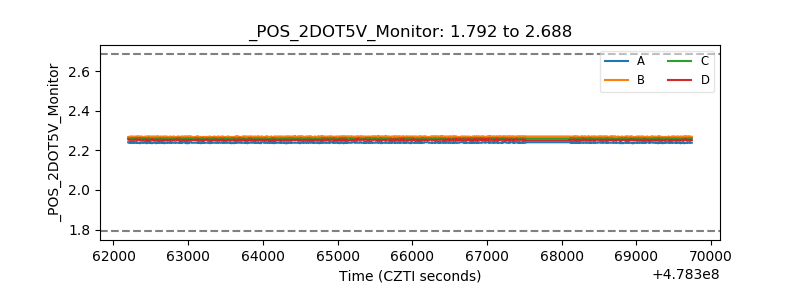 |
| +5 Volts monitor | 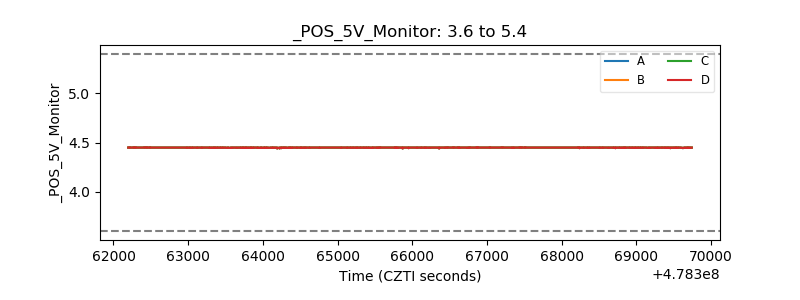 |
| _ROLL_ROT | 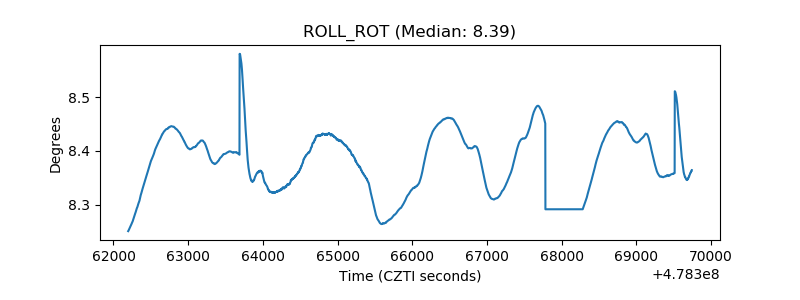 |
| _Roll_DEC | 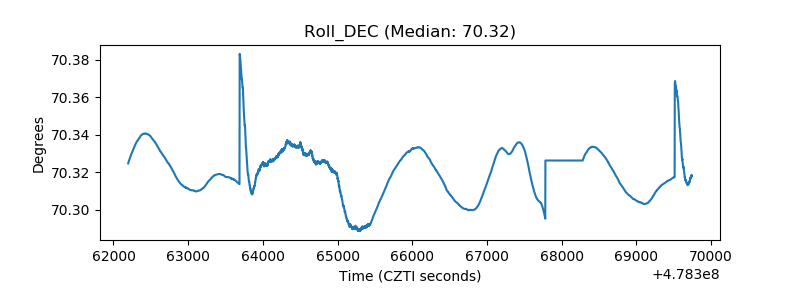 |
| _Roll_RA | 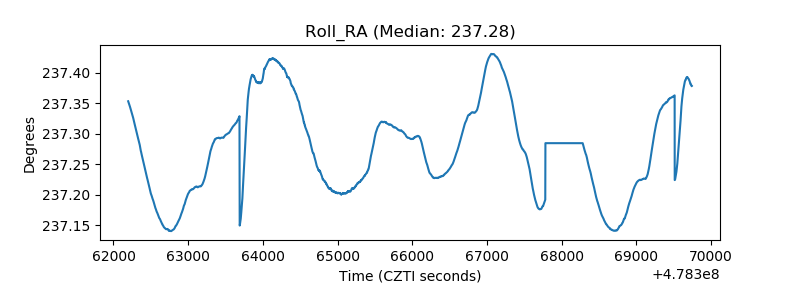 |
| Veto Counter | 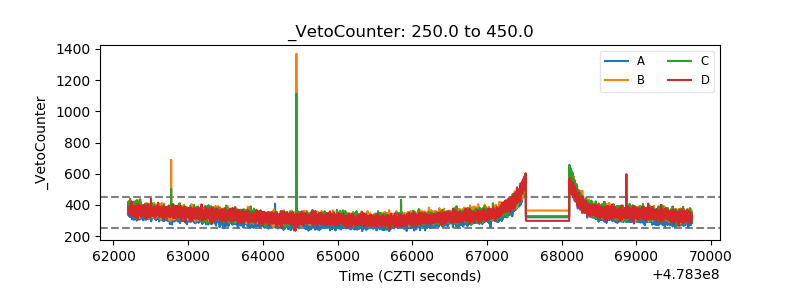 |