| Param | Original file | Final file |
|---|---|---|
| Filename | modeM0/AS1C07_001T01_9000006450_50947cztM0_level2.fits | modeM0/AS1C07_001T01_9000006450_50947cztM0_level2_quad_clean.evt |
| Size (bytes) | 981,550,080 | 91,370,880 |
| Size | 936.1 MB | 87.1 MB |
| Events in quadrant A | 14,777,202 | 319,247 |
| Events in quadrant B | 5,702,417 | 723,033 |
| Events in quadrant C | 7,185,608 | 617,322 |
| Events in quadrant D | 8,077,116 | 574,450 |
| Mode SS | |||
|---|---|---|---|
| Quadrant | BADHDUFLAG | Total packets | Discarded packets |
| A | 0 | 152 | 0 |
| B | 0 | 152 | 0 |
| C | 0 | 152 | 0 |
| D | 0 | 152 | 0 |
| Mode M0 | |||
|---|---|---|---|
| Quadrant | BADHDUFLAG | Total packets | Discarded packets |
| A | 0 | 49270 | 0 |
| B | 0 | 22349 | 0 |
| C | 0 | 26639 | 0 |
| D | 0 | 29367 | 0 |
| Quadrant | Total seconds | Saturated seconds | Saturation percentage |
|---|---|---|---|
| A | 7652 | 4566 | 59.670674% |
| B | 7652 | 733 | 9.579195% |
| C | 7653 | 920 | 12.021430% |
| D | 7653 | 1134 | 14.817719% |
Noise dominated data is calculated using 1-second bins in cleaned event files. If a bin has >2000 counts, and if more than 50% of those come from <1% of pixels, then it is considered to be noise-dominated and hence unusable.
| Quadrant | # 1 sec bins | Bins with >0 counts | Bins with >2000 counts | High rate bins dominated by noise | Noise dominated (total time) | Noise dominated (detector-on time) | Marked lightcurve |
|---|---|---|---|---|---|---|---|
| A | 7652 | 7652 | 4123 | 4123 | 53.88% | 53.88% | 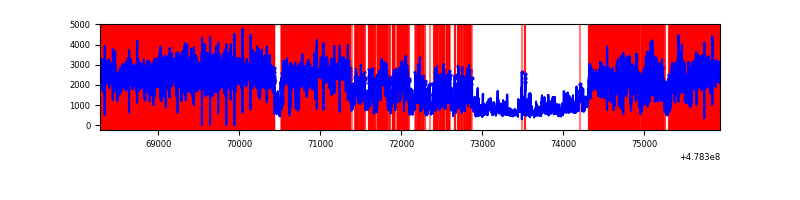 |
| B | 7652 | 7652 | 376 | 376 | 4.91% | 4.91% |  |
| C | 7653 | 7653 | 750 | 750 | 9.80% | 9.80% | 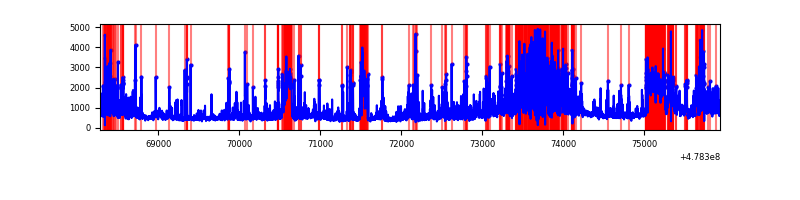 |
| D | 7653 | 7653 | 924 | 924 | 12.07% | 12.07% | 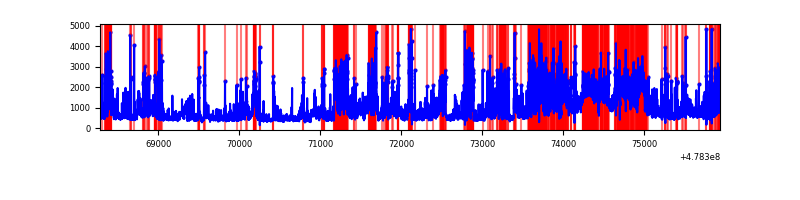 |
Top three noisy pixels from each quadrant. If the there are fewer than three noisy pixels in the level2.evt file, extra rows are filled as -1
| Pixel properties | Quadrant properties | ||||||
|---|---|---|---|---|---|---|---|
| Quadrant | DetID | PixID | Counts | Sigma | Mean | Median | Sigma |
| A | 8 | 43 | 10659601 | 76028.74 | 555 | 540 | 140.2 |
| A | 9 | 13 | 735209 | 5240.23 | 555 | 540 | 140.2 |
| A | 12 | 3 | 330483 | 2353.41 | 555 | 540 | 140.2 |
| B | 4 | 206 | 1467346 | 8913.51 | 775 | 749 | 164.5 |
| B | 4 | 81 | 557671 | 3384.79 | 775 | 749 | 164.5 |
| B | 4 | 171 | 242554 | 1469.61 | 775 | 749 | 164.5 |
| C | 15 | 147 | 820488 | 3918.28 | 755 | 748 | 209.2 |
| C | 0 | 193 | 603404 | 2880.64 | 755 | 748 | 209.2 |
| C | 4 | 5 | 529786 | 2528.75 | 755 | 748 | 209.2 |
| D | 8 | 176 | 3123417 | 14930.54 | 747 | 720 | 209.1 |
| D | 15 | 42 | 522610 | 2495.31 | 747 | 720 | 209.1 |
| D | 3 | 12 | 329906 | 1573.94 | 747 | 720 | 209.1 |
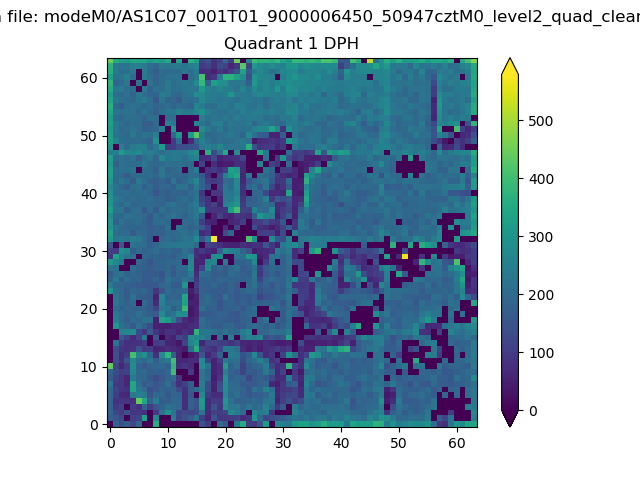
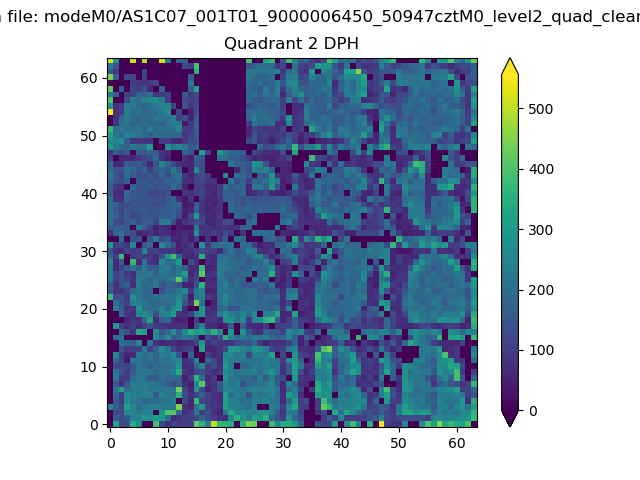
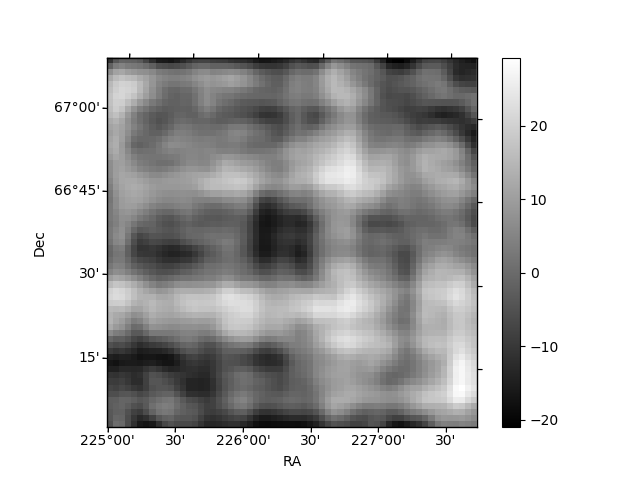
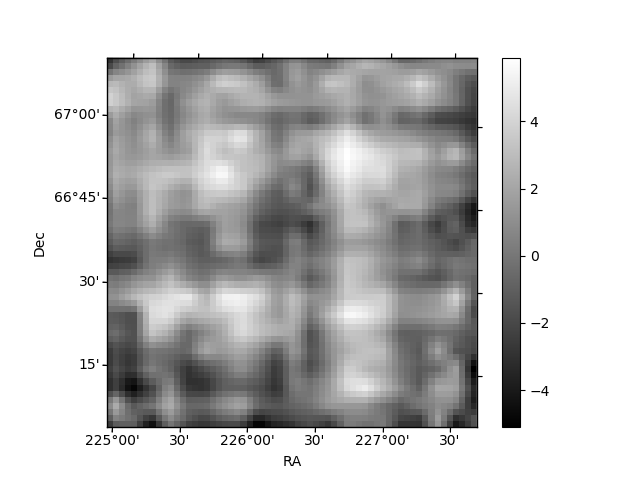
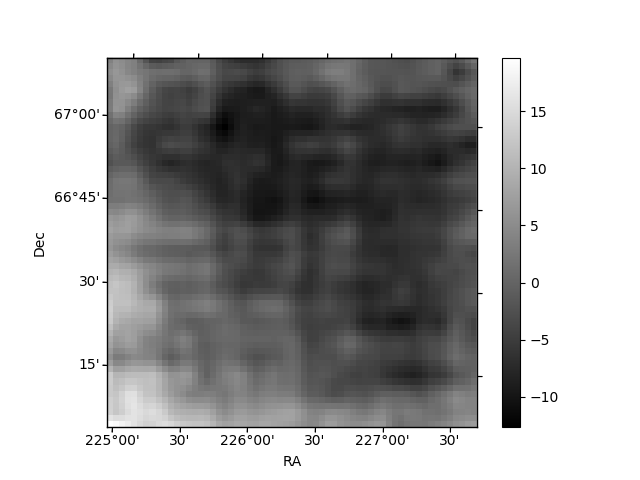
Histogram calculated using DETX and DETY for each event in the final _common_clean file
| Quadrant A | 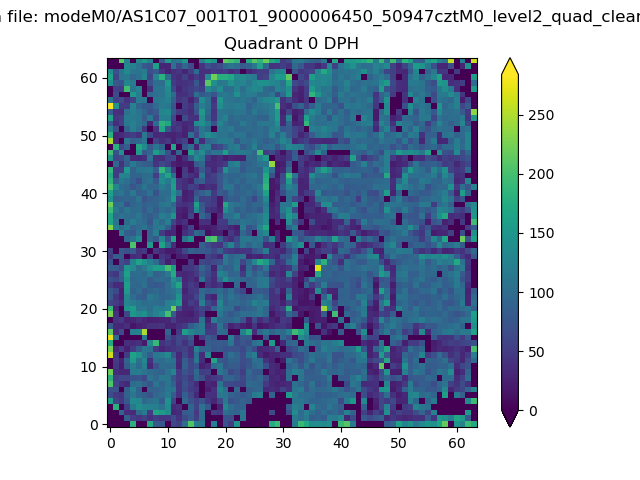 |
 |
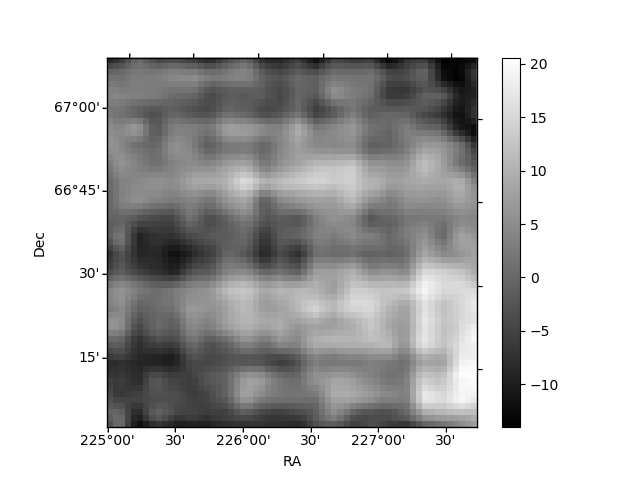
Quadrant B |
|---|---|---|---|
| Quadrant D | 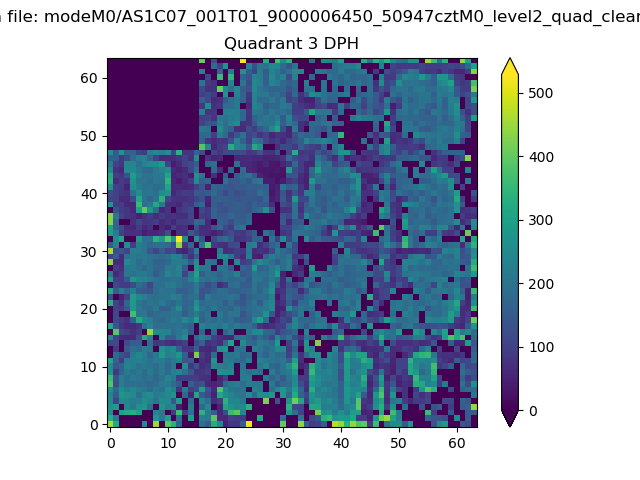 |
 |
Quadrant C |
| Plot type | Count rate plots | Images |
|---|---|---|
| Comparison with Poisson distribution Blue bars denote a histogram of data divided into 1 sec bins. Red curve is a Poisson curve with rate = median count rate of data. |
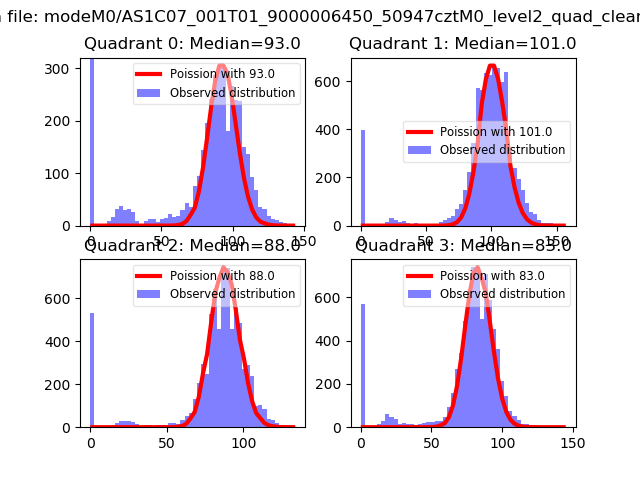 |
 |
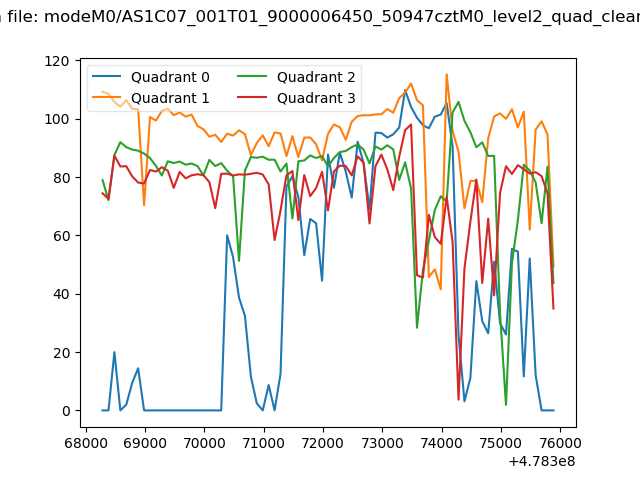
| Quadrant-wise count rates Data is divided into 100 sec bins |
 |
|
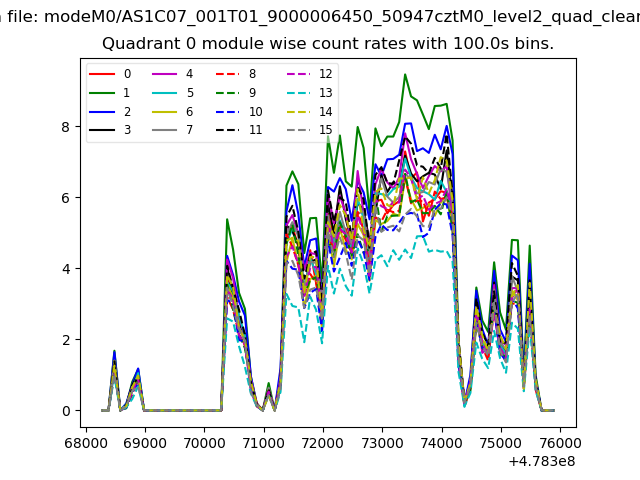
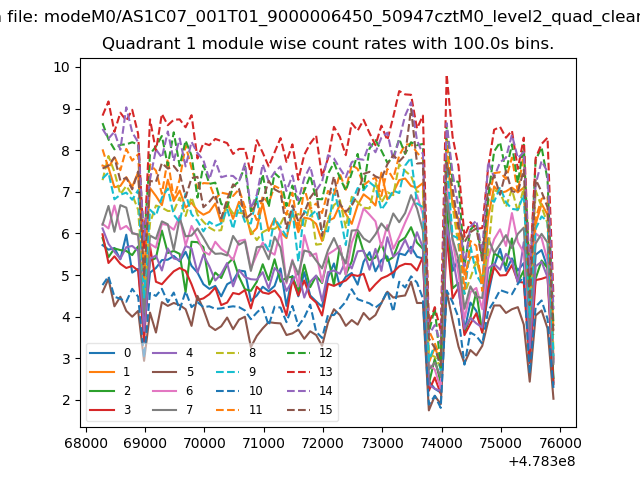
| Module-wise count rates for Quadrant A Data is divided into 100 sec bins |
 |
 |
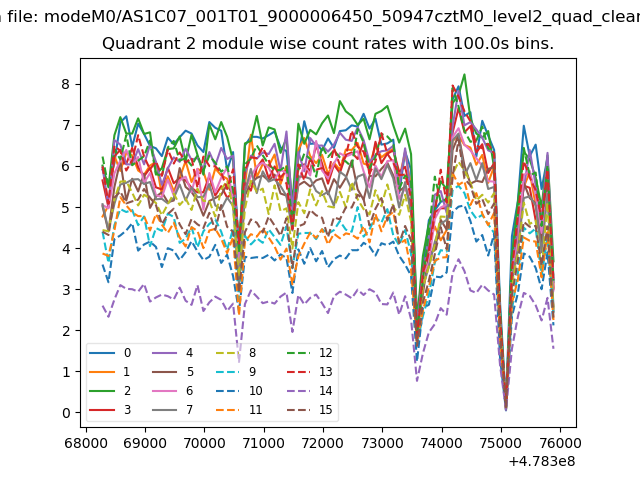
| Module-wise count rates for Quadrant B Data is divided into 100 sec bins |
 |
 |
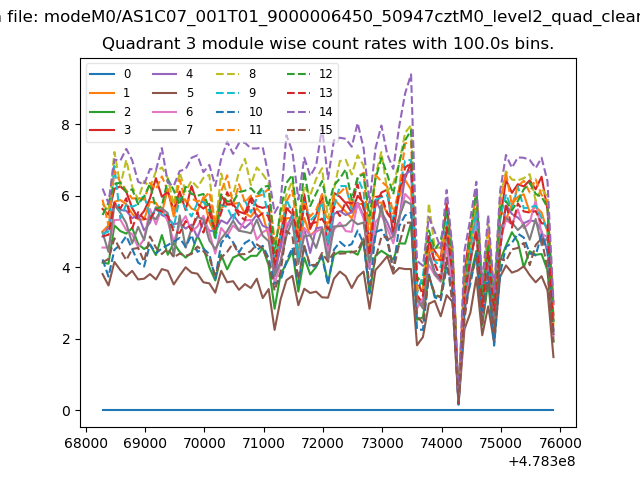
| Module-wise count rates for Quadrant C Data is divided into 100 sec bins |
 |
 |
| Module-wise count rates for Quadrant D Data is divided into 100 sec bins |
 |
 |
| Parameter | Plot |
|---|---|
| CZT HV Monitor | 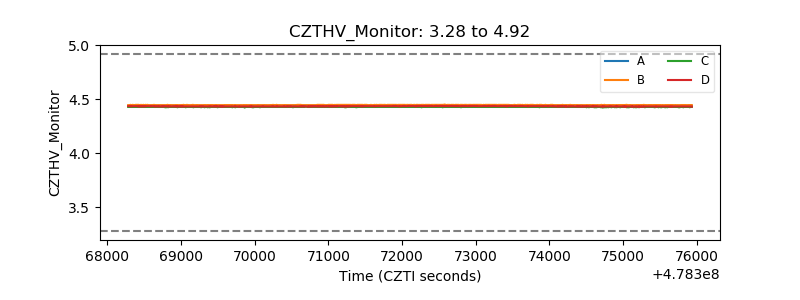 |
| D_VDD | 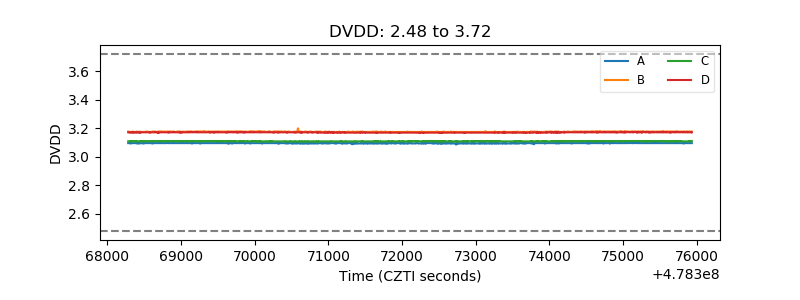 |
| Temperature 1 | 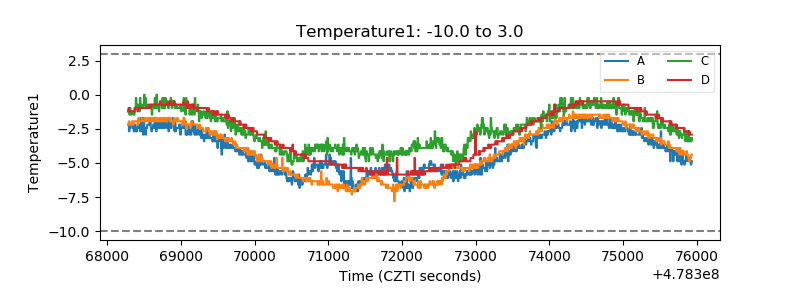 |
| Veto HV Monitor | 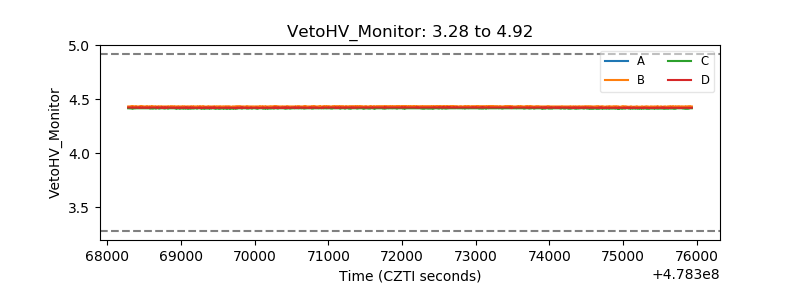 |
| Veto LLD | 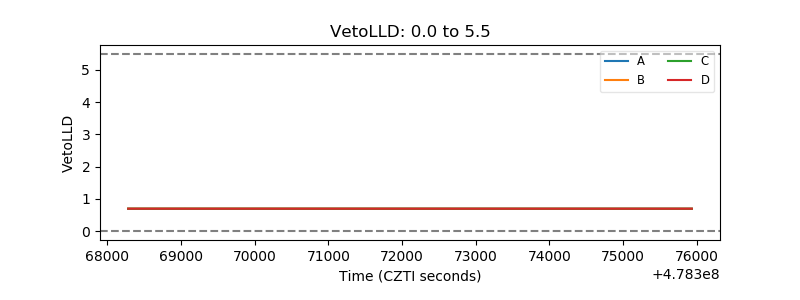 |
| Alpha Counter | 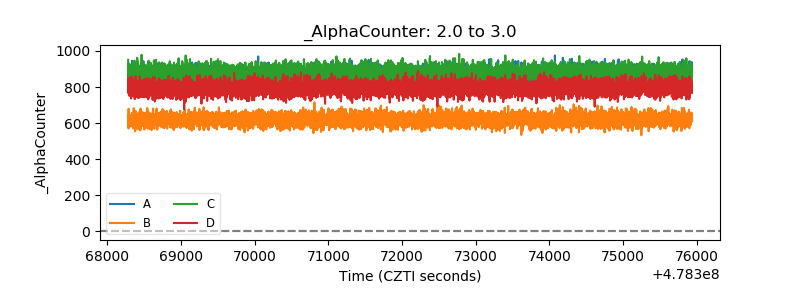 |
| _CPM_Rate | 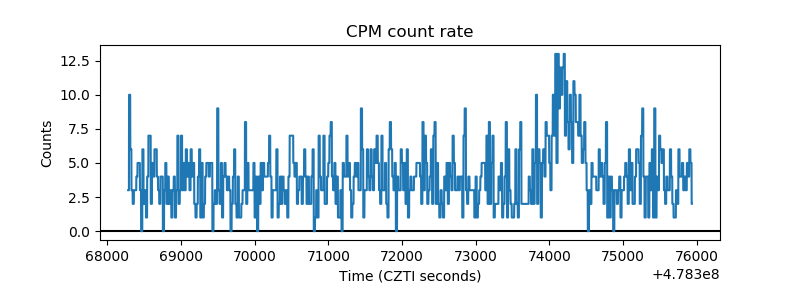 |
| CZT Counter | 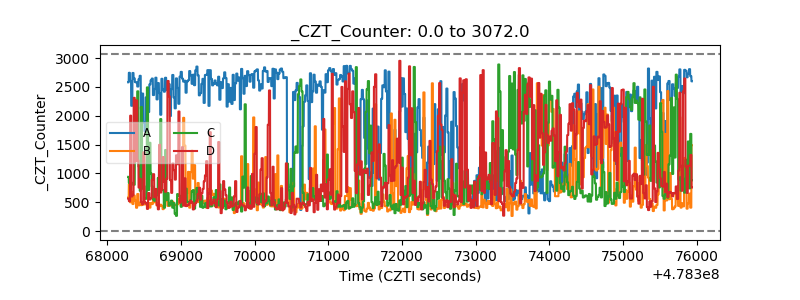 |
| +2.5 Volts monitor | 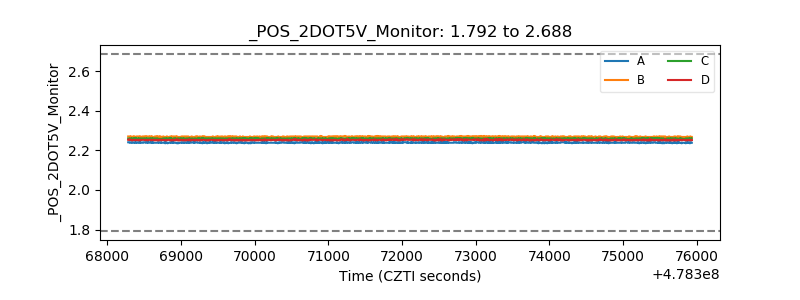 |
| +5 Volts monitor |  |
| _ROLL_ROT | 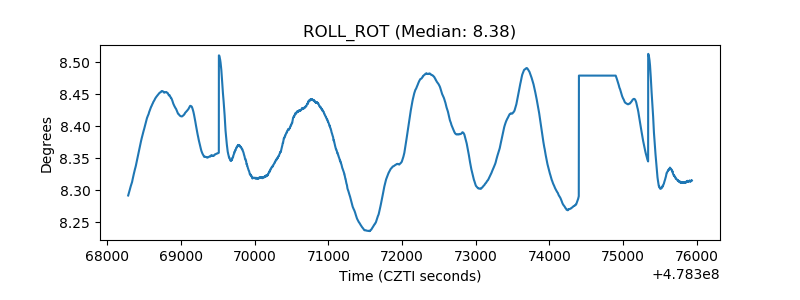 |
| _Roll_DEC | 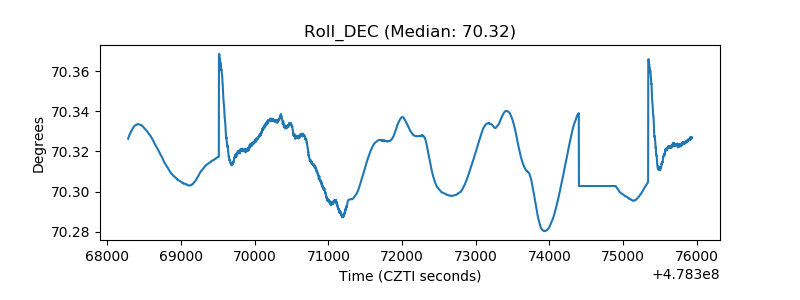 |
| _Roll_RA | 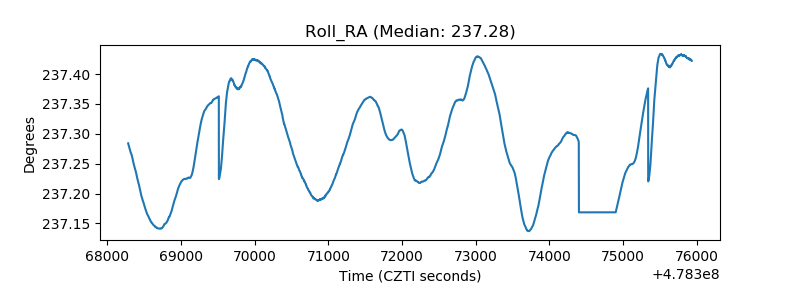 |
| Veto Counter | 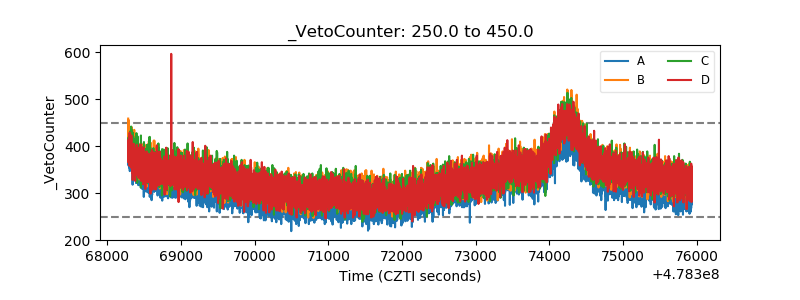 |