| Param | Original file | Final file |
|---|---|---|
| Filename | modeM0/AS1C07_001T01_9000006450_50948cztM0_level2.fits | modeM0/AS1C07_001T01_9000006450_50948cztM0_level2_quad_clean.evt |
| Size (bytes) | 944,879,040 | 89,354,880 |
| Size | 901.1 MB | 85.2 MB |
| Events in quadrant A | 12,978,986 | 375,533 |
| Events in quadrant B | 6,423,702 | 690,663 |
| Events in quadrant C | 5,889,331 | 610,917 |
| Events in quadrant D | 9,118,460 | 517,867 |
| Mode SS | |||
|---|---|---|---|
| Quadrant | BADHDUFLAG | Total packets | Discarded packets |
| A | 0 | 146 | 0 |
| B | 0 | 146 | 0 |
| C | 0 | 146 | 0 |
| D | 0 | 146 | 0 |
| Mode M0 | |||
|---|---|---|---|
| Quadrant | BADHDUFLAG | Total packets | Discarded packets |
| A | 0 | 43661 | 0 |
| B | 0 | 24183 | 0 |
| C | 0 | 22567 | 0 |
| D | 0 | 32097 | 0 |
| Quadrant | Total seconds | Saturated seconds | Saturation percentage |
|---|---|---|---|
| A | 7330 | 3582 | 48.867667% |
| B | 7331 | 744 | 10.148684% |
| C | 7331 | 506 | 6.902196% |
| D | 7331 | 1471 | 20.065475% |
Noise dominated data is calculated using 1-second bins in cleaned event files. If a bin has >2000 counts, and if more than 50% of those come from <1% of pixels, then it is considered to be noise-dominated and hence unusable.
| Quadrant | # 1 sec bins | Bins with >0 counts | Bins with >2000 counts | High rate bins dominated by noise | Noise dominated (total time) | Noise dominated (detector-on time) | Marked lightcurve |
|---|---|---|---|---|---|---|---|
| A | 7330 | 7330 | 3251 | 3251 | 44.35% | 44.35% | 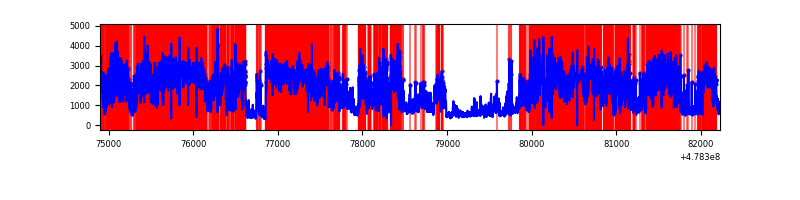 |
| B | 7331 | 7330 | 488 | 488 | 6.66% | 6.66% | 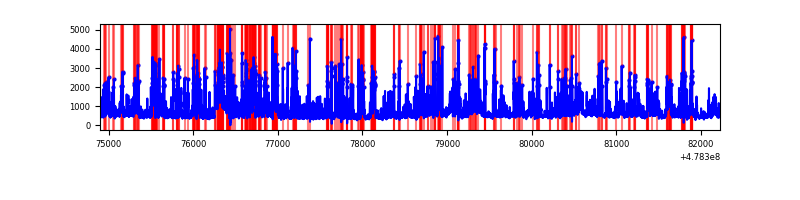 |
| C | 7331 | 7331 | 411 | 411 | 5.61% | 5.61% | 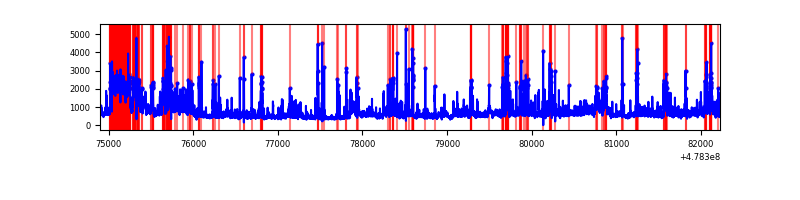 |
| D | 7330 | 7330 | 1497 | 1497 | 20.42% | 20.42% | 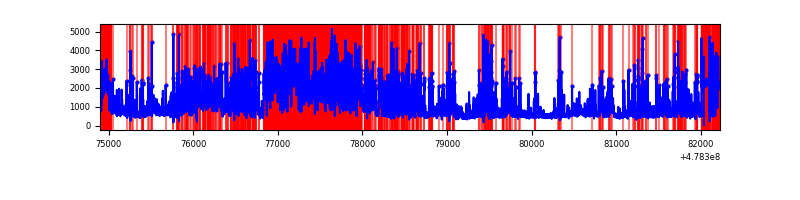 |
Top three noisy pixels from each quadrant. If the there are fewer than three noisy pixels in the level2.evt file, extra rows are filled as -1
| Pixel properties | Quadrant properties | ||||||
|---|---|---|---|---|---|---|---|
| Quadrant | DetID | PixID | Counts | Sigma | Mean | Median | Sigma |
| A | 8 | 43 | 6726989 | 45068.62 | 588 | 573 | 149.2 |
| A | 7 | 206 | 1742333 | 11670.22 | 588 | 573 | 149.2 |
| A | 9 | 13 | 720460 | 4823.42 | 588 | 573 | 149.2 |
| B | 4 | 206 | 2280348 | 14713.19 | 736 | 711 | 154.9 |
| B | 12 | 3 | 385428 | 2483.03 | 736 | 711 | 154.9 |
| B | 4 | 171 | 176436 | 1134.16 | 736 | 711 | 154.9 |
| C | 0 | 193 | 667207 | 3314.45 | 730 | 727 | 201.1 |
| C | 12 | 247 | 537351 | 2668.67 | 730 | 727 | 201.1 |
| C | 14 | 245 | 250764 | 1243.45 | 730 | 727 | 201.1 |
| D | 8 | 176 | 4493104 | 23024.29 | 685 | 661 | 195.1 |
| D | 15 | 184 | 332153 | 1698.94 | 685 | 661 | 195.1 |
| D | 10 | 181 | 291329 | 1489.71 | 685 | 661 | 195.1 |
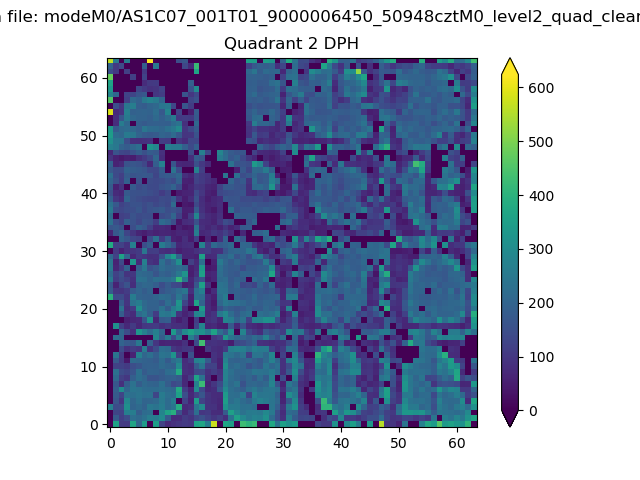
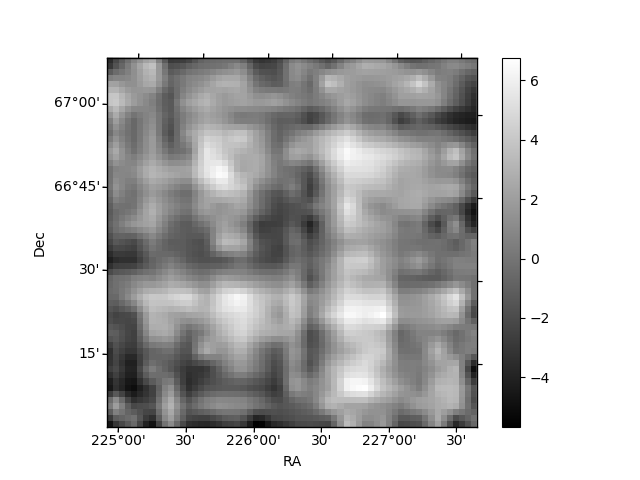
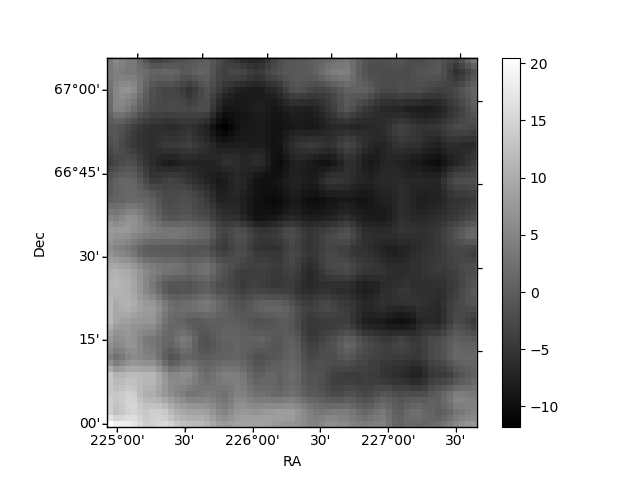
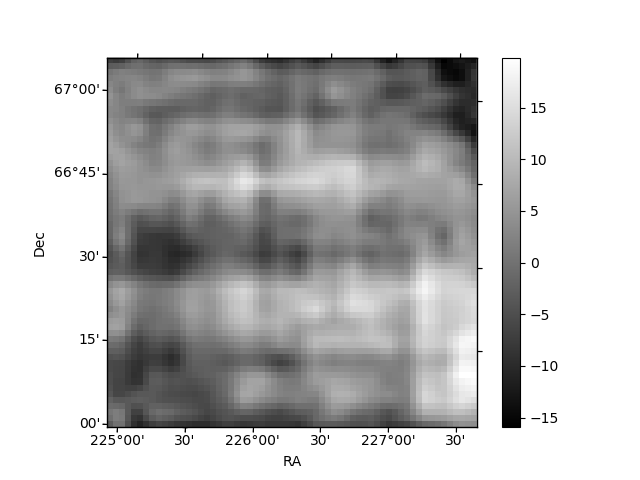
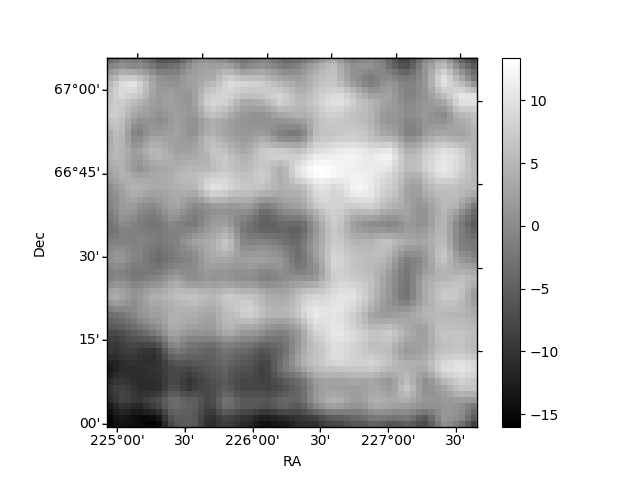
Histogram calculated using DETX and DETY for each event in the final _common_clean file
| Quadrant A | 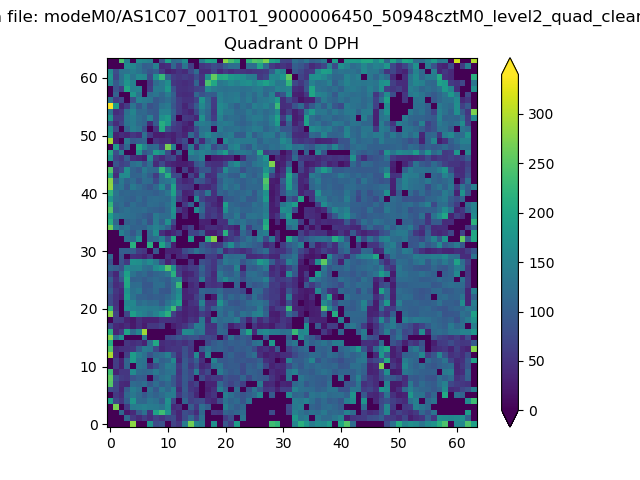 |
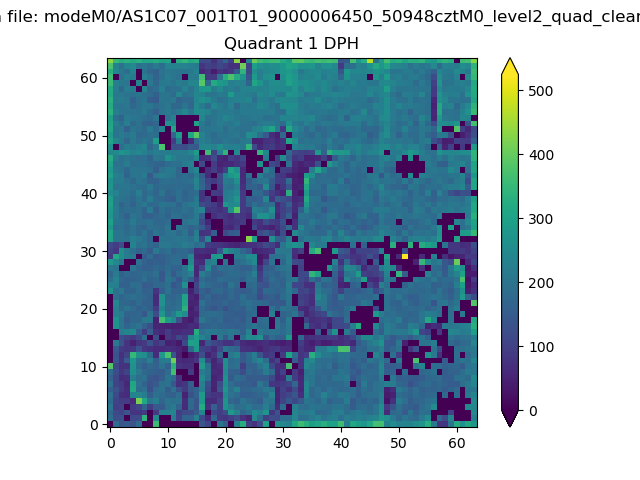 |
Quadrant B |
|---|---|---|---|
| Quadrant D | 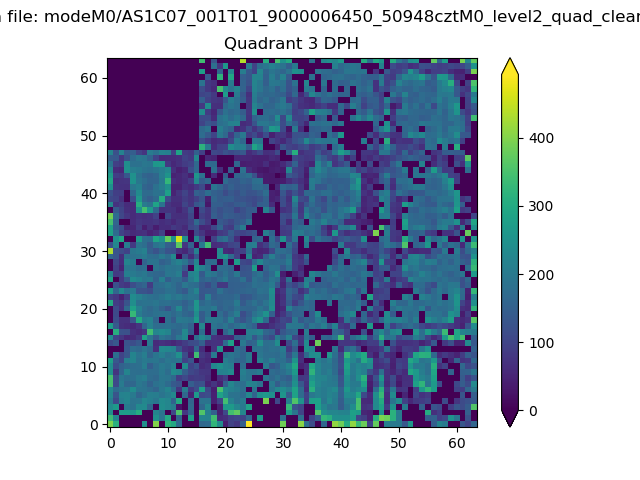 |
 |
Quadrant C |
| Plot type | Count rate plots | Images |
|---|---|---|
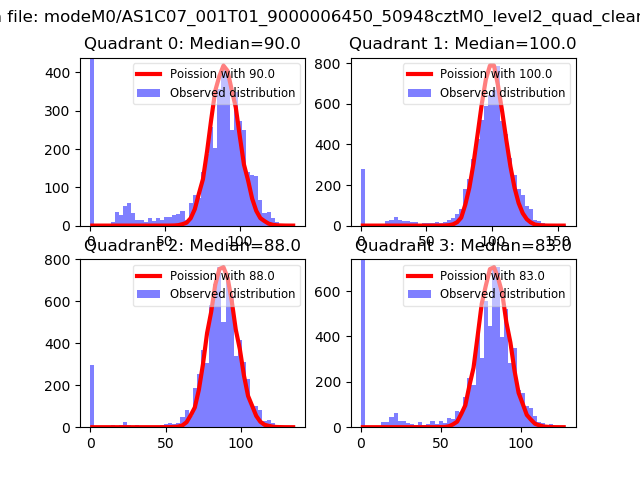
| Comparison with Poisson distribution Blue bars denote a histogram of data divided into 1 sec bins. Red curve is a Poisson curve with rate = median count rate of data. |
 |
 |
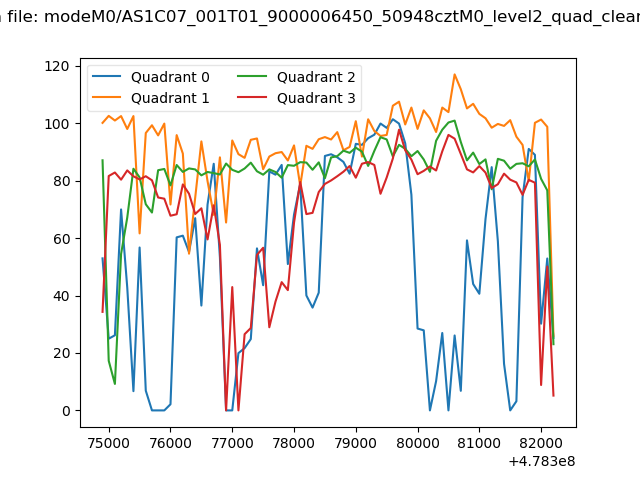
| Quadrant-wise count rates Data is divided into 100 sec bins |
 |
|
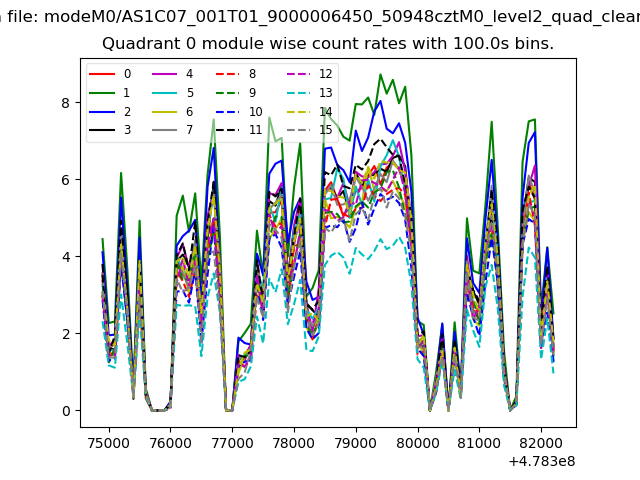
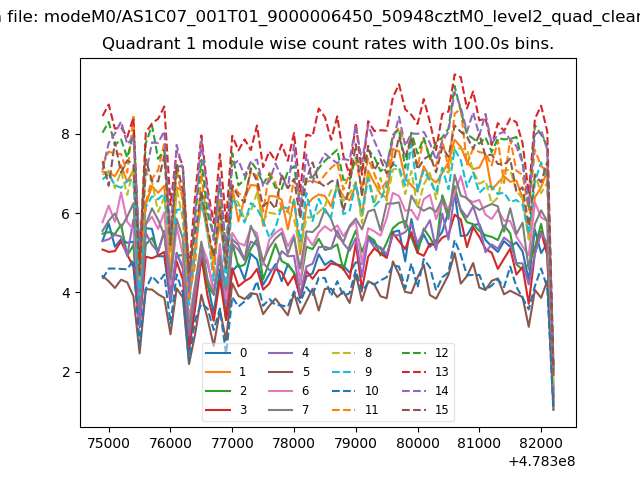
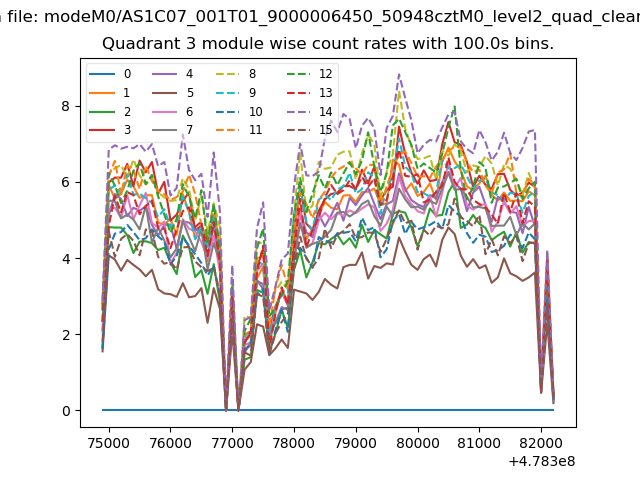
| Module-wise count rates for Quadrant A Data is divided into 100 sec bins |
 |
 |
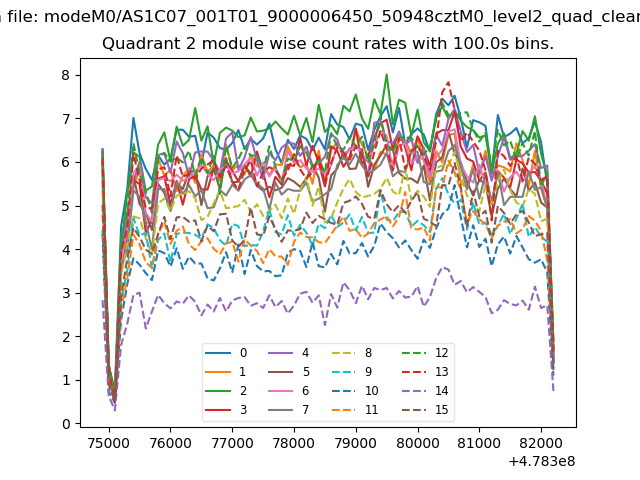
| Module-wise count rates for Quadrant B Data is divided into 100 sec bins |
 |
 |
| Module-wise count rates for Quadrant C Data is divided into 100 sec bins |
 |
 |
| Module-wise count rates for Quadrant D Data is divided into 100 sec bins |
 |
 |
| Parameter | Plot |
|---|---|
| CZT HV Monitor |  |
| D_VDD | 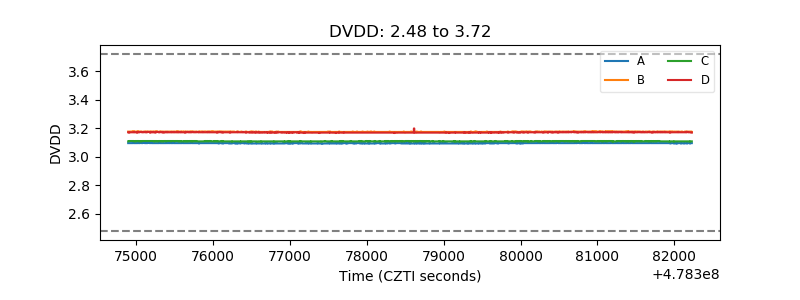 |
| Temperature 1 | 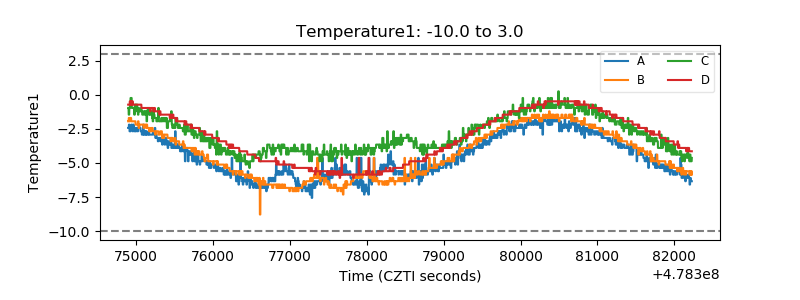 |
| Veto HV Monitor | 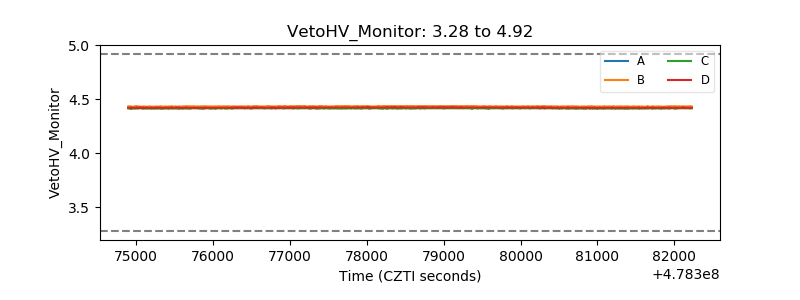 |
| Veto LLD | 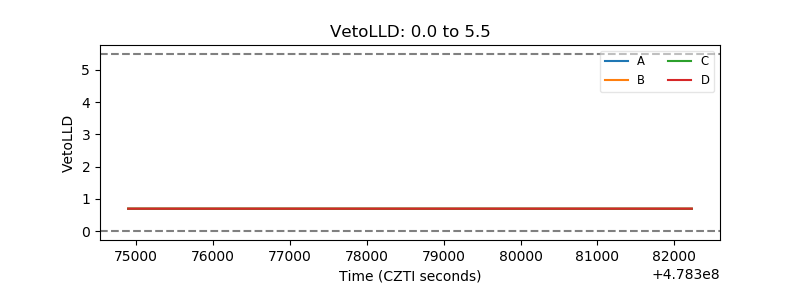 |
| Alpha Counter | 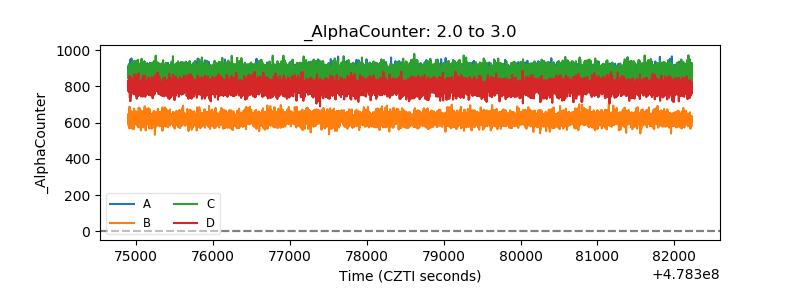 |
| _CPM_Rate | 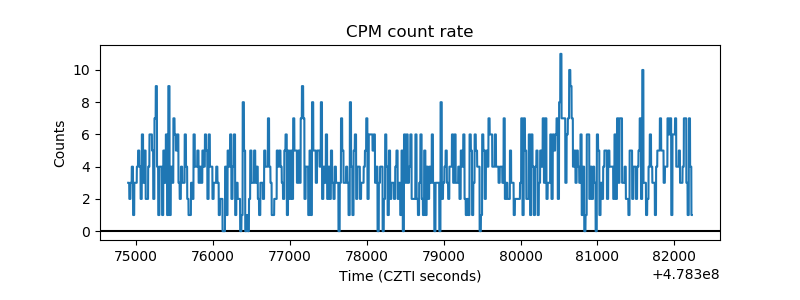 |
| CZT Counter | 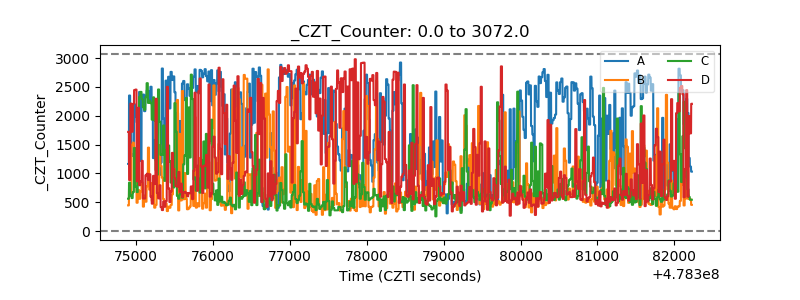 |
| +2.5 Volts monitor | 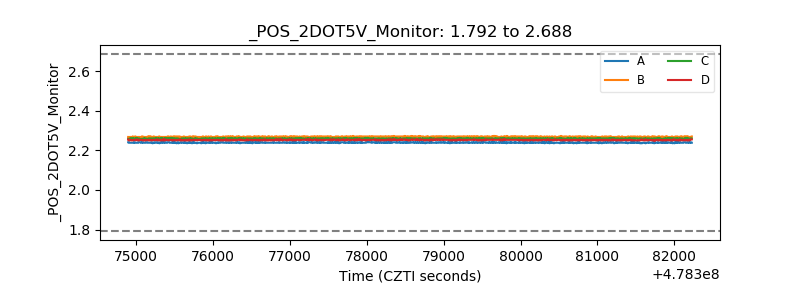 |
| +5 Volts monitor | 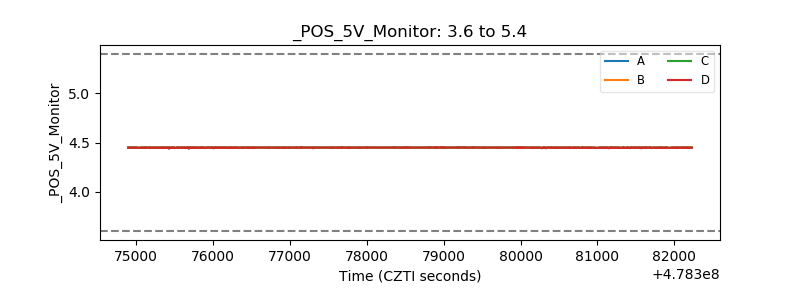 |
| _ROLL_ROT | 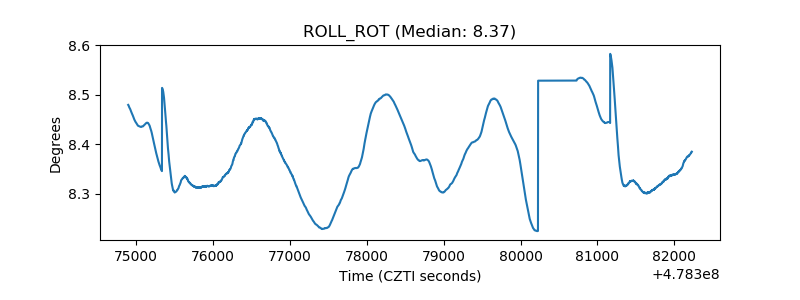 |
| _Roll_DEC | 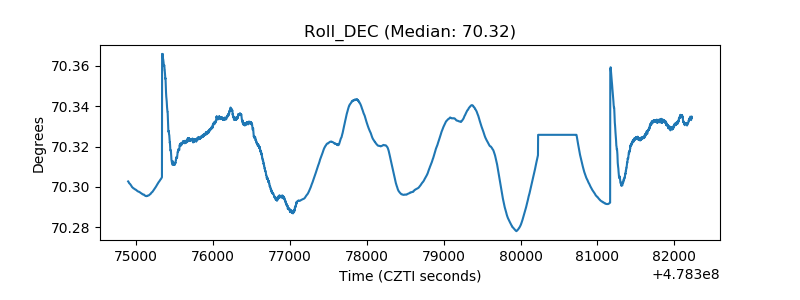 |
| _Roll_RA | 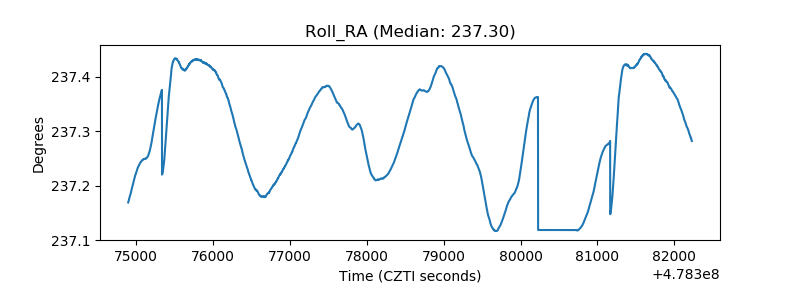 |
| Veto Counter | 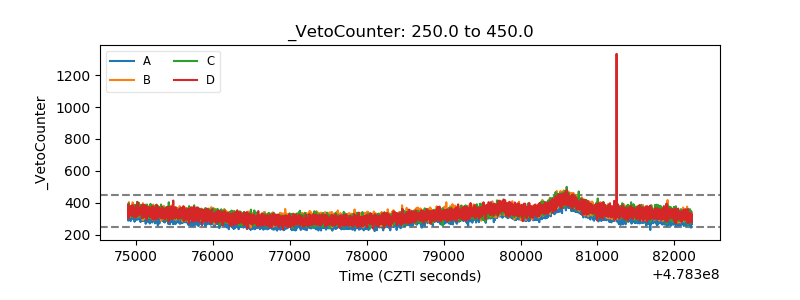 |