| Param | Original file | Final file |
|---|---|---|
| Filename | modeM0/AS1C07_001T01_9000006450_50949cztM0_level2.fits | modeM0/AS1C07_001T01_9000006450_50949cztM0_level2_quad_clean.evt |
| Size (bytes) | 1,001,070,720 | 94,104,000 |
| Size | 954.7 MB | 89.7 MB |
| Events in quadrant A | 12,846,732 | 414,061 |
| Events in quadrant B | 5,570,305 | 763,914 |
| Events in quadrant C | 7,715,586 | 641,073 |
| Events in quadrant D | 10,320,526 | 486,436 |
| Mode SS | |||
|---|---|---|---|
| Quadrant | BADHDUFLAG | Total packets | Discarded packets |
| A | 0 | 158 | 0 |
| B | 0 | 158 | 0 |
| C | 0 | 156 | 0 |
| D | 0 | 156 | 0 |
| Mode M0 | |||
|---|---|---|---|
| Quadrant | BADHDUFLAG | Total packets | Discarded packets |
| A | 0 | 43584 | 0 |
| B | 0 | 22033 | 0 |
| C | 0 | 28433 | 1 |
| D | 0 | 36037 | 0 |
| Quadrant | Total seconds | Saturated seconds | Saturation percentage |
|---|---|---|---|
| A | 7813 | 3544 | 45.360297% |
| B | 7813 | 424 | 5.426853% |
| C | 7812 | 836 | 10.701485% |
| D | 7812 | 2240 | 28.673835% |
Noise dominated data is calculated using 1-second bins in cleaned event files. If a bin has >2000 counts, and if more than 50% of those come from <1% of pixels, then it is considered to be noise-dominated and hence unusable.
| Quadrant | # 1 sec bins | Bins with >0 counts | Bins with >2000 counts | High rate bins dominated by noise | Noise dominated (total time) | Noise dominated (detector-on time) | Marked lightcurve |
|---|---|---|---|---|---|---|---|
| A | 7813 | 7813 | 3115 | 3115 | 39.87% | 39.87% | 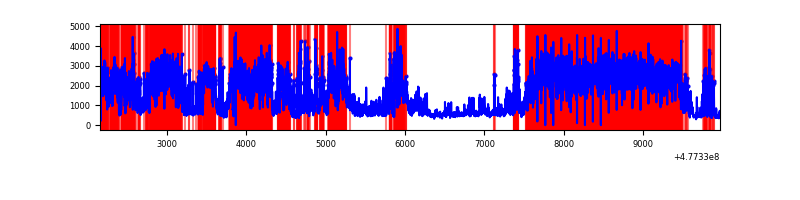 |
| B | 7813 | 7813 | 260 | 260 | 3.33% | 3.33% | 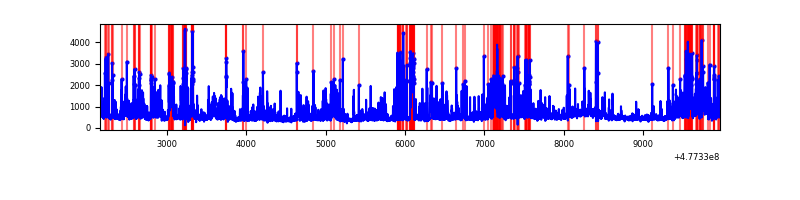 |
| C | 7812 | 7812 | 732 | 732 | 9.37% | 9.37% | 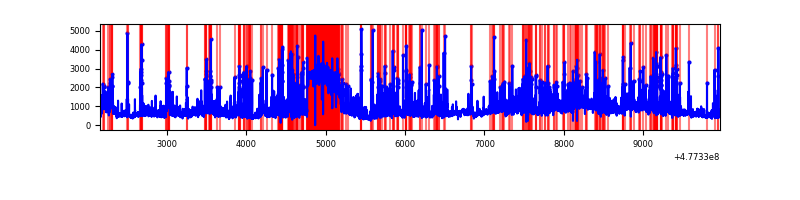 |
| D | 7812 | 7812 | 2065 | 2065 | 26.43% | 26.43% | 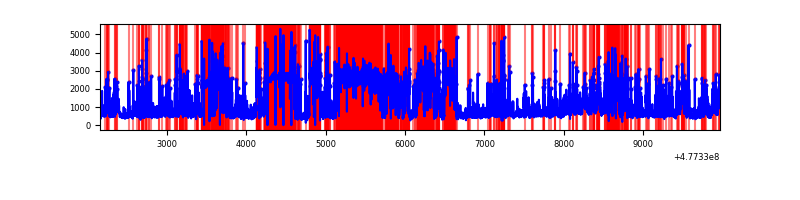 |
Top three noisy pixels from each quadrant. If the there are fewer than three noisy pixels in the level2.evt file, extra rows are filled as -1
| Pixel properties | Quadrant properties | ||||||
|---|---|---|---|---|---|---|---|
| Quadrant | DetID | PixID | Counts | Sigma | Mean | Median | Sigma |
| A | 8 | 43 | 6474652 | 40850.8 | 622 | 605 | 158.5 |
| A | 7 | 206 | 1635623 | 10316.85 | 622 | 605 | 158.5 |
| A | 9 | 13 | 599019 | 3775.95 | 622 | 605 | 158.5 |
| B | 4 | 206 | 1021037 | 5966.7 | 808 | 780 | 171.0 |
| B | 12 | 3 | 351672 | 2052.1 | 808 | 780 | 171.0 |
| B | 10 | 247 | 283645 | 1654.26 | 808 | 780 | 171.0 |
| C | 15 | 147 | 1263312 | 5940.6 | 775 | 769 | 212.5 |
| C | 12 | 247 | 1006965 | 4734.42 | 775 | 769 | 212.5 |
| C | 13 | 3 | 463490 | 2177.23 | 775 | 769 | 212.5 |
| D | 15 | 184 | 4071092 | 21179.55 | 691 | 667 | 192.2 |
| D | 8 | 176 | 1234650 | 6420.75 | 691 | 667 | 192.2 |
| D | 10 | 181 | 336166 | 1745.69 | 691 | 667 | 192.2 |
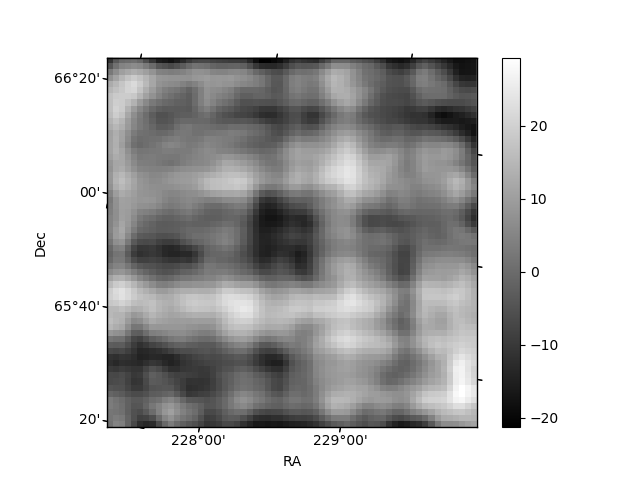
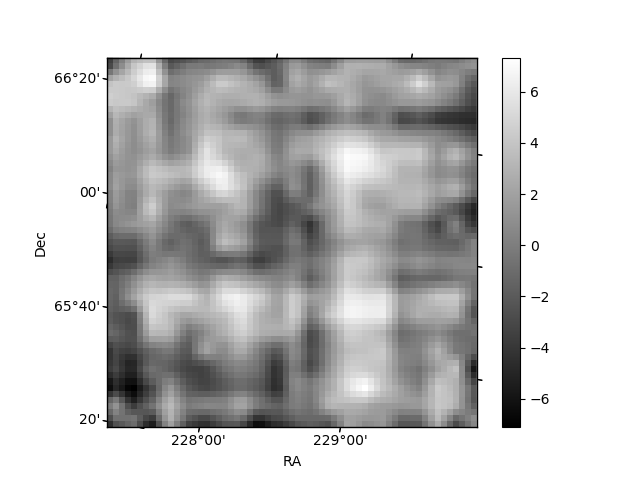
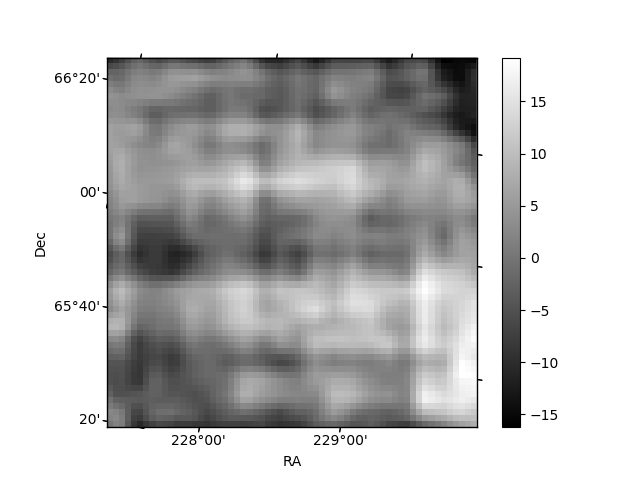
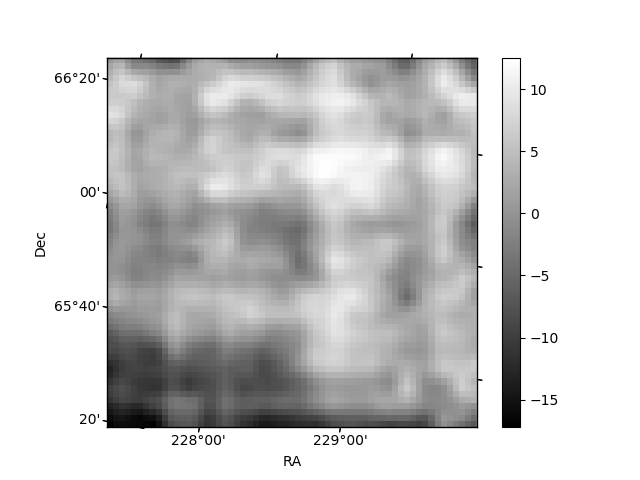
Histogram calculated using DETX and DETY for each event in the final _common_clean file
| Quadrant A | 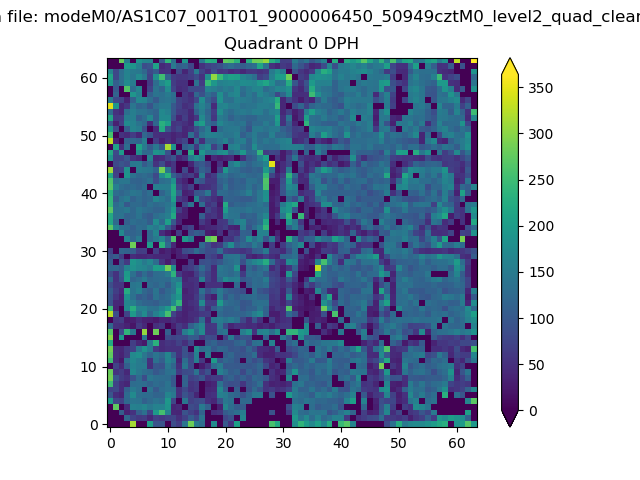 |
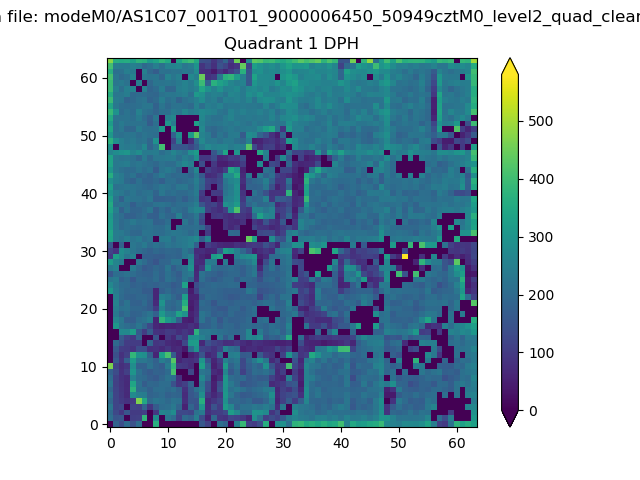 |
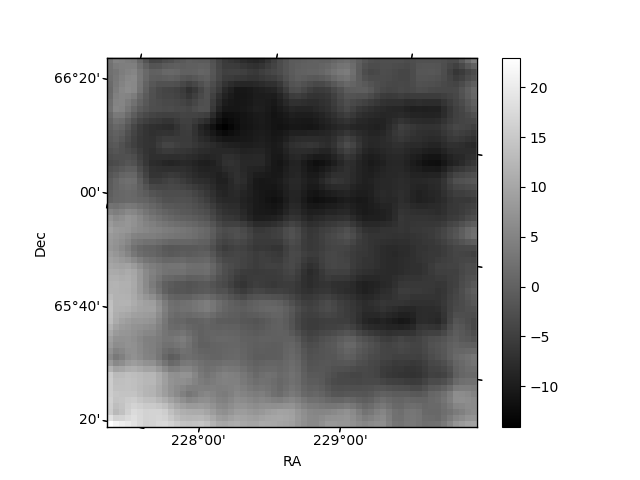
Quadrant B |
|---|---|---|---|
| Quadrant D | 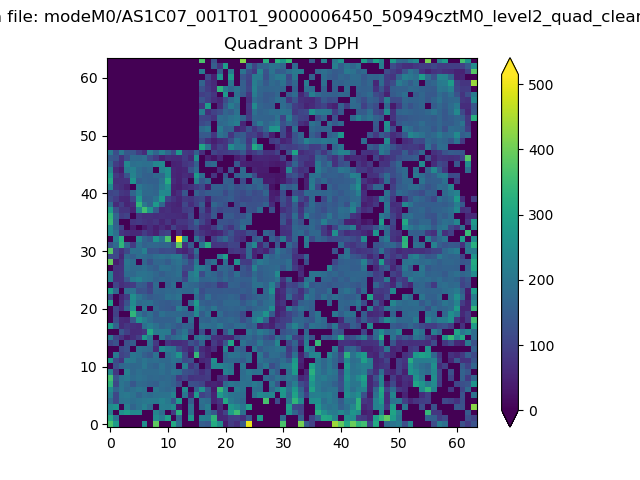 |
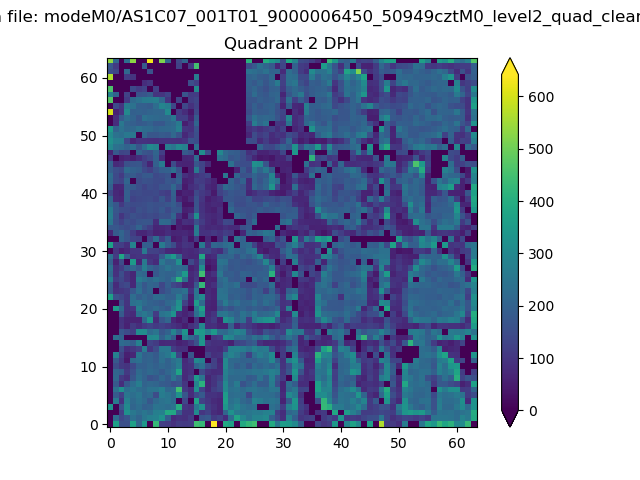 |
Quadrant C |
| Plot type | Count rate plots | Images |
|---|---|---|
| Comparison with Poisson distribution Blue bars denote a histogram of data divided into 1 sec bins. Red curve is a Poisson curve with rate = median count rate of data. |
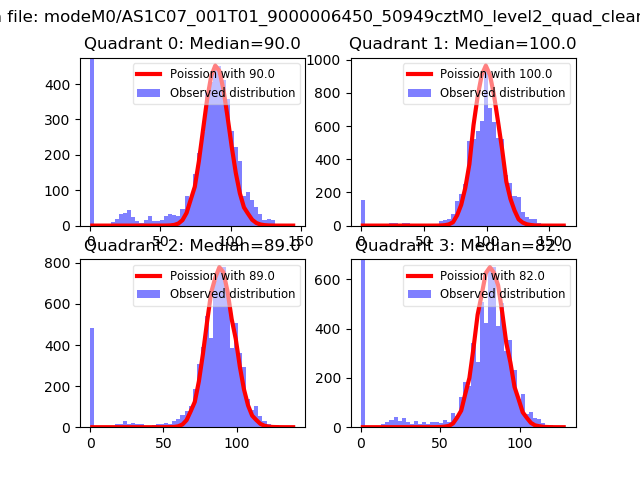 |
 |
| Quadrant-wise count rates Data is divided into 100 sec bins |
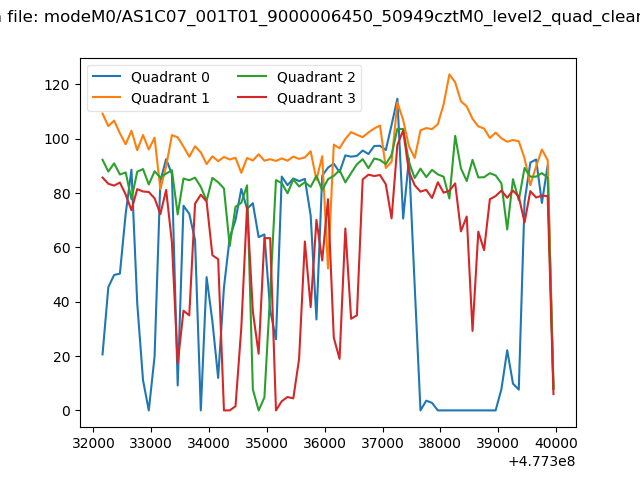 |
|
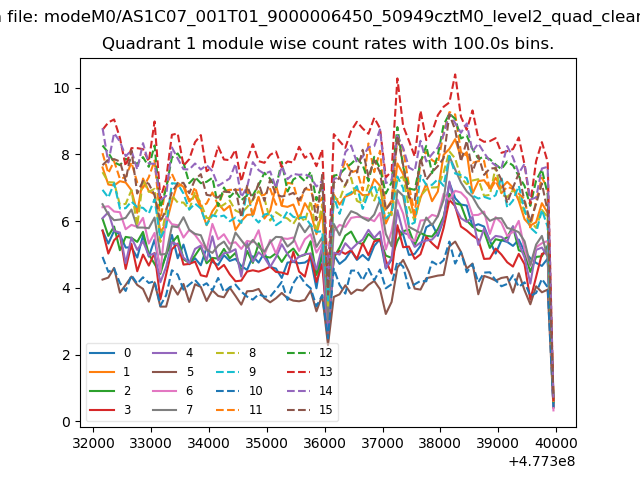
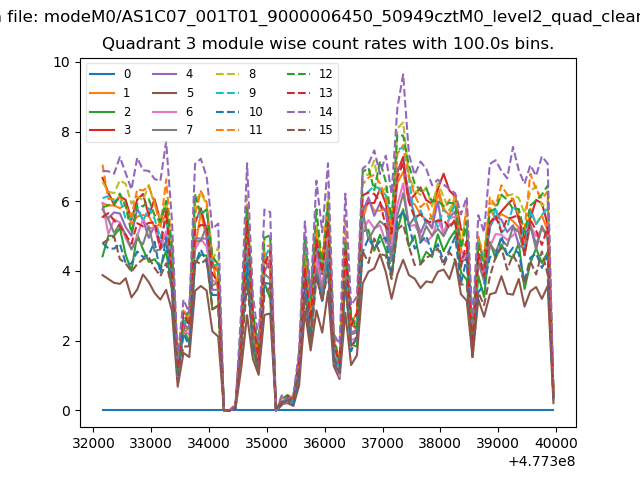
| Module-wise count rates for Quadrant A Data is divided into 100 sec bins |
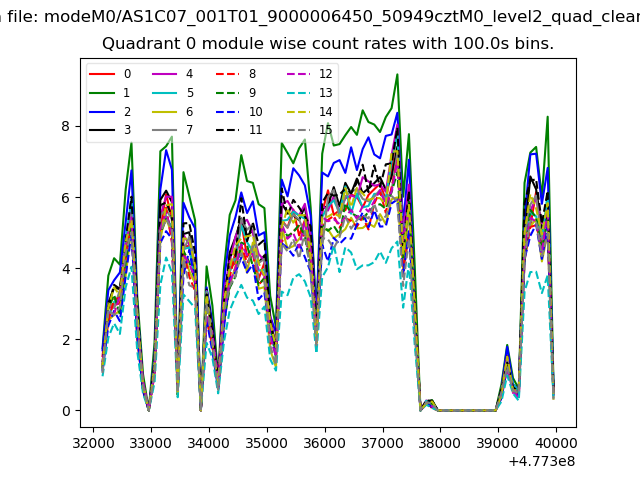 |
 |
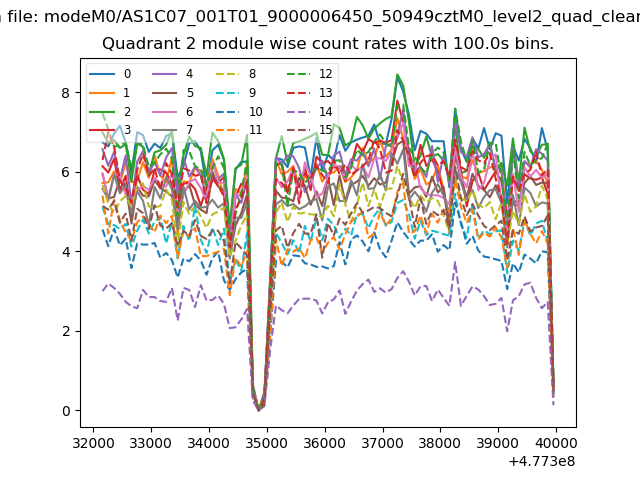
| Module-wise count rates for Quadrant B Data is divided into 100 sec bins |
 |
 |
| Module-wise count rates for Quadrant C Data is divided into 100 sec bins |
 |
 |
| Module-wise count rates for Quadrant D Data is divided into 100 sec bins |
 |
 |
| Parameter | Plot |
|---|---|
| CZT HV Monitor | 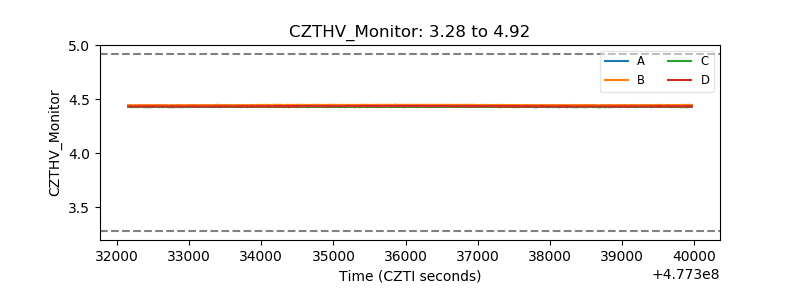 |
| D_VDD | 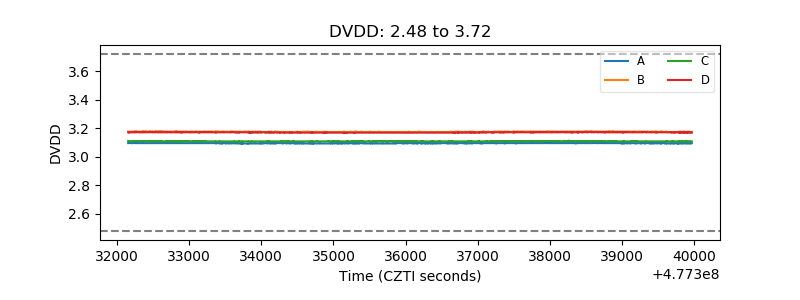 |
| Temperature 1 | 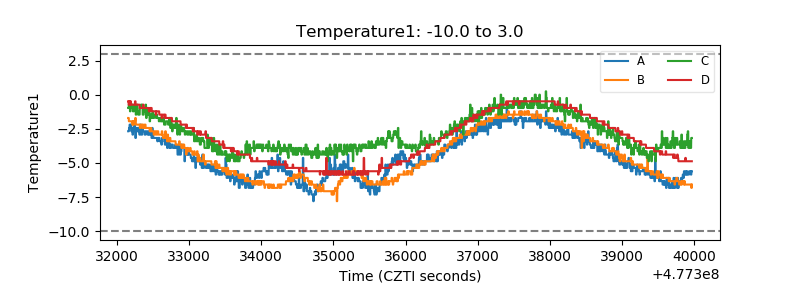 |
| Veto HV Monitor | 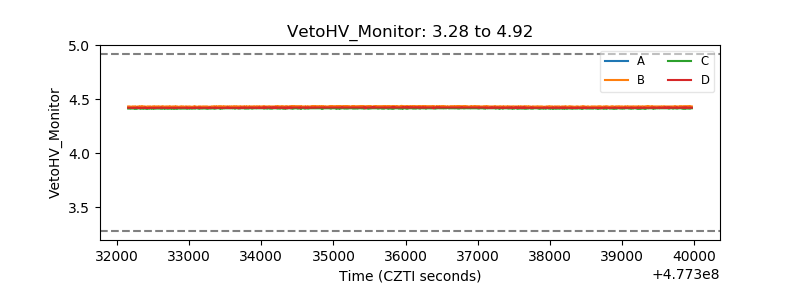 |
| Veto LLD | 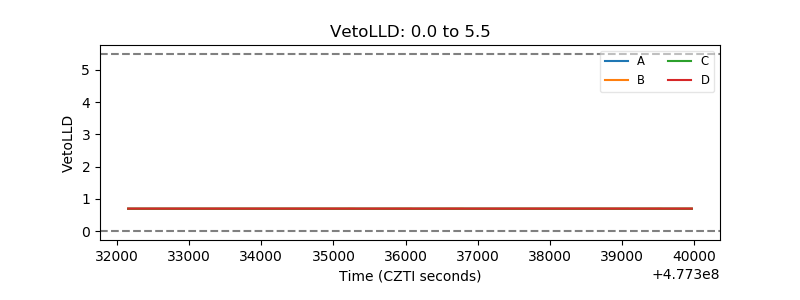 |
| Alpha Counter | 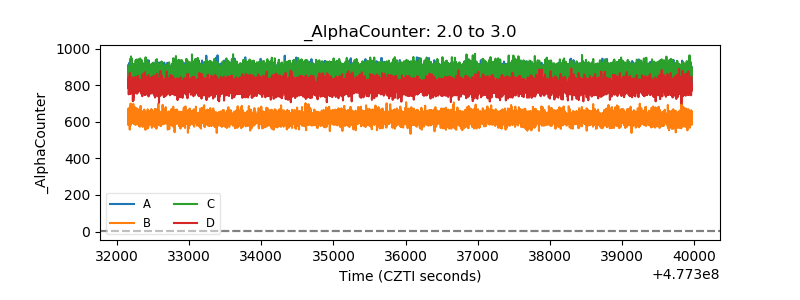 |
| _CPM_Rate | 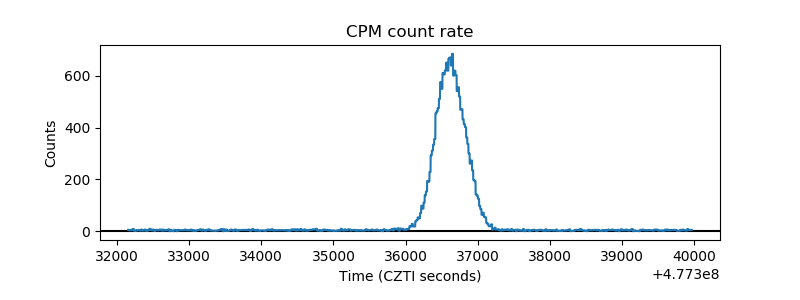 |
| CZT Counter | 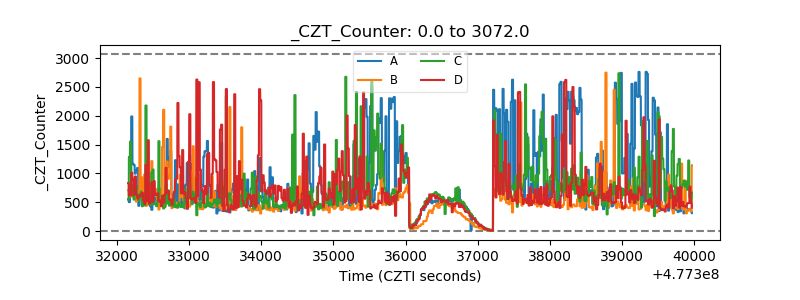 |
| +2.5 Volts monitor | 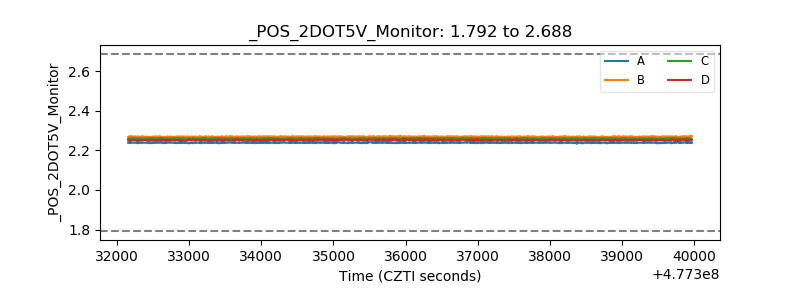 |
| +5 Volts monitor | 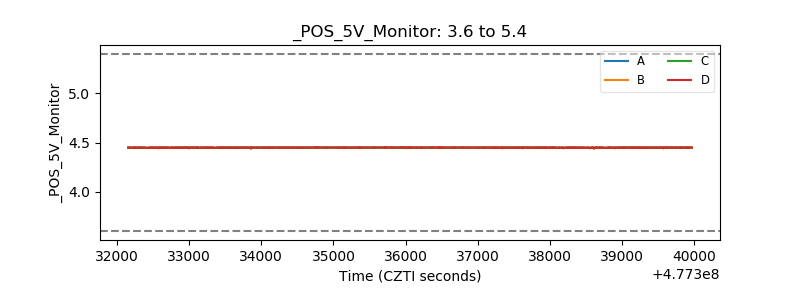 |
| _ROLL_ROT | 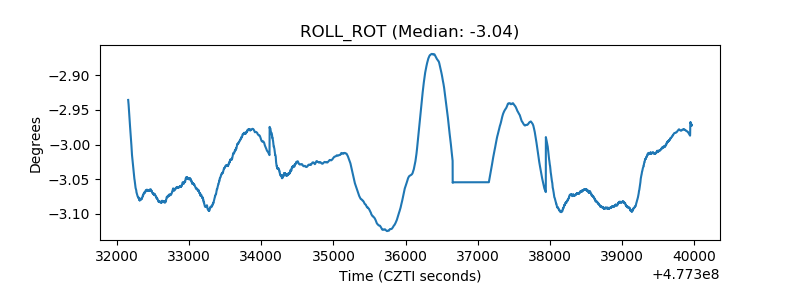 |
| _Roll_DEC | 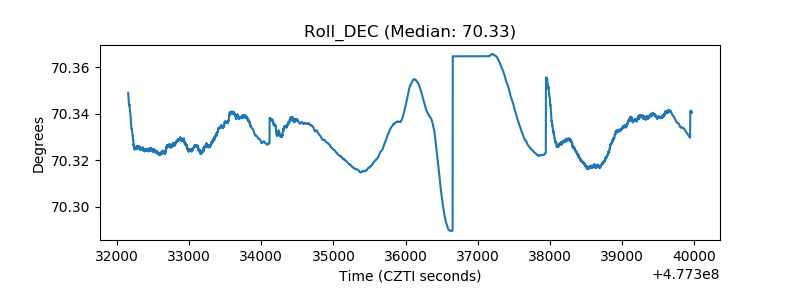 |
| _Roll_RA | 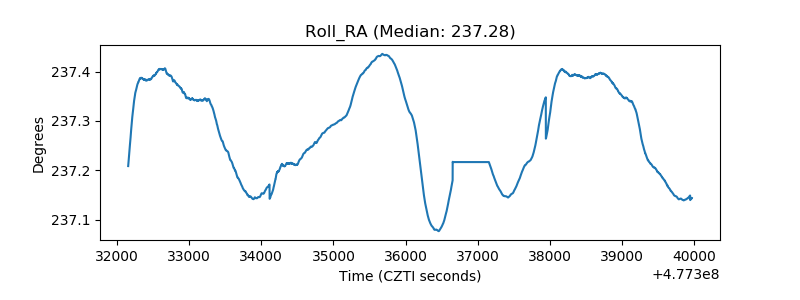 |
| Veto Counter | 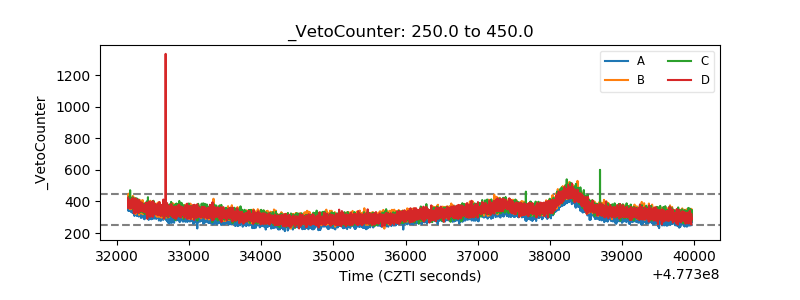 |