| Param | Original file | Final file |
|---|---|---|
| Filename | modeM0/AS1C07_001T02_9000006452cztM0_level2.fits | modeM0/AS1C07_001T02_9000006452cztM0_level2_quad_clean.evt |
| Size (bytes) | 3,898,483,200 | 5,581,010,880 |
| Size | 3.6 GB | 5.2 GB |
| Events in quadrant A | 22,508,074 | 35,196,758 |
| Events in quadrant B | 21,847,016 | 38,154,004 |
| Events in quadrant C | 21,678,056 | 33,173,697 |
| Events in quadrant D | 17,836,174 | 28,429,903 |
| Mode SS | |||
|---|---|---|---|
| Quadrant | BADHDUFLAG | Total packets | Discarded packets |
| A | 0 | 10096 | 0 |
| B | 0 | 10097 | 0 |
| C | 0 | 10098 | 0 |
| D | 0 | 10098 | 0 |
| Mode M9 | |||
|---|---|---|---|
| Quadrant | BADHDUFLAG | Total packets | Discarded packets |
| A | 0 | 602 | 0 |
| B | 0 | 602 | 0 |
| C | 0 | 602 | 0 |
| D | 0 | 602 | 0 |
| Mode M0 | |||
|---|---|---|---|
| Quadrant | BADHDUFLAG | Total packets | Discarded packets |
| A | 0 | 1744455 | 0 |
| B | 0 | 1543666 | 0 |
| C | 0 | 1632908 | 0 |
| D | 0 | 1966025 | 0 |
| Quadrant | Total seconds | Saturated seconds | Saturation percentage |
|---|---|---|---|
| A | 497471 | 57193 | 11.496751% |
| B | 497492 | 53751 | 10.804395% |
| C | 497432 | 56348 | 11.327779% |
| D | 497513 | 97765 | 19.650743% |
Noise dominated data is calculated using 1-second bins in cleaned event files. If a bin has >2000 counts, and if more than 50% of those come from <1% of pixels, then it is considered to be noise-dominated and hence unusable.
| Quadrant | # 1 sec bins | Bins with >0 counts | Bins with >2000 counts | High rate bins dominated by noise | Noise dominated (total time) | Noise dominated (detector-on time) | Marked lightcurve |
|---|---|---|---|---|---|---|---|
| A | 599982 | 496176 | 0 | 0 | 0.00% | 0.00% | 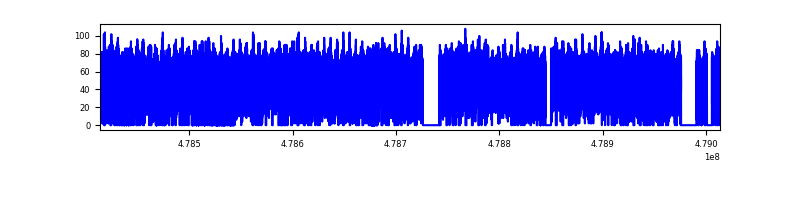 |
| B | 599982 | 495955 | 0 | 0 | 0.00% | 0.00% | 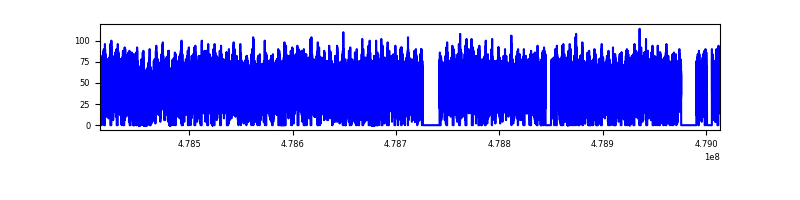 |
| C | 599982 | 495308 | 0 | 0 | 0.00% | 0.00% | 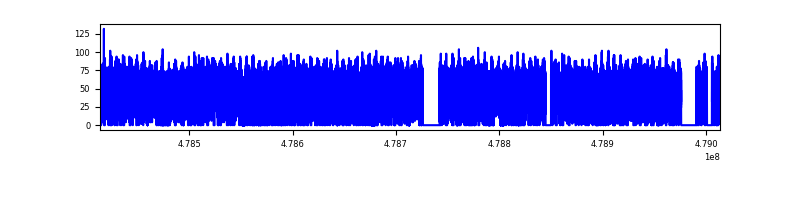 |
| D | 599982 | 488965 | 0 | 0 | 0.00% | 0.00% | 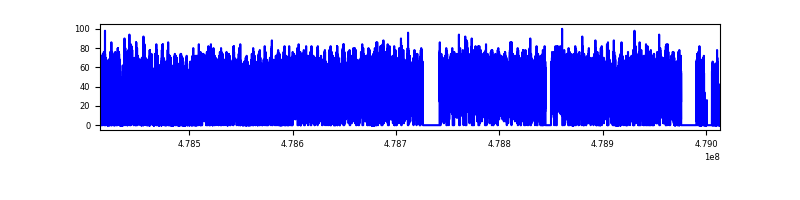 |
Top three noisy pixels from each quadrant. If the there are fewer than three noisy pixels in the level2.evt file, extra rows are filled as -1
| Pixel properties | Quadrant properties | ||||||
|---|---|---|---|---|---|---|---|
| Quadrant | DetID | PixID | Counts | Sigma | Mean | Median | Sigma |
| A | 14 | 188 | 24530 | 9.92 | 5981 | 5566 | 1911.6 |
| A | 9 | 255 | 23902 | 9.59 | 5981 | 5566 | 1911.6 |
| A | 14 | 204 | 19411 | 7.24 | 5981 | 5566 | 1911.6 |
| B | 2 | 9 | 25152 | 14.8 | 5815 | 5532 | 1325.9 |
| B | 2 | 8 | 23039 | 13.2 | 5815 | 5532 | 1325.9 |
| B | 2 | 245 | 17833 | 9.28 | 5815 | 5532 | 1325.9 |
| C | 15 | 127 | 17769 | 6.25 | 5885 | 5377 | 1982.3 |
| C | 2 | 31 | 17529 | 6.13 | 5885 | 5377 | 1982.3 |
| C | 6 | 64 | 17361 | 6.05 | 5885 | 5377 | 1982.3 |
| D | 6 | 218 | 23215 | 10.78 | 5167 | 4592 | 1727.4 |
| D | 14 | 31 | 16049 | 6.63 | 5167 | 4592 | 1727.4 |
| D | 11 | 3 | 15742 | 6.45 | 5167 | 4592 | 1727.4 |
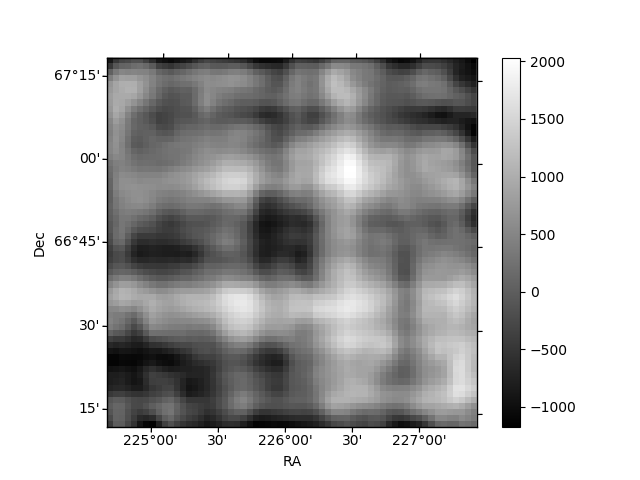
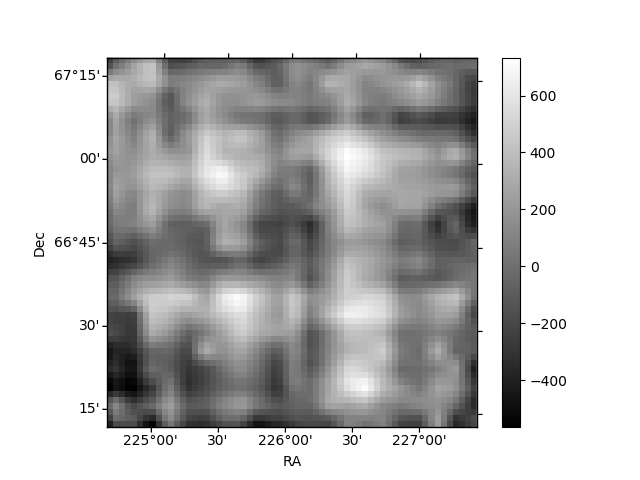
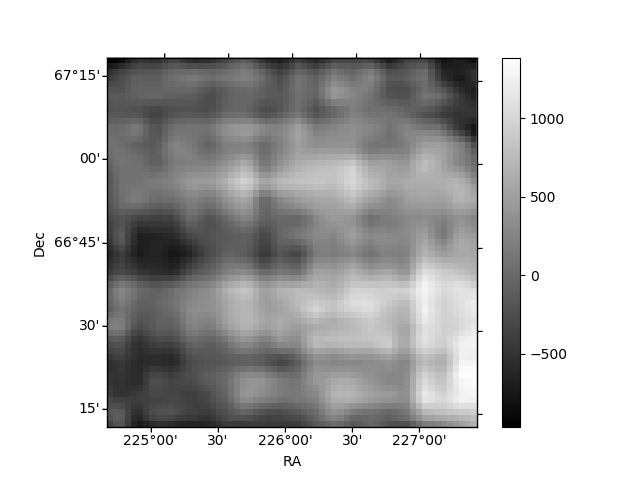
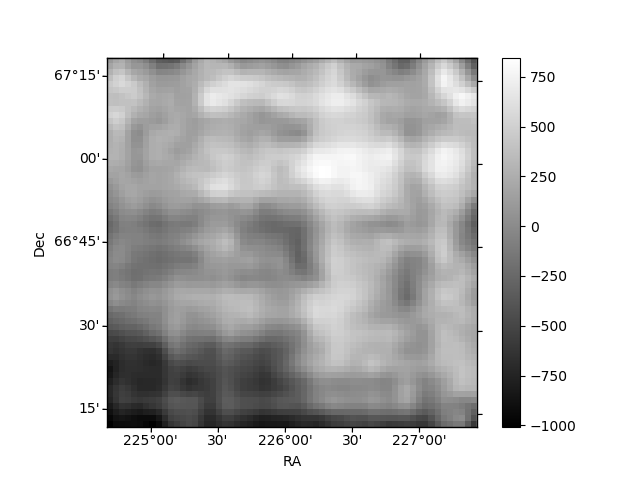
Histogram calculated using DETX and DETY for each event in the final _common_clean file
| Quadrant A | 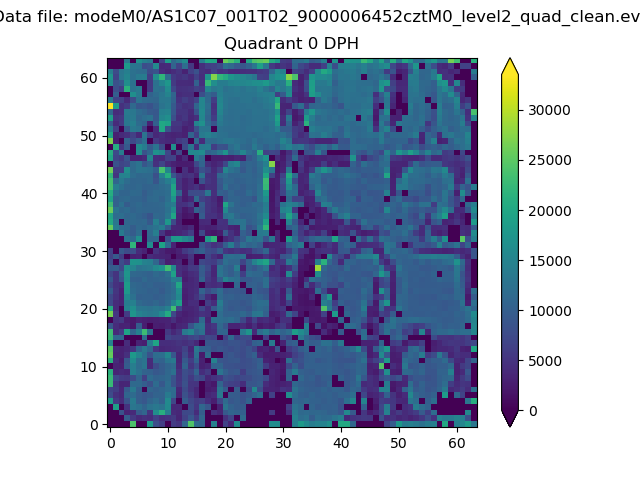 |
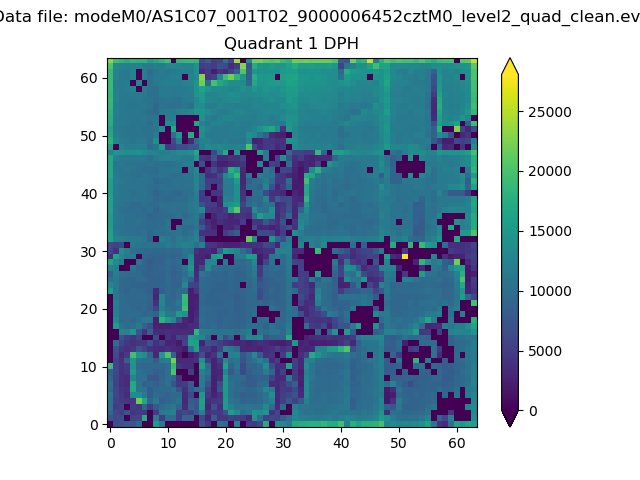 |
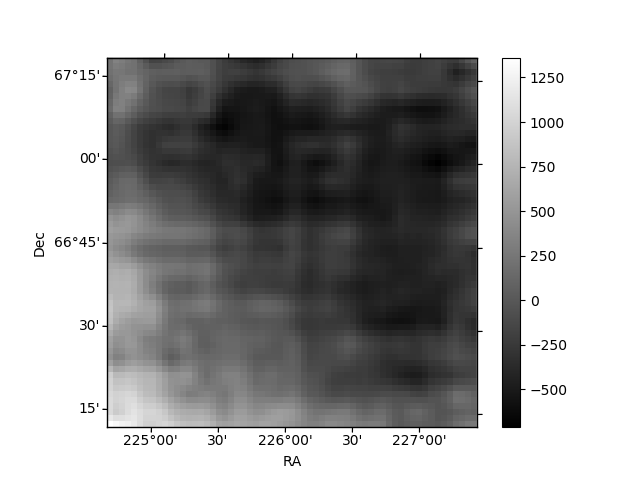
Quadrant B |
|---|---|---|---|
| Quadrant D | 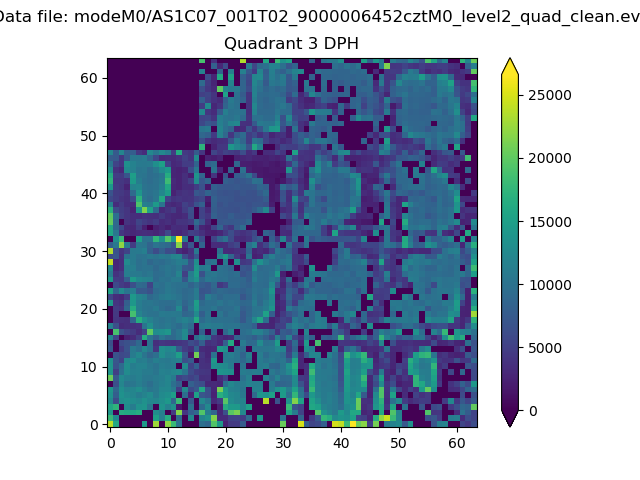 |
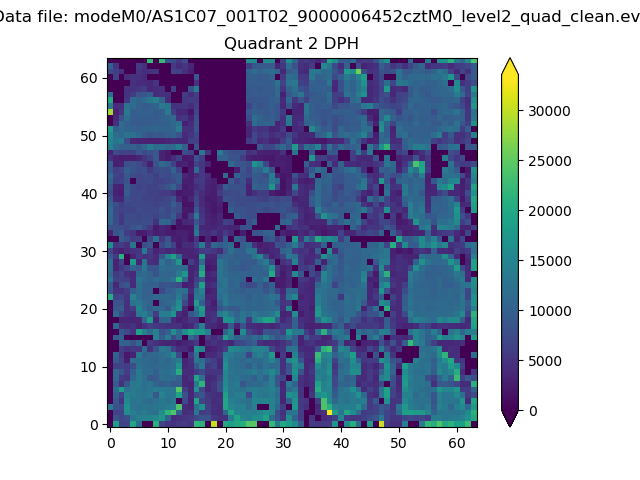 |
Quadrant C |
| Plot type | Count rate plots | Images |
|---|---|---|
| Comparison with Poisson distribution Blue bars denote a histogram of data divided into 1 sec bins. Red curve is a Poisson curve with rate = median count rate of data. |
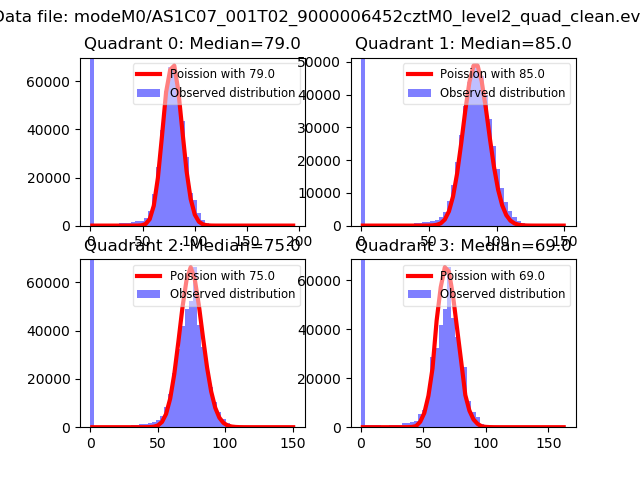 |
 |
| Quadrant-wise count rates Data is divided into 100 sec bins |
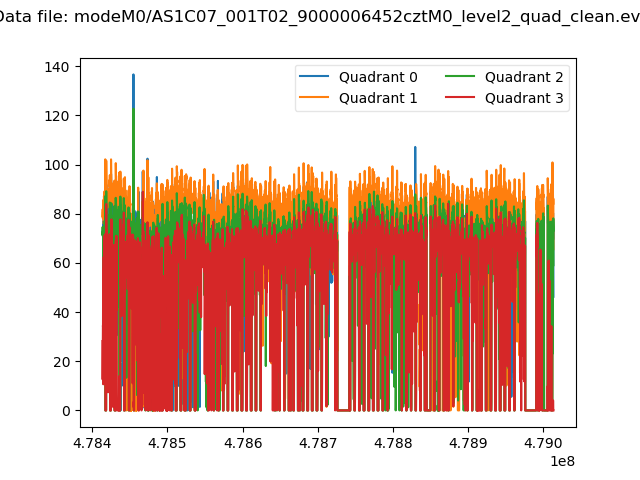 |
|
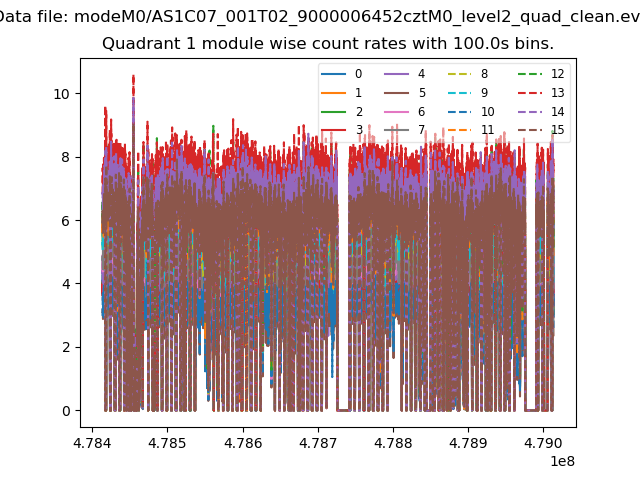
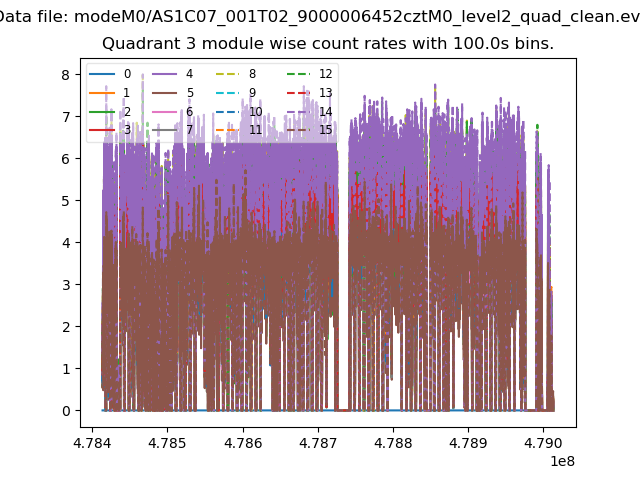
| Module-wise count rates for Quadrant A Data is divided into 100 sec bins |
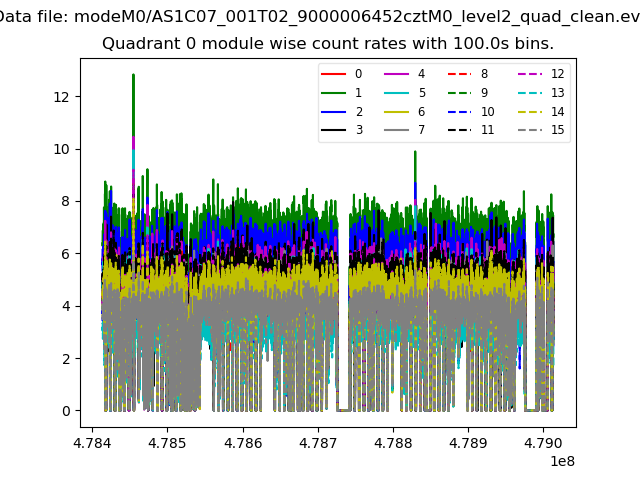 |
 |
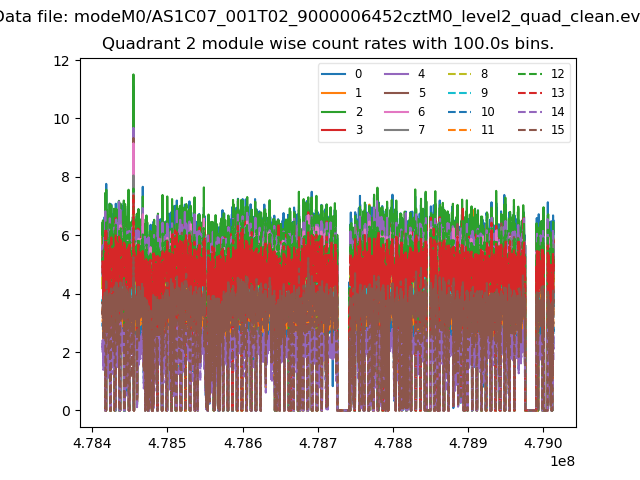
| Module-wise count rates for Quadrant B Data is divided into 100 sec bins |
 |
 |
| Module-wise count rates for Quadrant C Data is divided into 100 sec bins |
 |
 |
| Module-wise count rates for Quadrant D Data is divided into 100 sec bins |
 |
 |
| Parameter | Plot |
|---|---|
| CZT HV Monitor | 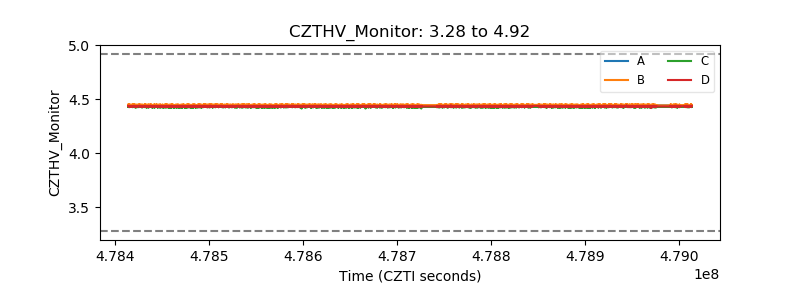 |
| D_VDD | 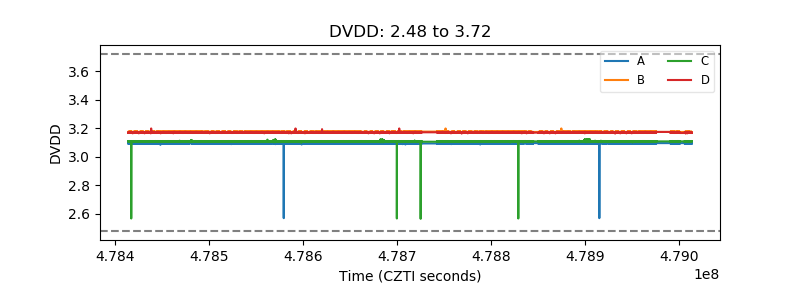 |
| Temperature 1 | 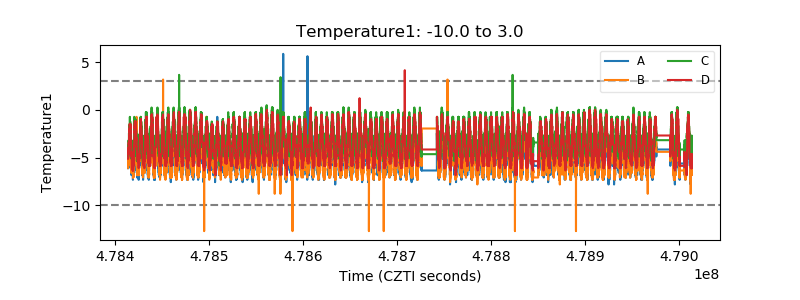 |
| Veto HV Monitor | 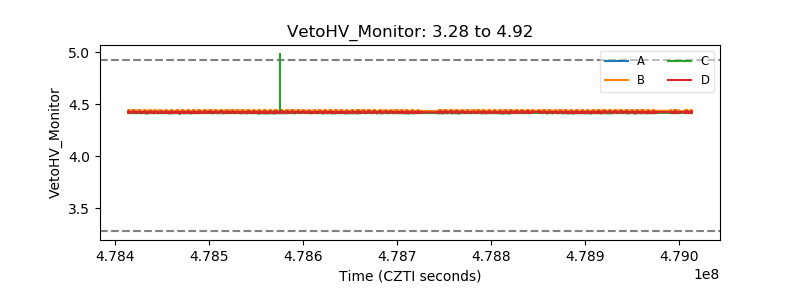 |
| Veto LLD | 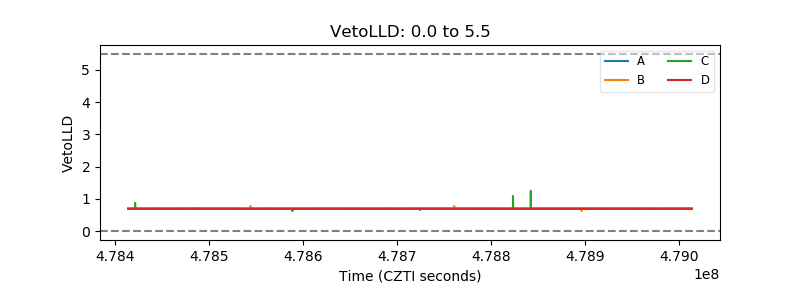 |
| Alpha Counter | 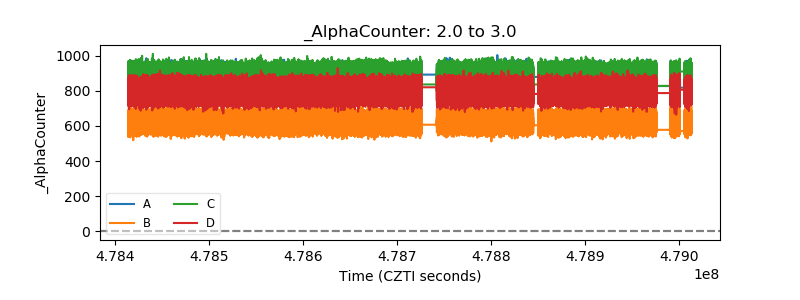 |
| _CPM_Rate | 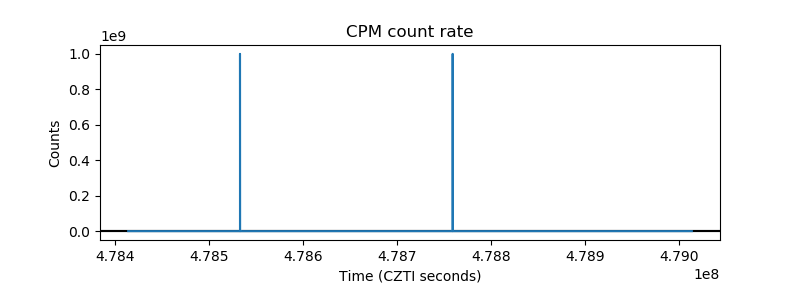 |
| CZT Counter | 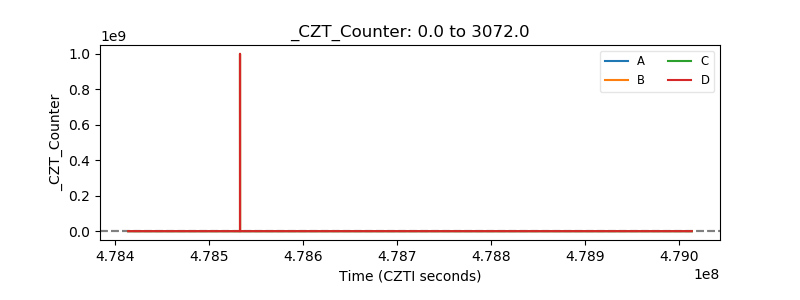 |
| +2.5 Volts monitor | 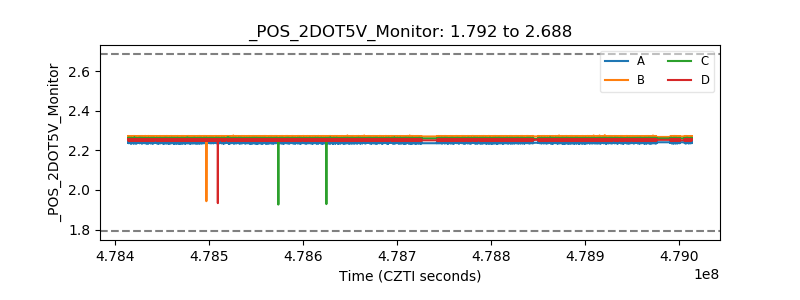 |
| +5 Volts monitor | 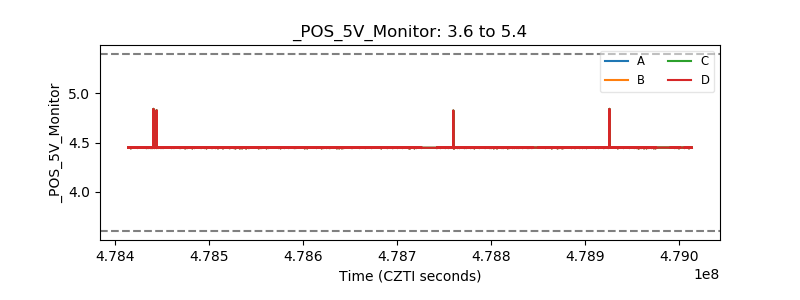 |
| _ROLL_ROT | 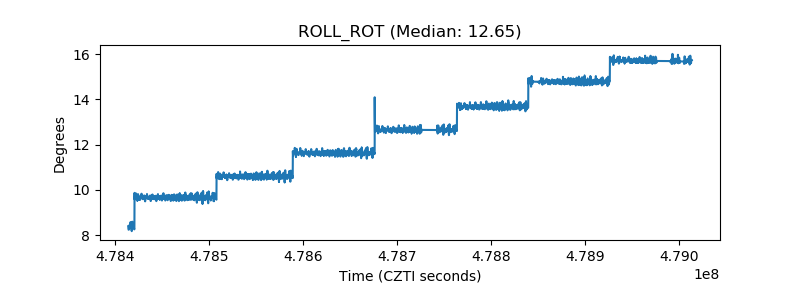 |
| _Roll_DEC | 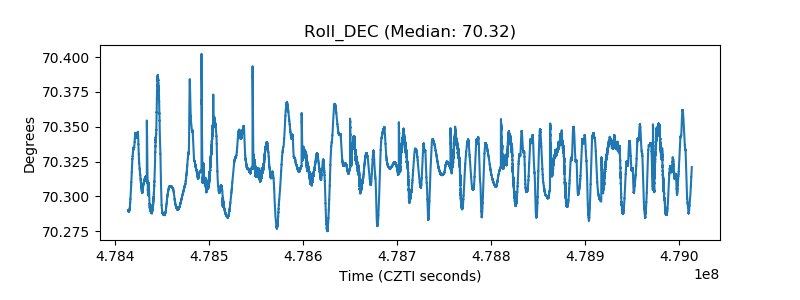 |
| _Roll_RA | 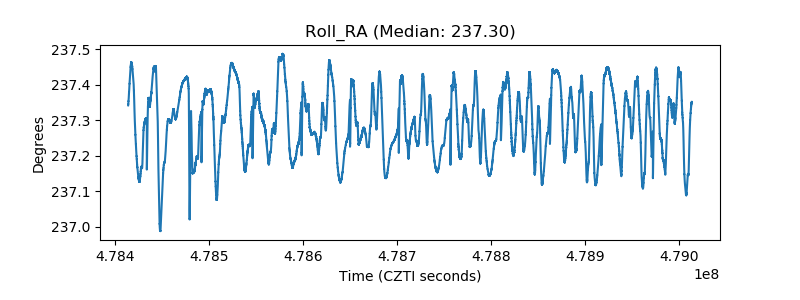 |
| Veto Counter | 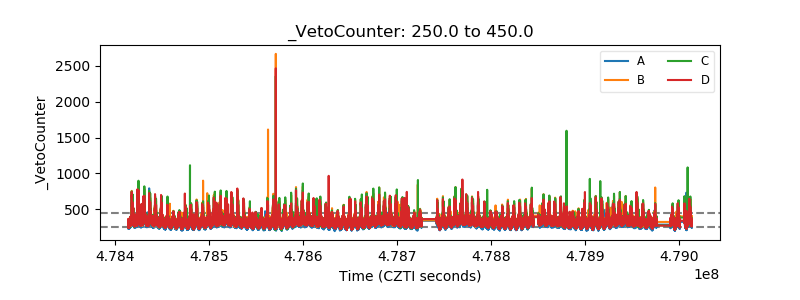 |