| Param | Original file | Final file |
|---|---|---|
| Filename | modeM0/AS1C07_001T02_9000006452_50956cztM0_level2.fits | modeM0/AS1C07_001T02_9000006452_50956cztM0_level2_quad_clean.evt |
| Size (bytes) | 622,874,880 | 92,358,720 |
| Size | 594.0 MB | 88.1 MB |
| Events in quadrant A | 4,223,624 | 637,806 |
| Events in quadrant B | 3,126,961 | 702,934 |
| Events in quadrant C | 5,414,142 | 587,941 |
| Events in quadrant D | 9,781,893 | 409,435 |
| Mode SS | |||
|---|---|---|---|
| Quadrant | BADHDUFLAG | Total packets | Discarded packets |
| A | 0 | 132 | 0 |
| B | 0 | 132 | 0 |
| C | 0 | 132 | 0 |
| D | 0 | 132 | 0 |
| Mode M9 | |||
|---|---|---|---|
| Quadrant | BADHDUFLAG | Total packets | Discarded packets |
| A | 0 | 13 | 0 |
| B | 0 | 14 | 0 |
| C | 0 | 14 | 0 |
| D | 0 | 14 | 0 |
| Mode M0 | |||
|---|---|---|---|
| Quadrant | BADHDUFLAG | Total packets | Discarded packets |
| A | 0 | 17061 | 2 |
| B | 0 | 14015 | 2 |
| C | 0 | 20572 | 2 |
| D | 0 | 33667 | 2 |
| Quadrant | Total seconds | Saturated seconds | Saturation percentage |
|---|---|---|---|
| A | 6576 | 349 | 5.307178% |
| B | 6576 | 111 | 1.687956% |
| C | 6576 | 532 | 8.090024% |
| D | 6576 | 2249 | 34.200122% |
Noise dominated data is calculated using 1-second bins in cleaned event files. If a bin has >2000 counts, and if more than 50% of those come from <1% of pixels, then it is considered to be noise-dominated and hence unusable.
| Quadrant | # 1 sec bins | Bins with >0 counts | Bins with >2000 counts | High rate bins dominated by noise | Noise dominated (total time) | Noise dominated (detector-on time) | Marked lightcurve |
|---|---|---|---|---|---|---|---|
| A | 7621 | 6577 | 208 | 208 | 2.73% | 3.16% | 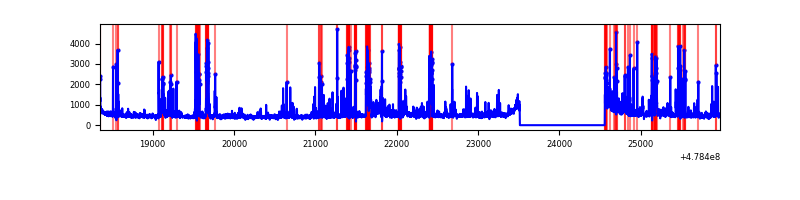 |
| B | 7621 | 6577 | 9 | 9 | 0.12% | 0.14% | 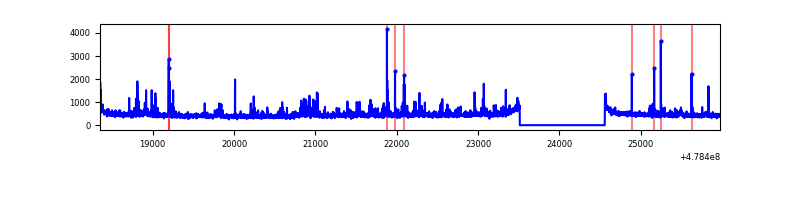 |
| C | 7621 | 6576 | 417 | 417 | 5.47% | 6.34% | 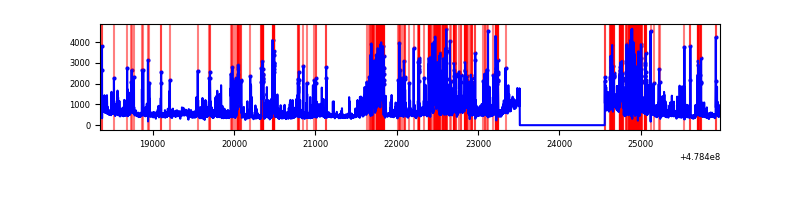 |
| D | 7621 | 6577 | 1869 | 1869 | 24.52% | 28.42% | 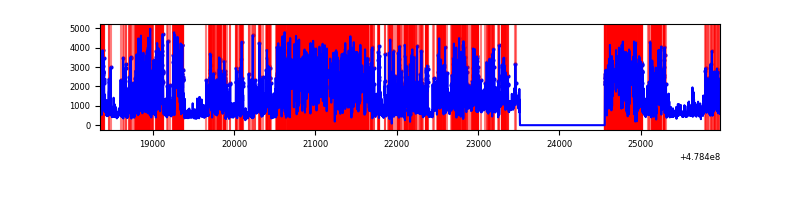 |
Top three noisy pixels from each quadrant. If the there are fewer than three noisy pixels in the level2.evt file, extra rows are filled as -1
| Pixel properties | Quadrant properties | ||||||
|---|---|---|---|---|---|---|---|
| Quadrant | DetID | PixID | Counts | Sigma | Mean | Median | Sigma |
| A | 4 | 249 | 335822 | 1912.58 | 701 | 683 | 175.2 |
| A | 14 | 254 | 268043 | 1525.77 | 701 | 683 | 175.2 |
| A | 8 | 43 | 139954 | 794.79 | 701 | 683 | 175.2 |
| B | 4 | 81 | 42521 | 283.78 | 701 | 678 | 147.4 |
| B | 8 | 128 | 42316 | 282.39 | 701 | 678 | 147.4 |
| B | 0 | 245 | 42129 | 281.12 | 701 | 678 | 147.4 |
| C | 4 | 5 | 595650 | 3206.37 | 660 | 656 | 185.6 |
| C | 0 | 193 | 525788 | 2829.89 | 660 | 656 | 185.6 |
| C | 0 | 177 | 339787 | 1827.55 | 660 | 656 | 185.6 |
| D | 8 | 176 | 3327935 | 20828.83 | 557 | 537 | 159.7 |
| D | 15 | 125 | 2891836 | 18098.94 | 557 | 537 | 159.7 |
| D | 2 | 62 | 437493 | 2735.25 | 557 | 537 | 159.7 |
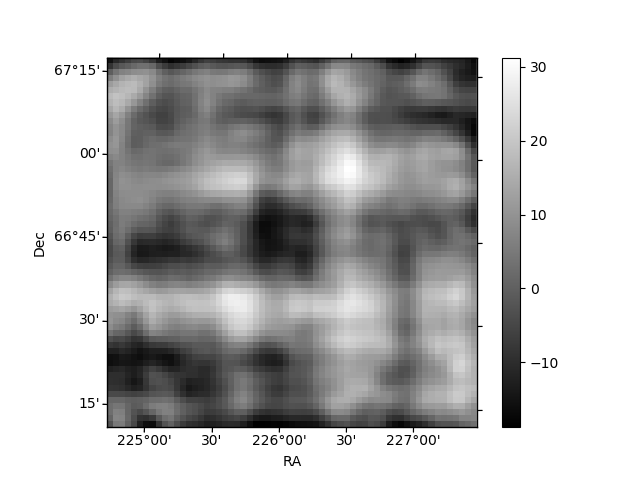
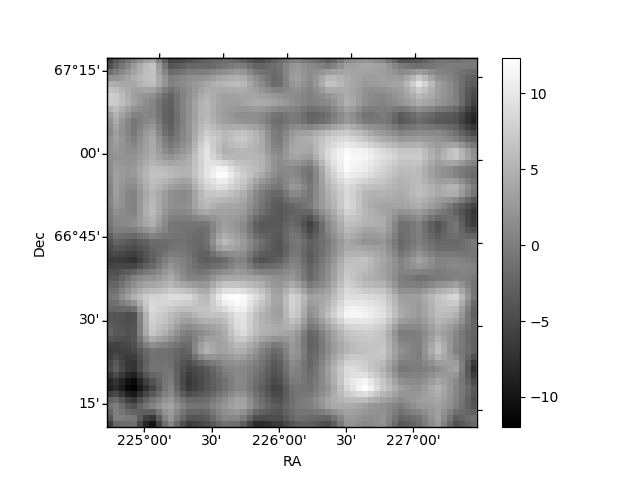
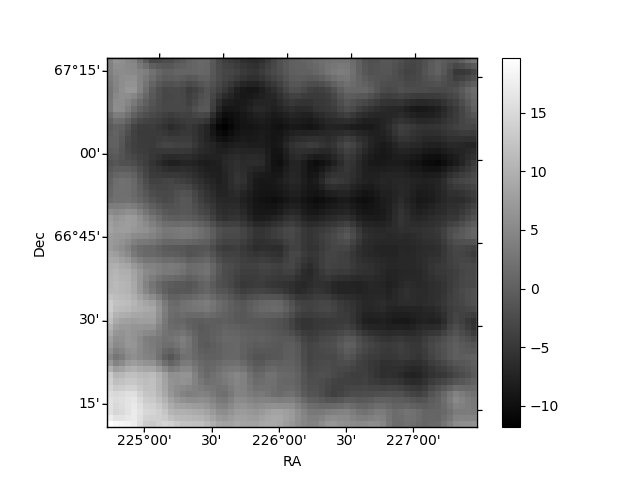
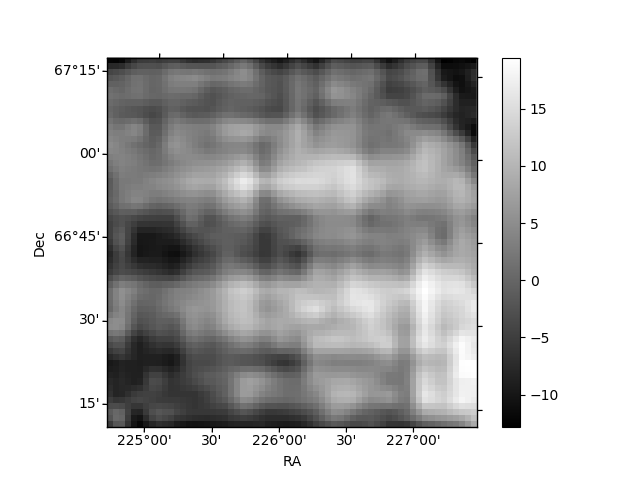
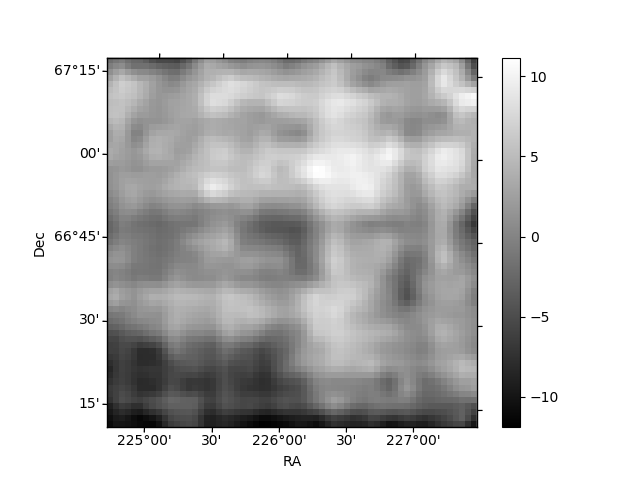
Histogram calculated using DETX and DETY for each event in the final _common_clean file
| Quadrant A | 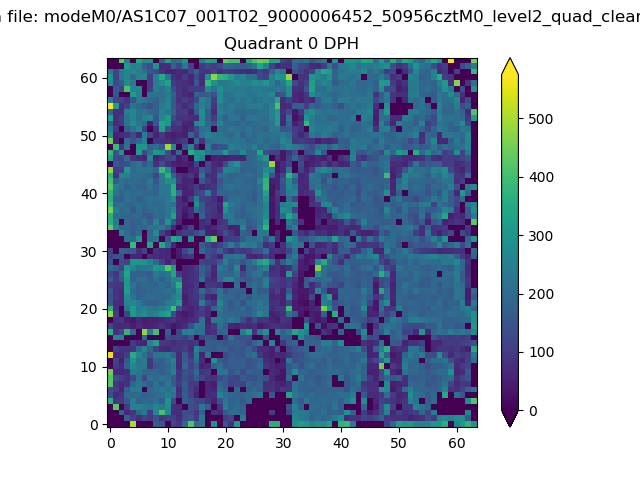 |
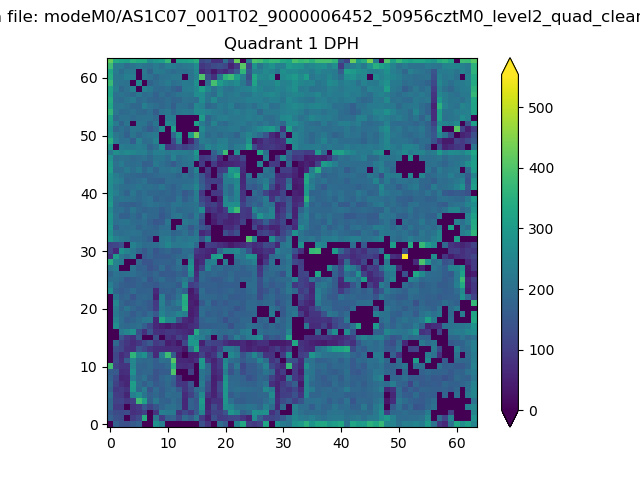 |
Quadrant B |
|---|---|---|---|
| Quadrant D | 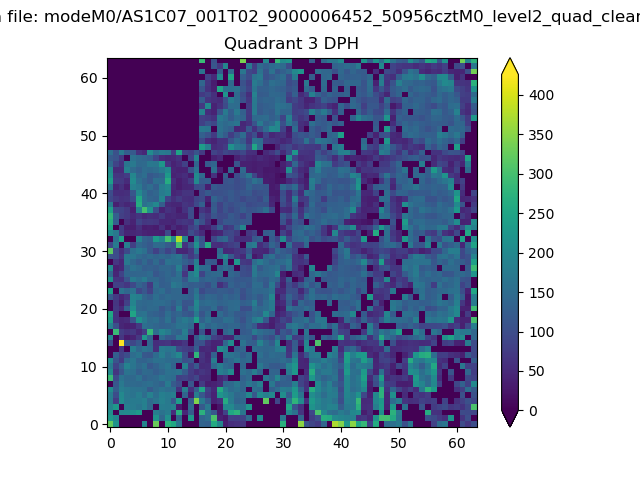 |
 |
Quadrant C |
| Plot type | Count rate plots | Images |
|---|---|---|
| Comparison with Poisson distribution Blue bars denote a histogram of data divided into 1 sec bins. Red curve is a Poisson curve with rate = median count rate of data. |
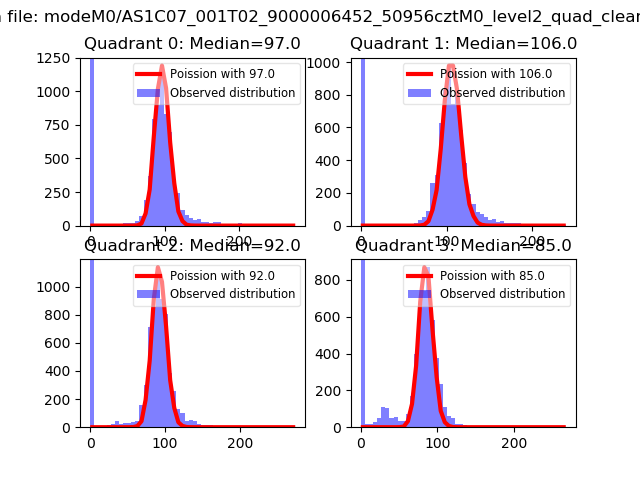 |
 |
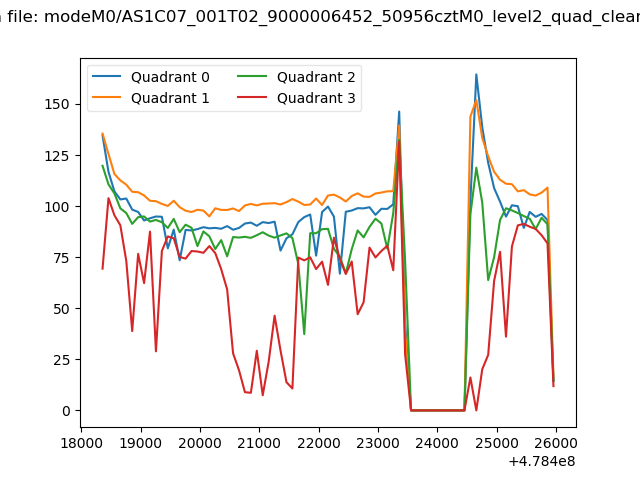
| Quadrant-wise count rates Data is divided into 100 sec bins |
 |
|
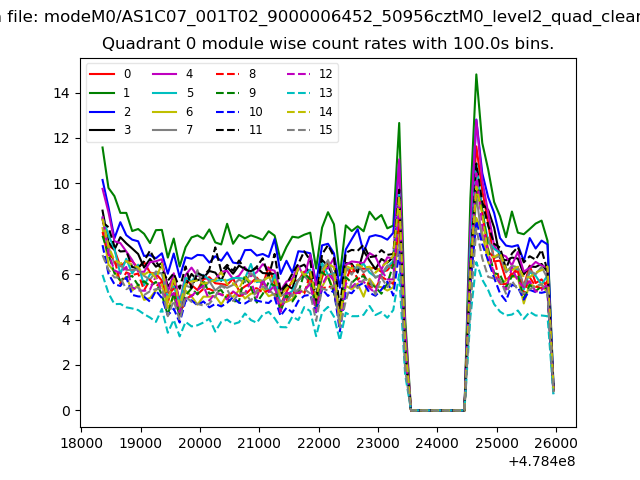
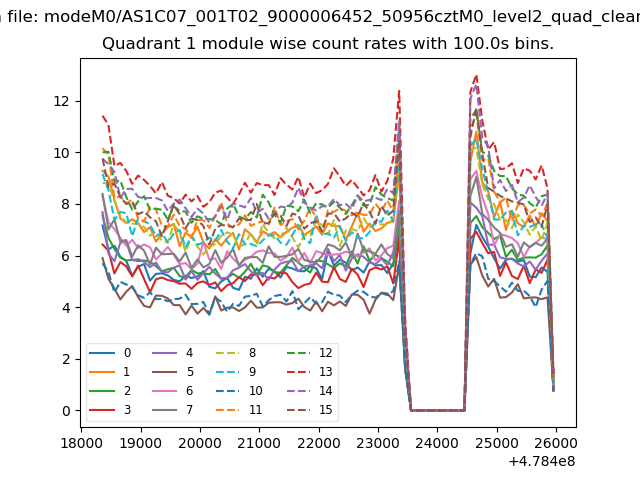
| Module-wise count rates for Quadrant A Data is divided into 100 sec bins |
 |
 |
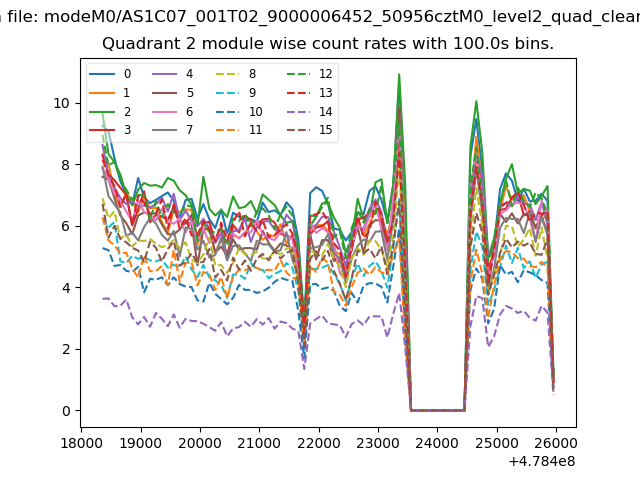
| Module-wise count rates for Quadrant B Data is divided into 100 sec bins |
 |
 |
| Module-wise count rates for Quadrant C Data is divided into 100 sec bins |
 |
 |
| Module-wise count rates for Quadrant D Data is divided into 100 sec bins |
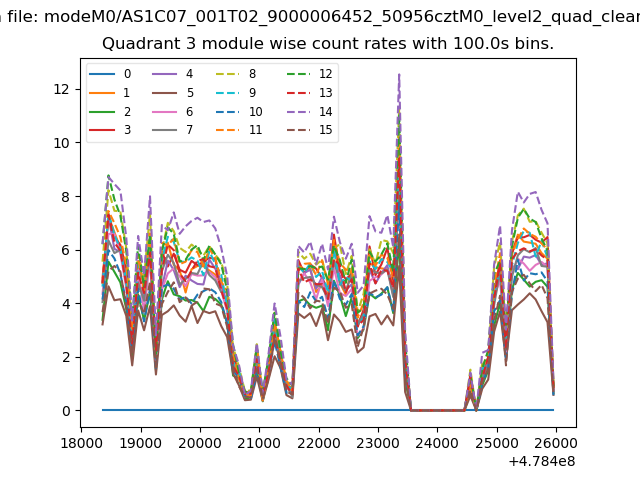 |
 |
| Parameter | Plot |
|---|---|
| CZT HV Monitor | 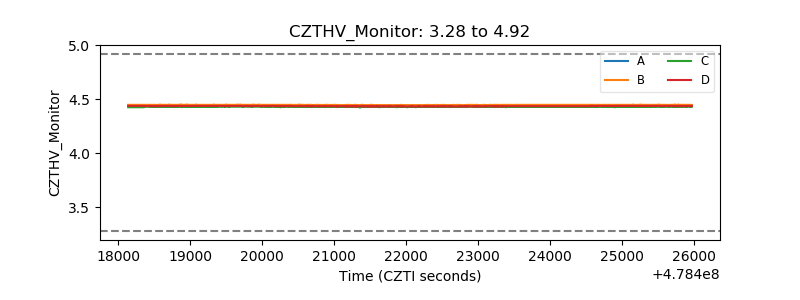 |
| D_VDD | 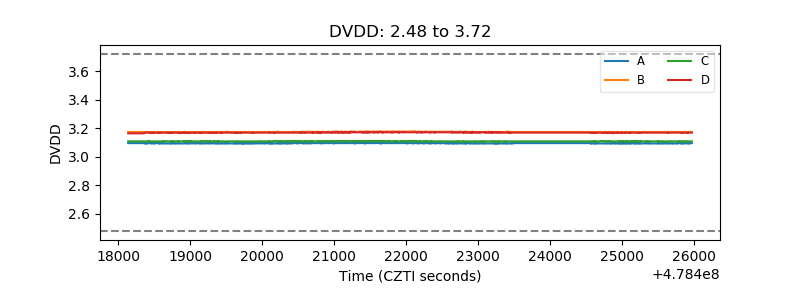 |
| Temperature 1 | 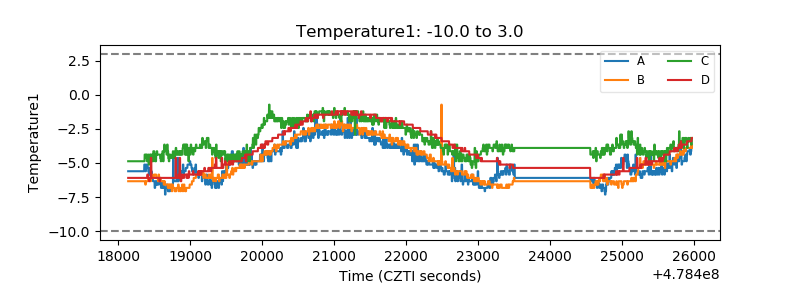 |
| Veto HV Monitor | 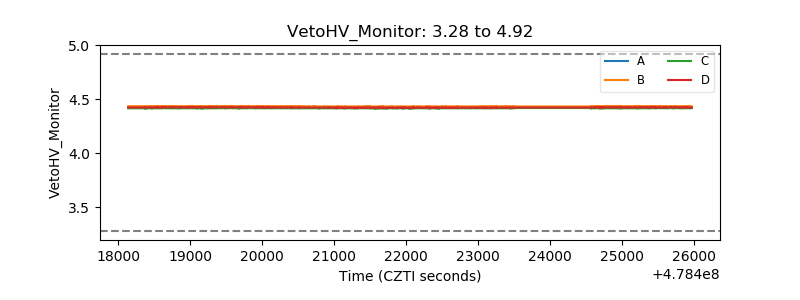 |
| Veto LLD | 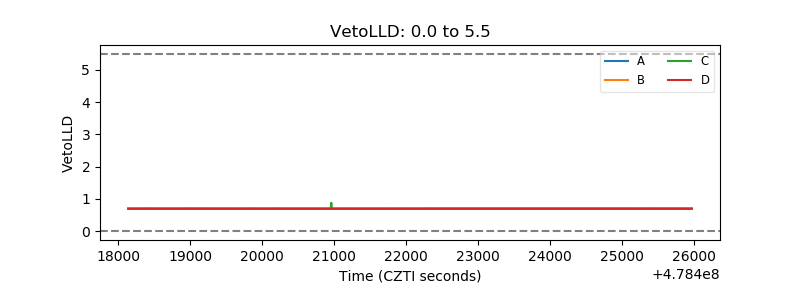 |
| Alpha Counter | 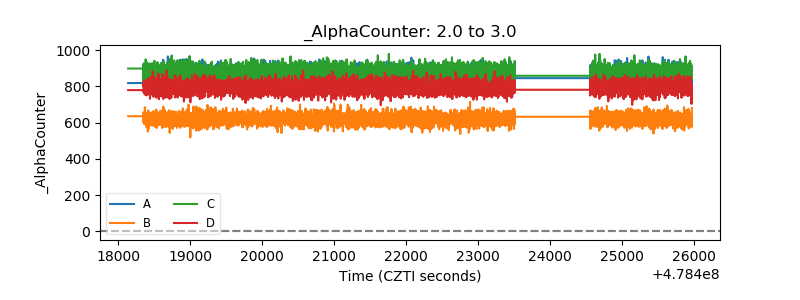 |
| _CPM_Rate | 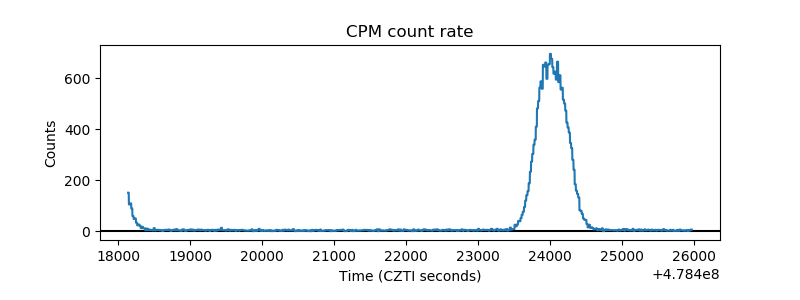 |
| CZT Counter | 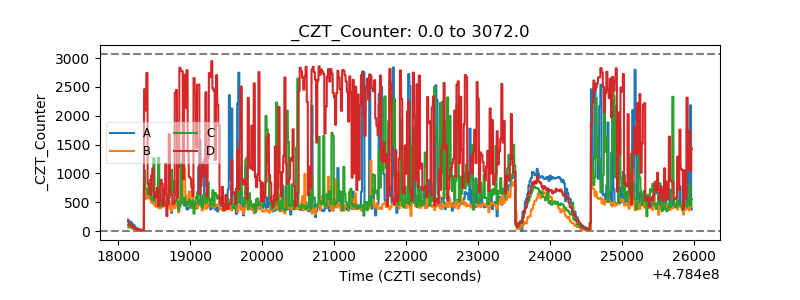 |
| +2.5 Volts monitor | 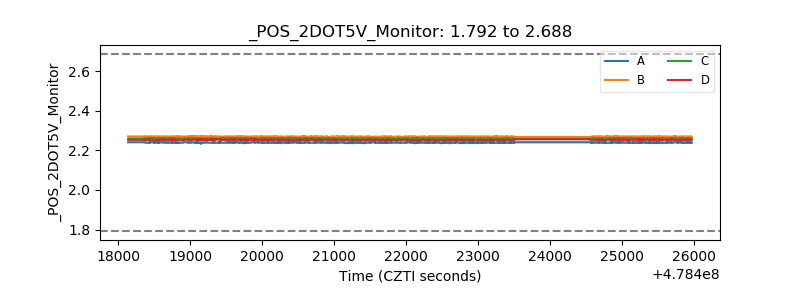 |
| +5 Volts monitor | 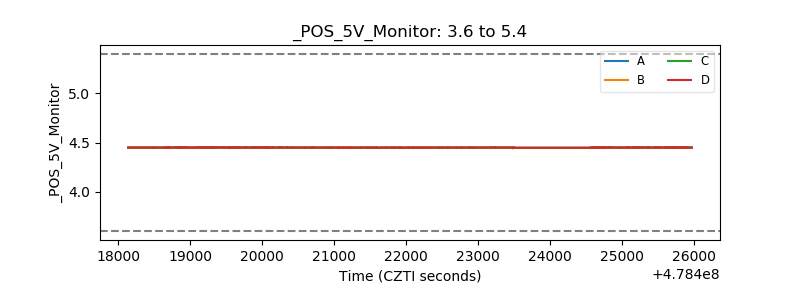 |
| _ROLL_ROT | 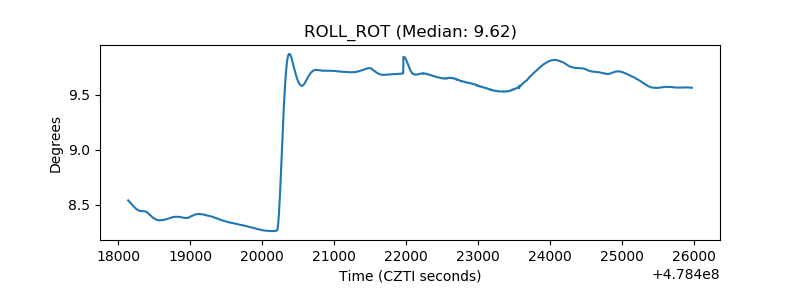 |
| _Roll_DEC | 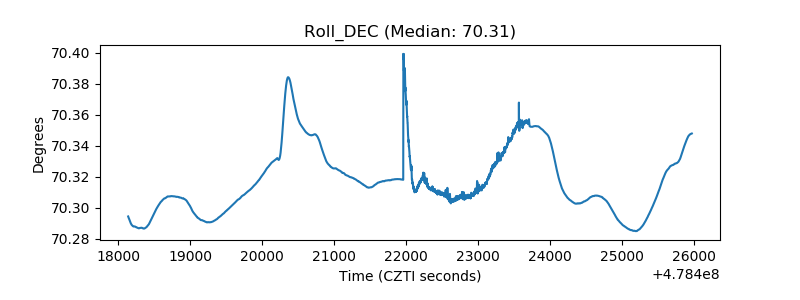 |
| _Roll_RA | 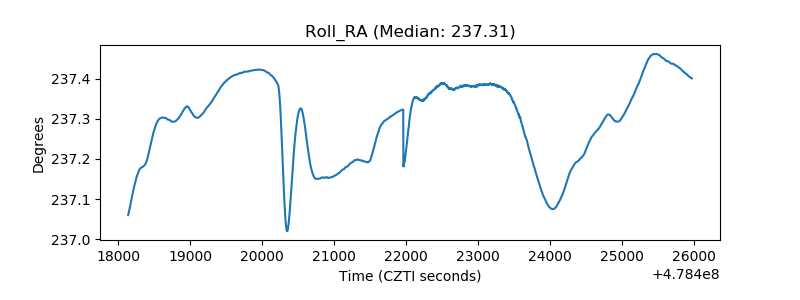 |
| Veto Counter | 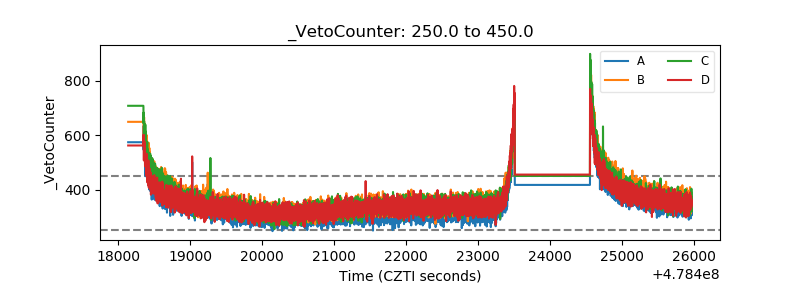 |