| Param | Original file | Final file |
|---|---|---|
| Filename | modeM0/AS1C07_001T02_9000006452_50957cztM0_level2.fits | modeM0/AS1C07_001T02_9000006452_50957cztM0_level2_quad_clean.evt |
| Size (bytes) | 670,219,200 | 83,687,040 |
| Size | 639.2 MB | 79.8 MB |
| Events in quadrant A | 5,508,520 | 571,690 |
| Events in quadrant B | 3,176,906 | 655,430 |
| Events in quadrant C | 4,716,421 | 553,153 |
| Events in quadrant D | 10,928,593 | 322,543 |
| Mode SS | |||
|---|---|---|---|
| Quadrant | BADHDUFLAG | Total packets | Discarded packets |
| A | 0 | 126 | 2 |
| B | 0 | 126 | 2 |
| C | 0 | 127 | 3 |
| D | 0 | 126 | 2 |
| Mode M9 | |||
|---|---|---|---|
| Quadrant | BADHDUFLAG | Total packets | Discarded packets |
| A | 0 | 11 | 0 |
| B | 0 | 11 | 0 |
| C | 0 | 11 | 0 |
| D | 0 | 11 | 0 |
| Mode M0 | |||
|---|---|---|---|
| Quadrant | BADHDUFLAG | Total packets | Discarded packets |
| A | 0 | 20629 | 92 |
| B | 0 | 13788 | 68 |
| C | 0 | 18365 | 207 |
| D | 0 | 37031 | 324 |
| Quadrant | Total seconds | Saturated seconds | Saturation percentage |
|---|---|---|---|
| A | 6182 | 629 | 10.174701% |
| B | 6183 | 131 | 2.118713% |
| C | 6179 | 415 | 6.716297% |
| D | 6168 | 2901 | 47.033074% |
Noise dominated data is calculated using 1-second bins in cleaned event files. If a bin has >2000 counts, and if more than 50% of those come from <1% of pixels, then it is considered to be noise-dominated and hence unusable.
| Quadrant | # 1 sec bins | Bins with >0 counts | Bins with >2000 counts | High rate bins dominated by noise | Noise dominated (total time) | Noise dominated (detector-on time) | Marked lightcurve |
|---|---|---|---|---|---|---|---|
| A | 7380 | 6191 | 462 | 462 | 6.26% | 7.46% | 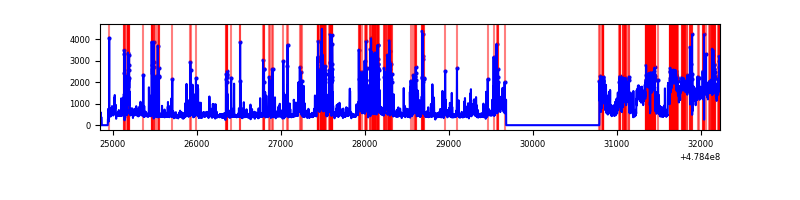 |
| B | 7382 | 6188 | 30 | 30 | 0.41% | 0.48% | 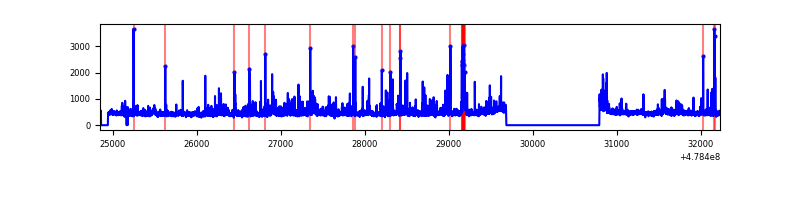 |
| C | 7382 | 6185 | 302 | 302 | 4.09% | 4.88% | 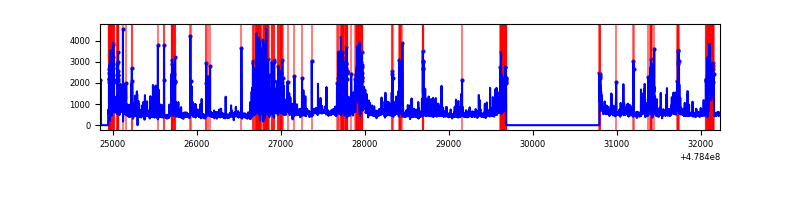 |
| D | 7382 | 6175 | 2571 | 2571 | 34.83% | 41.64% | 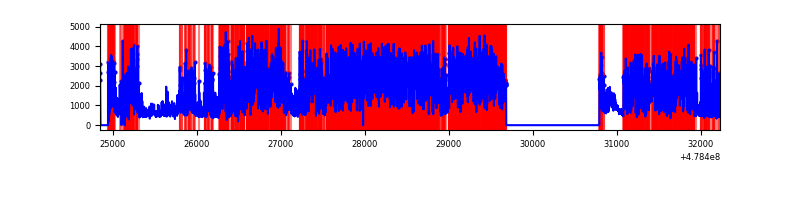 |
Top three noisy pixels from each quadrant. If the there are fewer than three noisy pixels in the level2.evt file, extra rows are filled as -1
| Pixel properties | Quadrant properties | ||||||
|---|---|---|---|---|---|---|---|
| Quadrant | DetID | PixID | Counts | Sigma | Mean | Median | Sigma |
| A | 12 | 80 | 1221943 | 7602.08 | 651 | 635 | 160.7 |
| A | 14 | 254 | 827152 | 5144.68 | 651 | 635 | 160.7 |
| A | 8 | 43 | 227938 | 1414.86 | 651 | 635 | 160.7 |
| B | 4 | 171 | 107742 | 773.81 | 655 | 633 | 138.4 |
| B | 4 | 206 | 75954 | 544.16 | 655 | 633 | 138.4 |
| B | 10 | 247 | 61305 | 438.33 | 655 | 633 | 138.4 |
| C | 4 | 5 | 792567 | 4593.83 | 621 | 615 | 172.4 |
| C | 0 | 193 | 376896 | 2182.67 | 621 | 615 | 172.4 |
| C | 12 | 247 | 348377 | 2017.24 | 621 | 615 | 172.4 |
| D | 2 | 62 | 4015098 | 28304.49 | 503 | 485 | 141.8 |
| D | 8 | 176 | 2245033 | 15824.88 | 503 | 485 | 141.8 |
| D | 15 | 125 | 1961968 | 13829.17 | 503 | 485 | 141.8 |
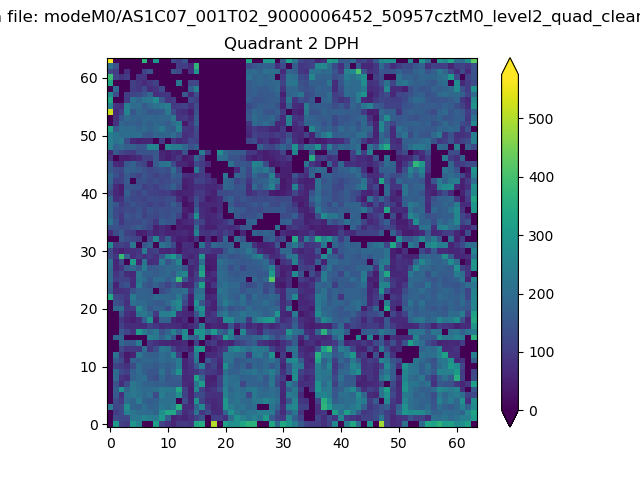
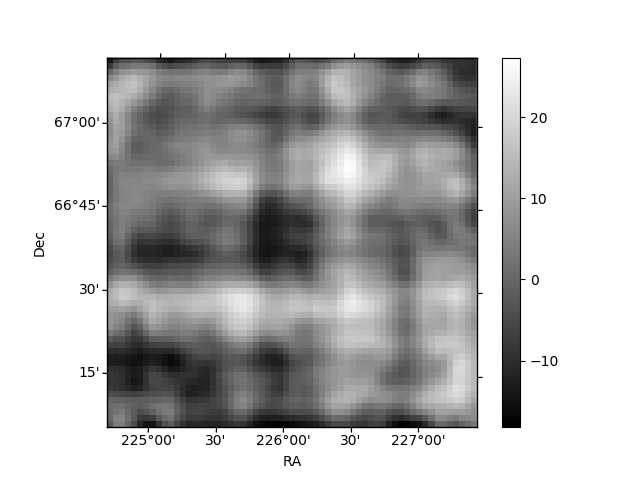
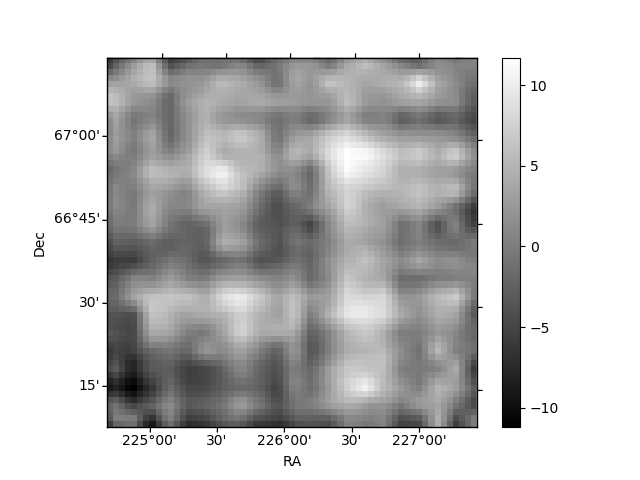
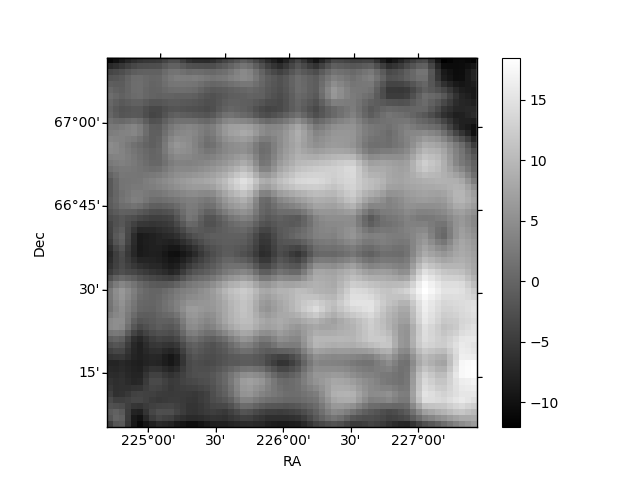
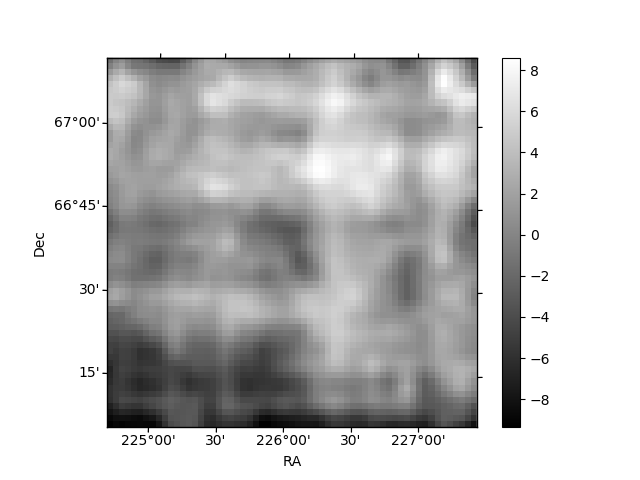
Histogram calculated using DETX and DETY for each event in the final _common_clean file
| Quadrant A | 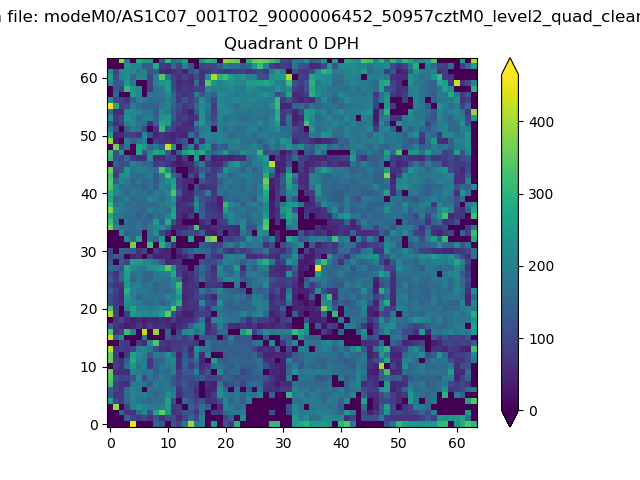 |
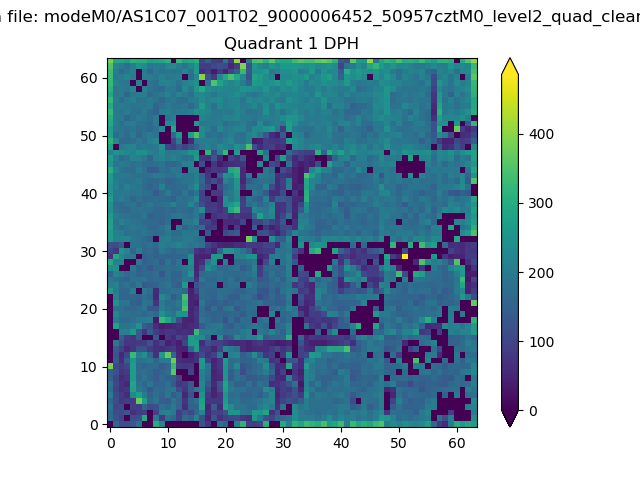 |
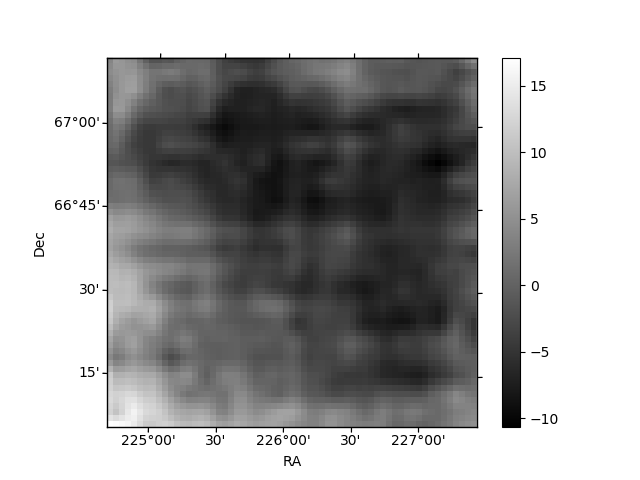
Quadrant B |
|---|---|---|---|
| Quadrant D | 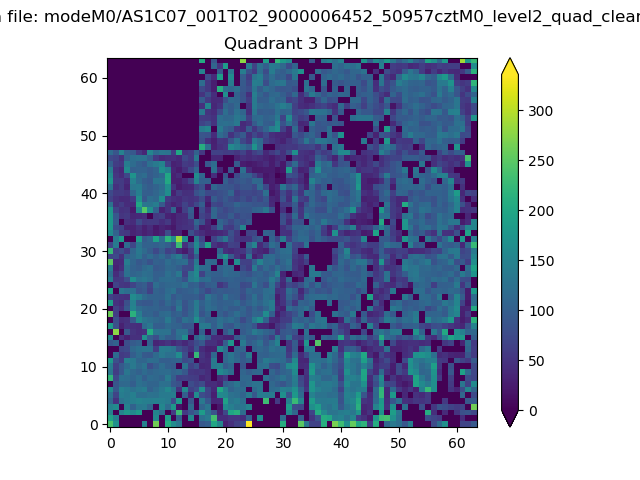 |
 |
Quadrant C |
| Plot type | Count rate plots | Images |
|---|---|---|
| Comparison with Poisson distribution Blue bars denote a histogram of data divided into 1 sec bins. Red curve is a Poisson curve with rate = median count rate of data. |
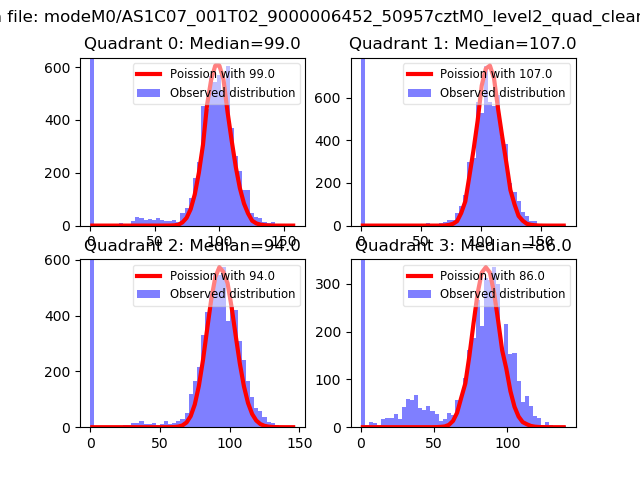 |
 |
| Quadrant-wise count rates Data is divided into 100 sec bins |
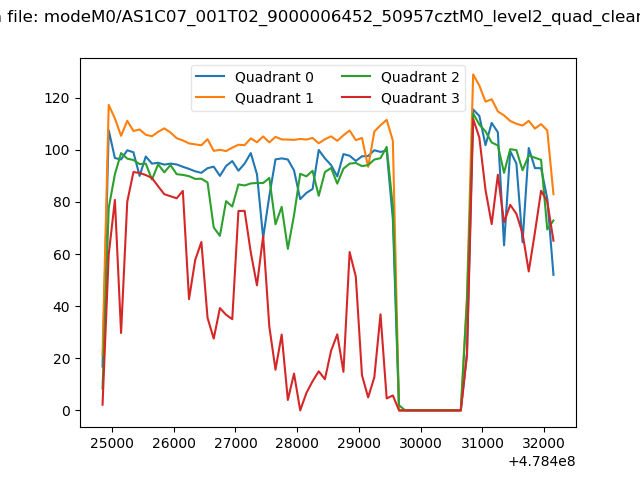 |
|
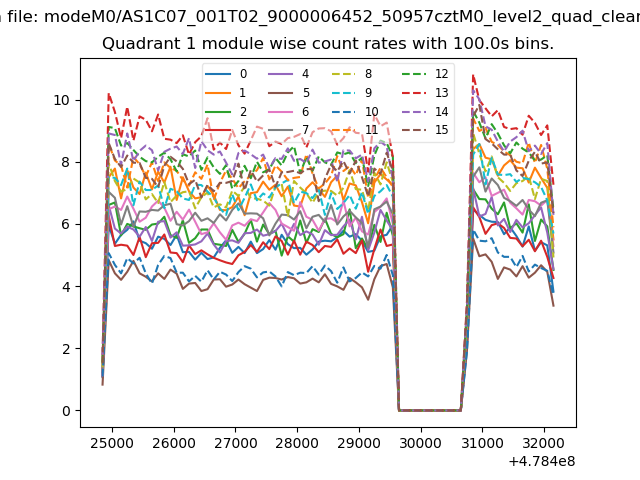
| Module-wise count rates for Quadrant A Data is divided into 100 sec bins |
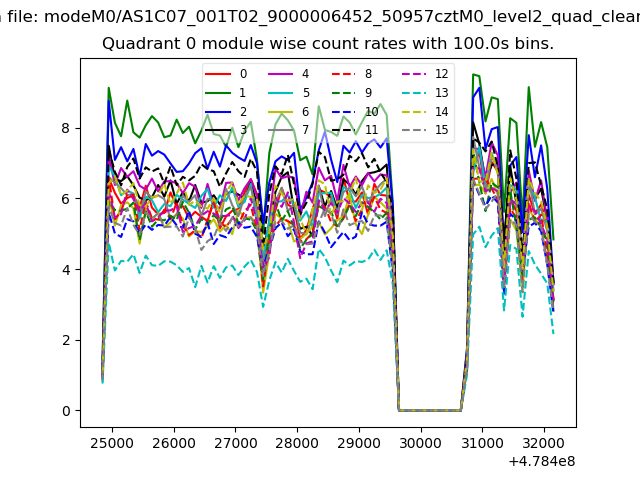 |
 |
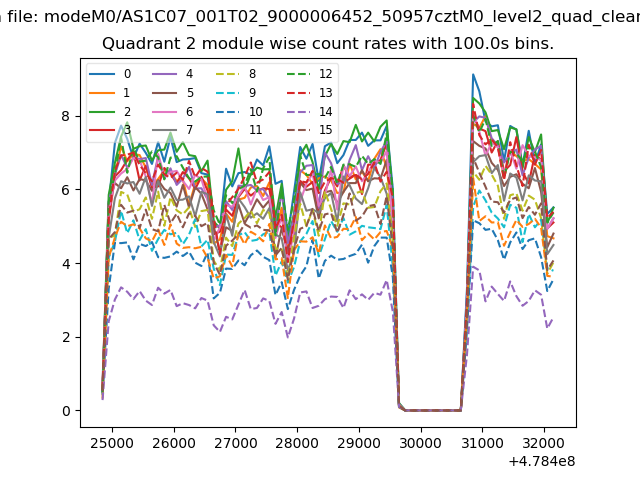
| Module-wise count rates for Quadrant B Data is divided into 100 sec bins |
 |
 |
| Module-wise count rates for Quadrant C Data is divided into 100 sec bins |
 |
 |
| Module-wise count rates for Quadrant D Data is divided into 100 sec bins |
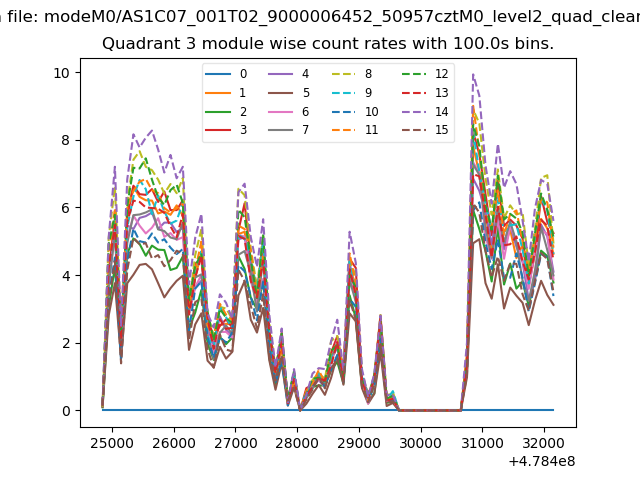 |
 |
| Parameter | Plot |
|---|---|
| CZT HV Monitor | 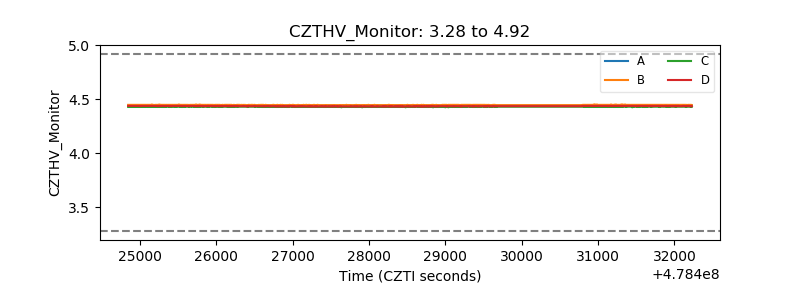 |
| D_VDD | 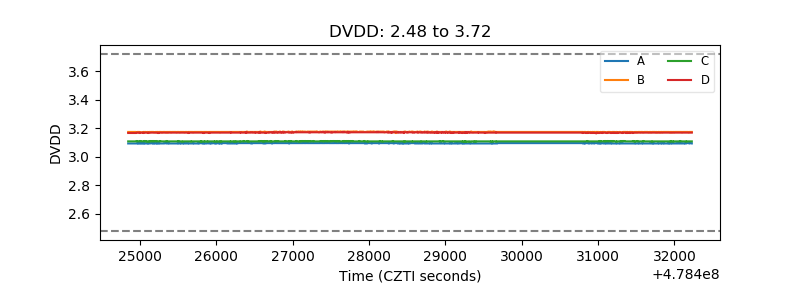 |
| Temperature 1 | 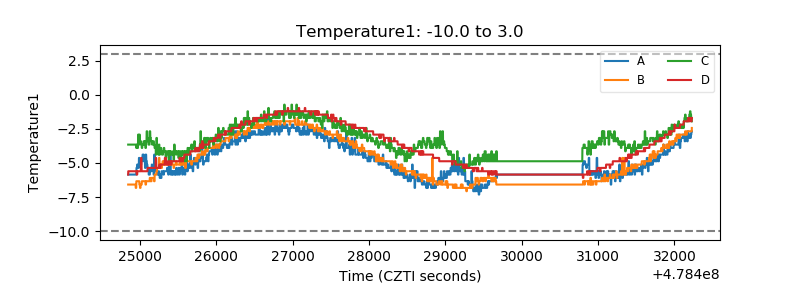 |
| Veto HV Monitor |  |
| Veto LLD | 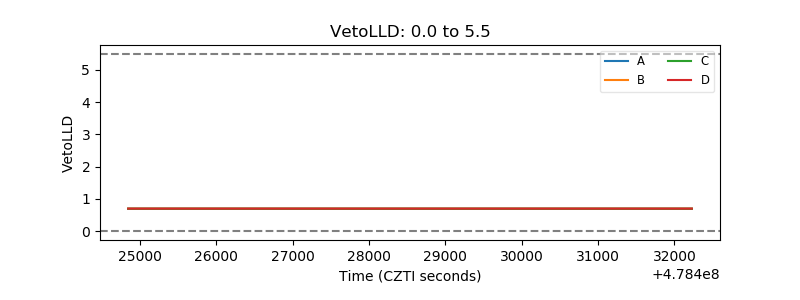 |
| Alpha Counter | 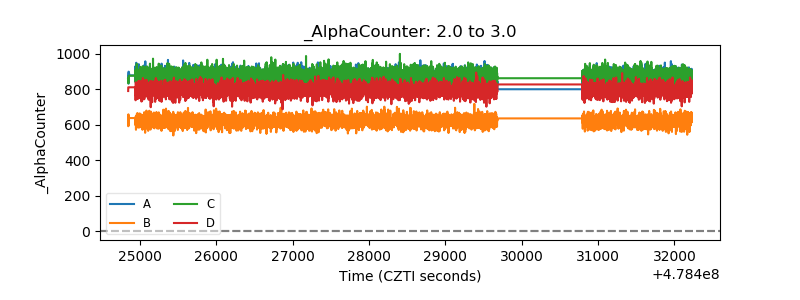 |
| _CPM_Rate | 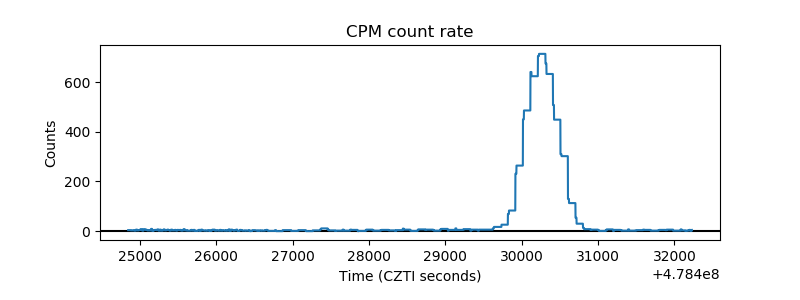 |
| CZT Counter | 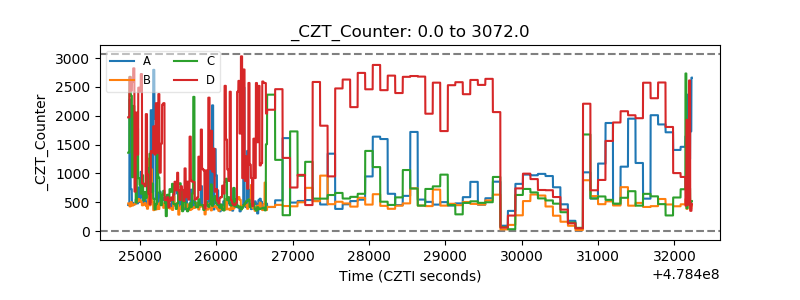 |
| +2.5 Volts monitor | 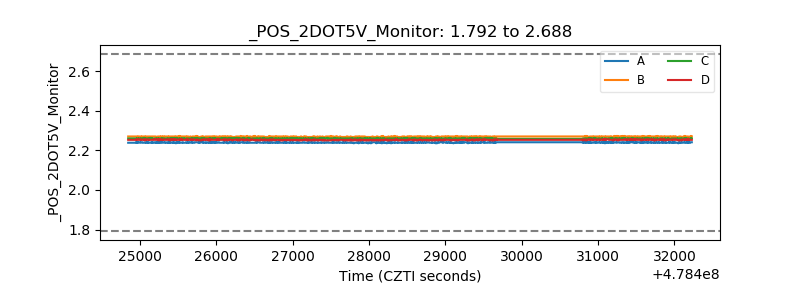 |
| +5 Volts monitor | 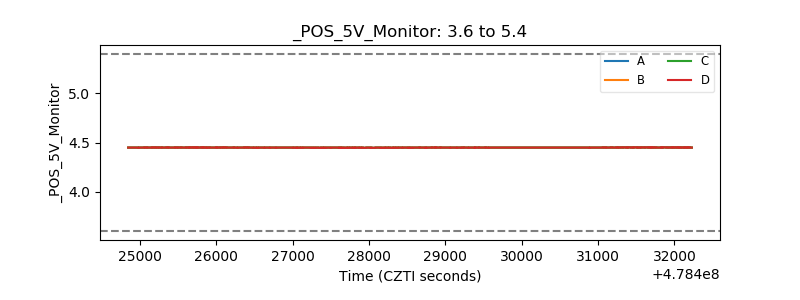 |
| _ROLL_ROT | 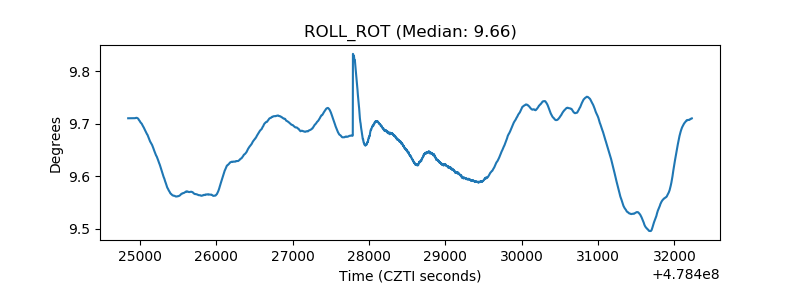 |
| _Roll_DEC | 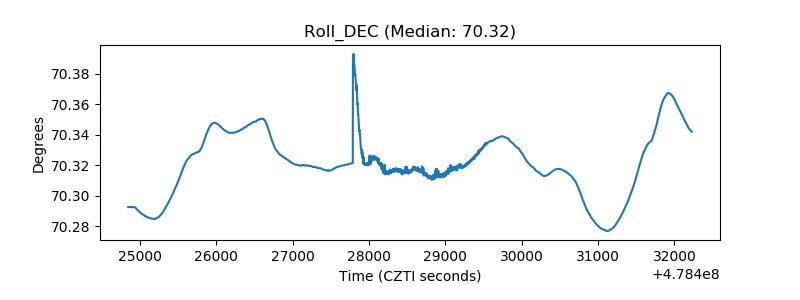 |
| _Roll_RA | 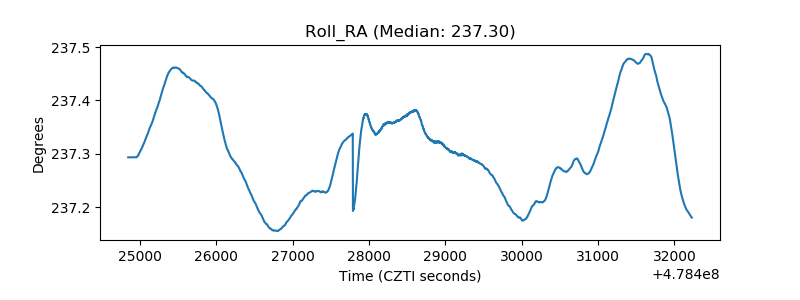 |
| Veto Counter | 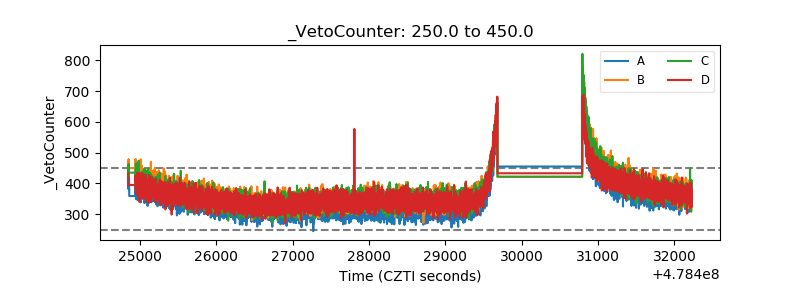 |