| Param | Original file | Final file |
|---|---|---|
| Filename | modeM0/AS1C07_001T02_9000006452_50958cztM0_level2.fits | modeM0/AS1C07_001T02_9000006452_50958cztM0_level2_quad_clean.evt |
| Size (bytes) | 758,664,000 | 72,080,640 |
| Size | 723.5 MB | 68.7 MB |
| Events in quadrant A | 10,121,397 | 420,774 |
| Events in quadrant B | 4,487,572 | 598,639 |
| Events in quadrant C | 4,546,244 | 536,757 |
| Events in quadrant D | 8,462,721 | 207,331 |
| Mode SS | |||
|---|---|---|---|
| Quadrant | BADHDUFLAG | Total packets | Discarded packets |
| A | 0 | 122 | 0 |
| B | 0 | 122 | 0 |
| C | 0 | 122 | 0 |
| D | 0 | 122 | 0 |
| Mode M9 | |||
|---|---|---|---|
| Quadrant | BADHDUFLAG | Total packets | Discarded packets |
| A | 0 | 11 | 0 |
| B | 0 | 11 | 0 |
| C | 0 | 11 | 0 |
| D | 0 | 11 | 0 |
| Mode M0 | |||
|---|---|---|---|
| Quadrant | BADHDUFLAG | Total packets | Discarded packets |
| A | 0 | 34206 | 6 |
| B | 0 | 17350 | 1 |
| C | 0 | 17474 | 1 |
| D | 0 | 29342 | 1 |
| Quadrant | Total seconds | Saturated seconds | Saturation percentage |
|---|---|---|---|
| A | 5993 | 2121 | 35.391290% |
| B | 5994 | 544 | 9.075742% |
| C | 5994 | 395 | 6.589923% |
| D | 5994 | 3890 | 64.898232% |
Noise dominated data is calculated using 1-second bins in cleaned event files. If a bin has >2000 counts, and if more than 50% of those come from <1% of pixels, then it is considered to be noise-dominated and hence unusable.
| Quadrant | # 1 sec bins | Bins with >0 counts | Bins with >2000 counts | High rate bins dominated by noise | Noise dominated (total time) | Noise dominated (detector-on time) | Marked lightcurve |
|---|---|---|---|---|---|---|---|
| A | 7094 | 5994 | 1852 | 1852 | 26.11% | 30.90% | 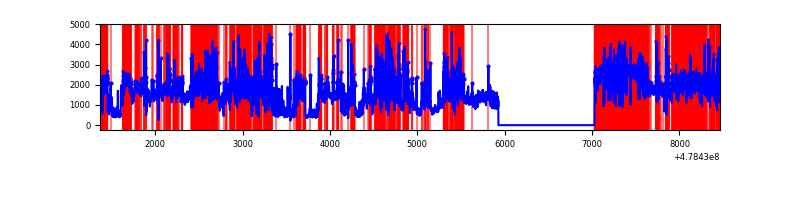 |
| B | 7095 | 5996 | 308 | 308 | 4.34% | 5.14% | 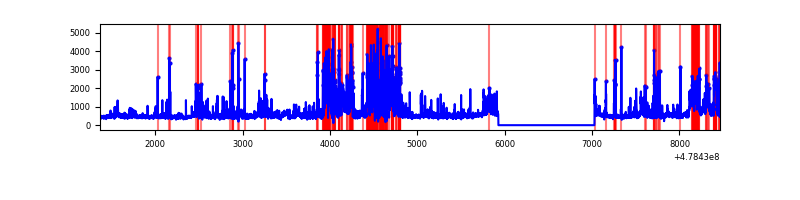 |
| C | 7095 | 5996 | 260 | 260 | 3.66% | 4.34% | 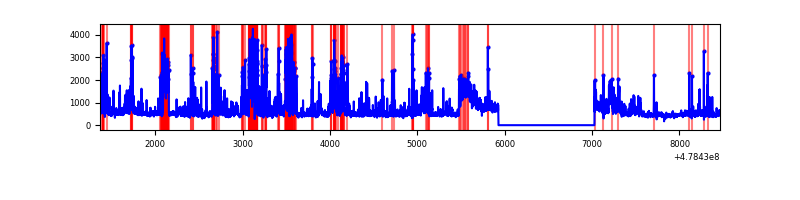 |
| D | 7095 | 5995 | 1481 | 1481 | 20.87% | 24.70% | 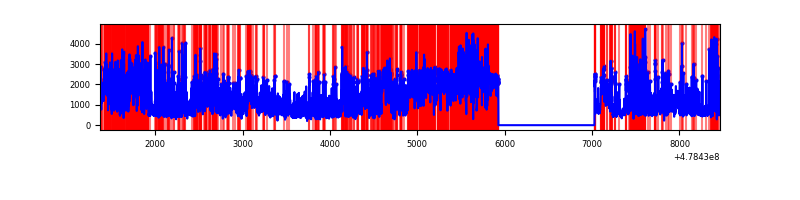 |
Top three noisy pixels from each quadrant. If the there are fewer than three noisy pixels in the level2.evt file, extra rows are filled as -1
| Pixel properties | Quadrant properties | ||||||
|---|---|---|---|---|---|---|---|
| Quadrant | DetID | PixID | Counts | Sigma | Mean | Median | Sigma |
| A | 12 | 80 | 4476612 | 31353.32 | 560 | 546 | 142.8 |
| A | 14 | 254 | 1590648 | 11138.12 | 560 | 546 | 142.8 |
| A | 15 | 249 | 790960 | 5536.58 | 560 | 546 | 142.8 |
| B | 4 | 206 | 923845 | 7132.79 | 619 | 597 | 129.4 |
| B | 5 | 236 | 257286 | 1983.12 | 619 | 597 | 129.4 |
| B | 4 | 171 | 192721 | 1484.3 | 619 | 597 | 129.4 |
| C | 14 | 245 | 475756 | 2834.34 | 611 | 606 | 167.6 |
| C | 4 | 5 | 314022 | 1869.57 | 611 | 606 | 167.6 |
| C | 12 | 247 | 176557 | 1049.57 | 611 | 606 | 167.6 |
| D | 15 | 125 | 4858284 | 60761.81 | 284 | 273 | 80.0 |
| D | 2 | 62 | 1364643 | 17064.92 | 284 | 273 | 80.0 |
| D | 8 | 176 | 542570 | 6782.81 | 284 | 273 | 80.0 |
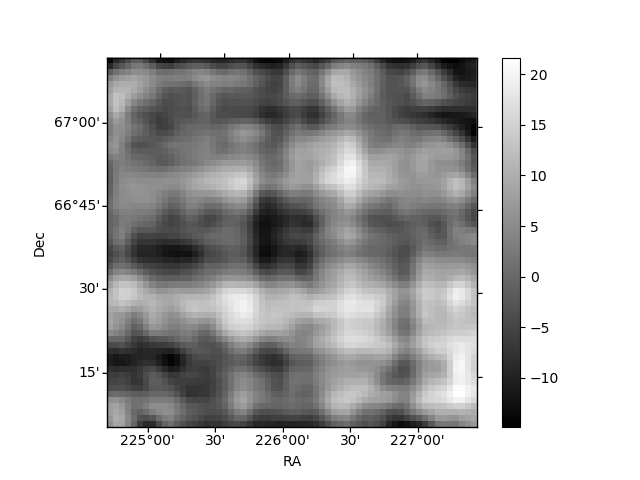
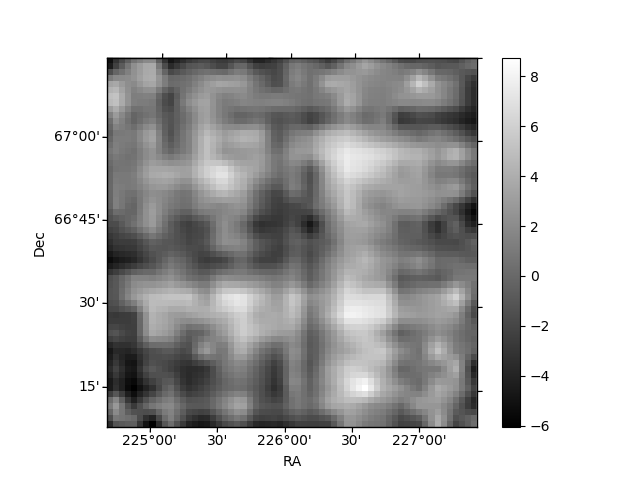
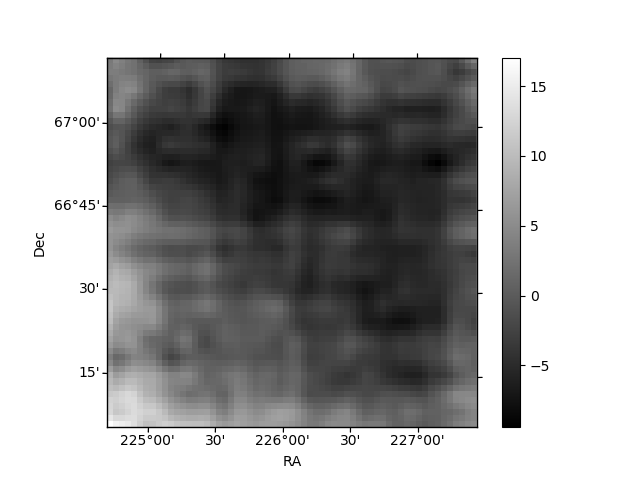
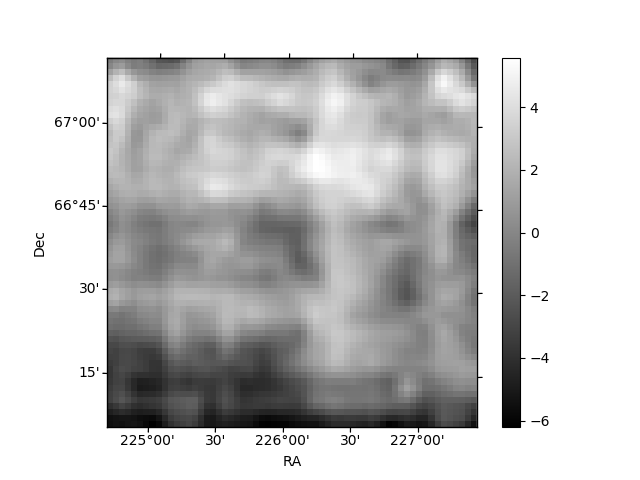
Histogram calculated using DETX and DETY for each event in the final _common_clean file
| Quadrant A | 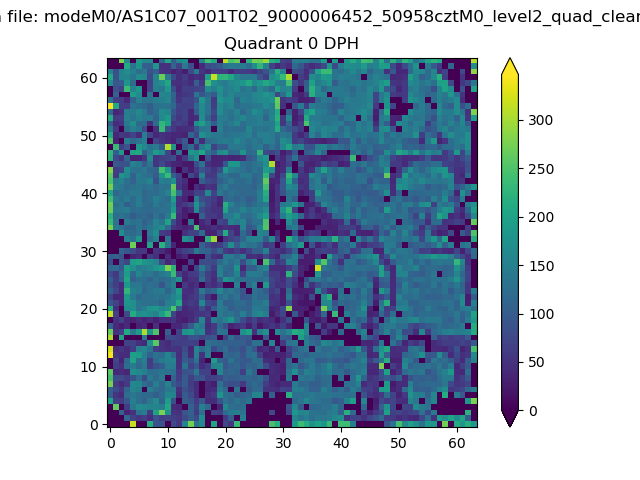 |
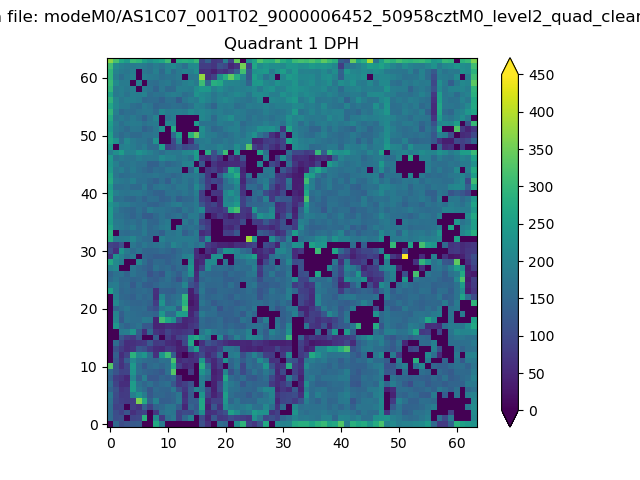 |
Quadrant B |
|---|---|---|---|
| Quadrant D | 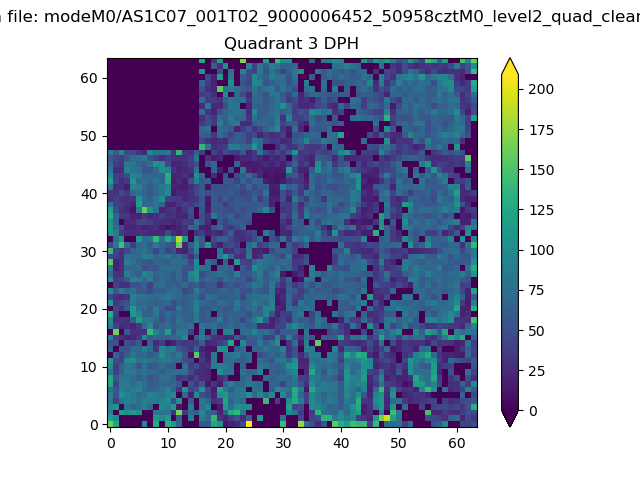 |
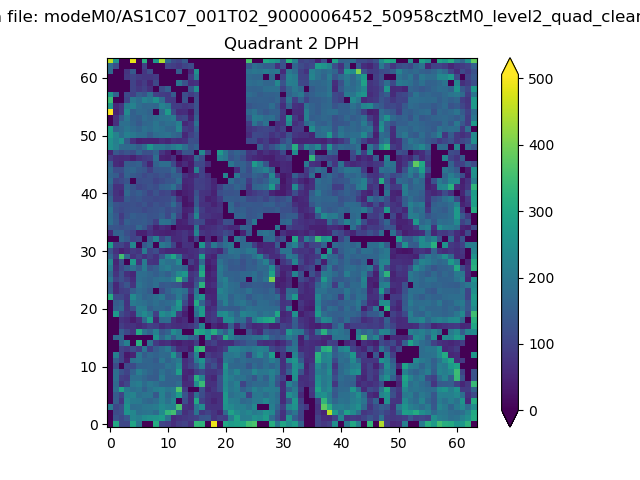 |
Quadrant C |
| Plot type | Count rate plots | Images |
|---|---|---|
| Comparison with Poisson distribution Blue bars denote a histogram of data divided into 1 sec bins. Red curve is a Poisson curve with rate = median count rate of data. |
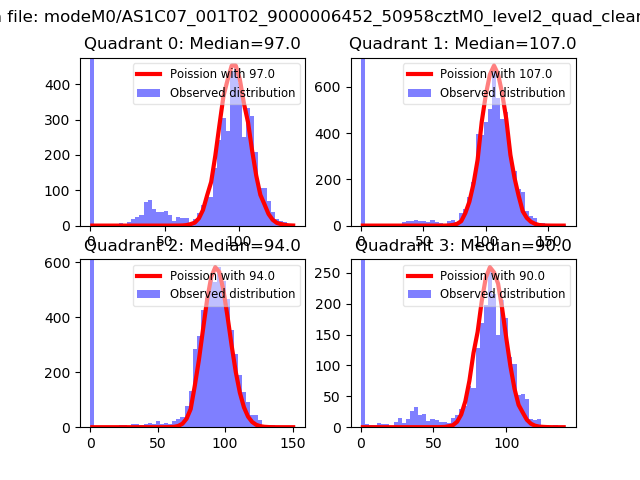 |
 |
| Quadrant-wise count rates Data is divided into 100 sec bins |
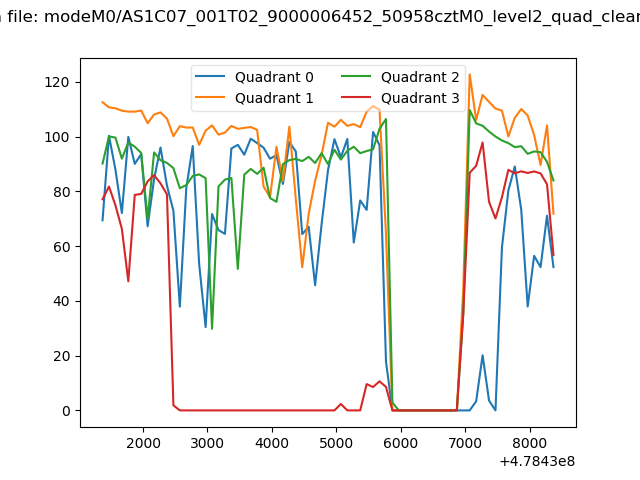 |
|
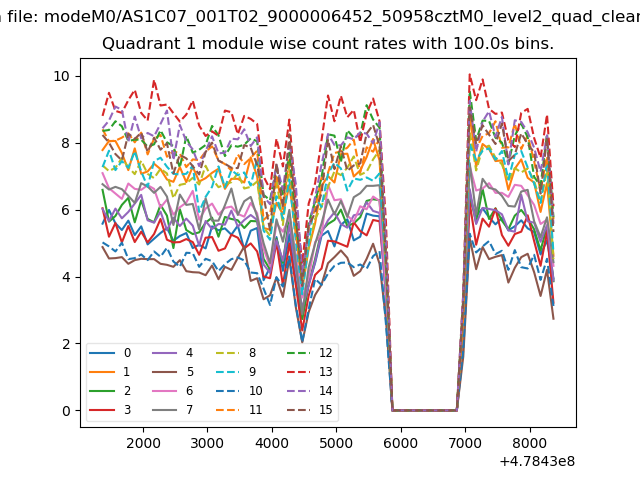
| Module-wise count rates for Quadrant A Data is divided into 100 sec bins |
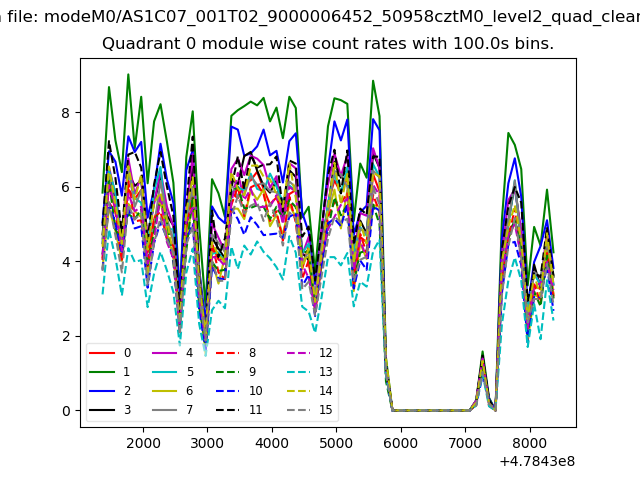 |
 |
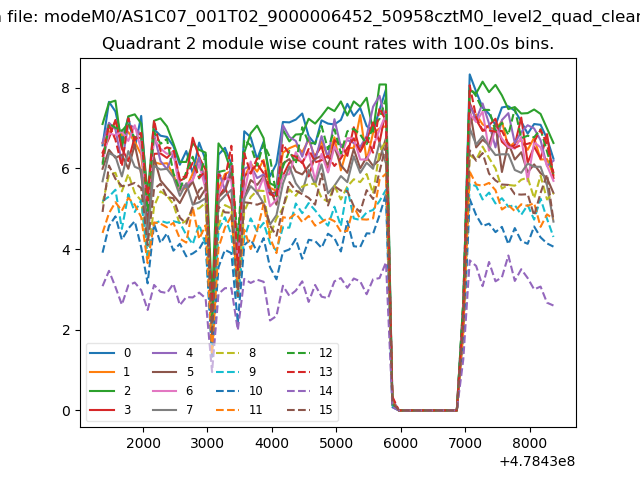
| Module-wise count rates for Quadrant B Data is divided into 100 sec bins |
 |
 |
| Module-wise count rates for Quadrant C Data is divided into 100 sec bins |
 |
 |
| Module-wise count rates for Quadrant D Data is divided into 100 sec bins |
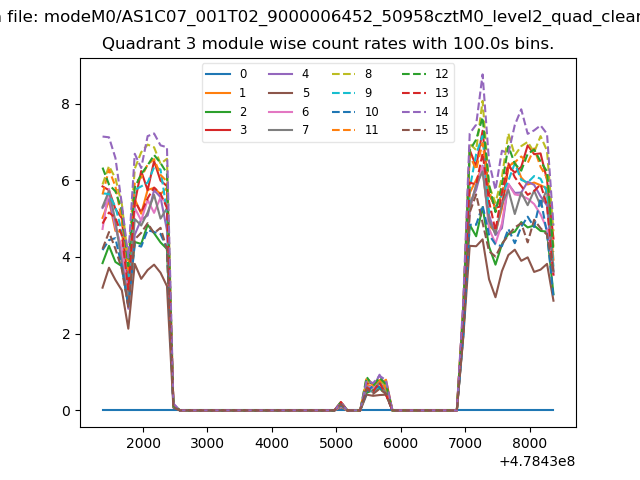 |
 |
| Parameter | Plot |
|---|---|
| CZT HV Monitor | 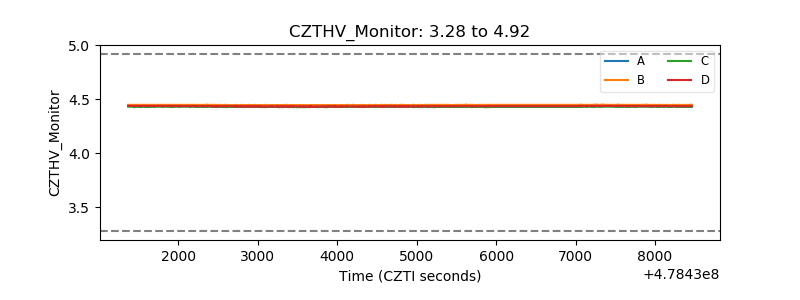 |
| D_VDD | 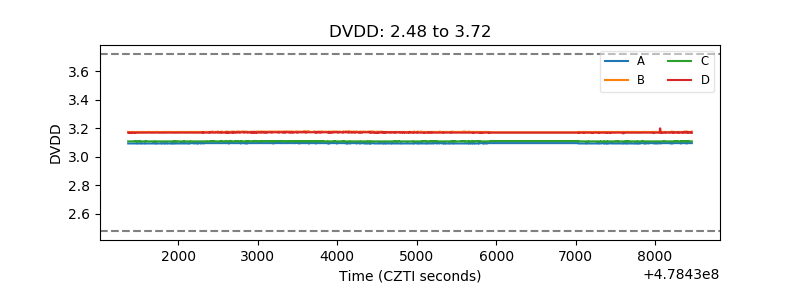 |
| Temperature 1 | 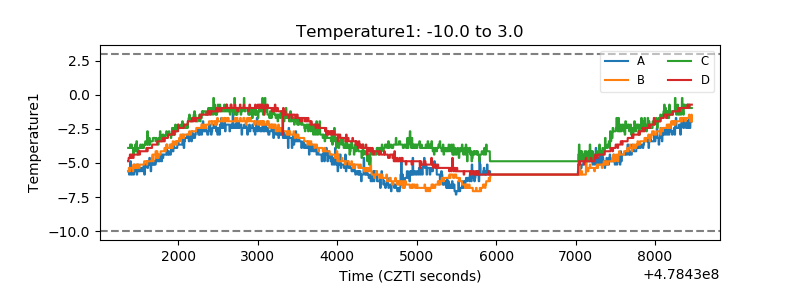 |
| Veto HV Monitor |  |
| Veto LLD | 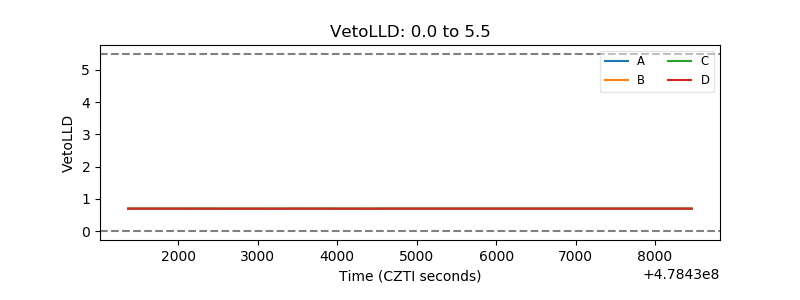 |
| Alpha Counter | 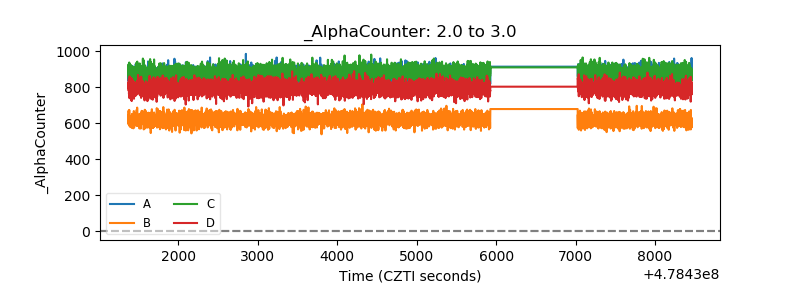 |
| _CPM_Rate | 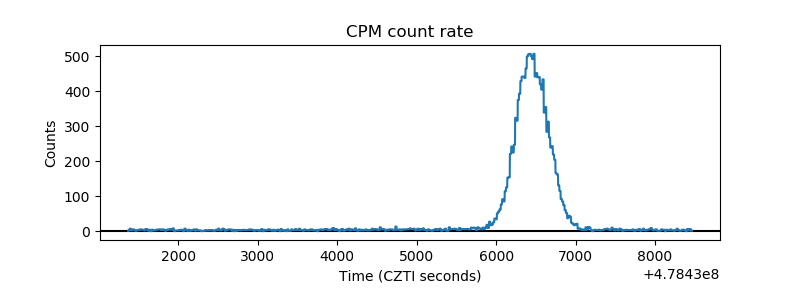 |
| CZT Counter | 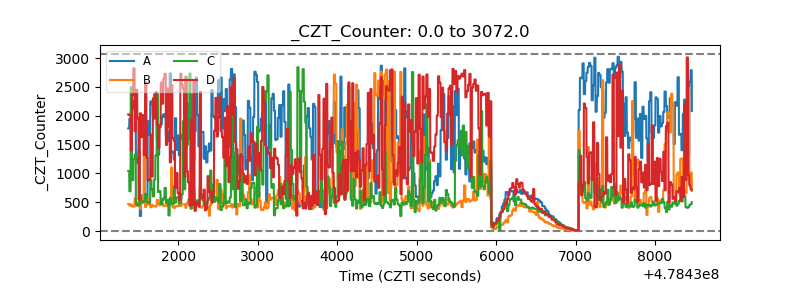 |
| +2.5 Volts monitor | 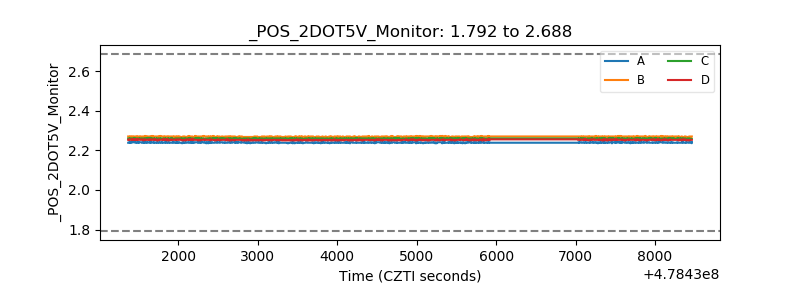 |
| +5 Volts monitor | 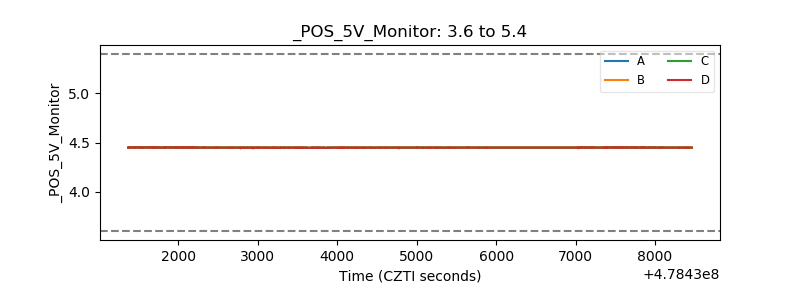 |
| _ROLL_ROT | 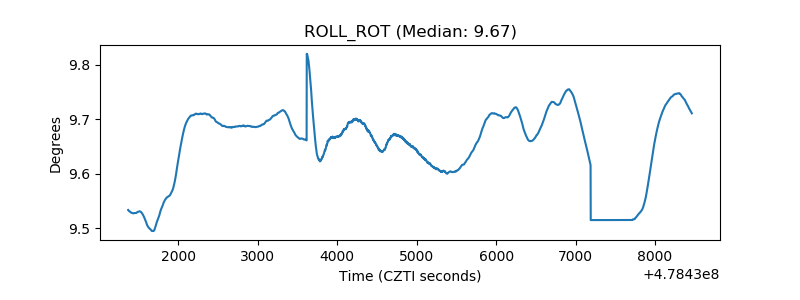 |
| _Roll_DEC | 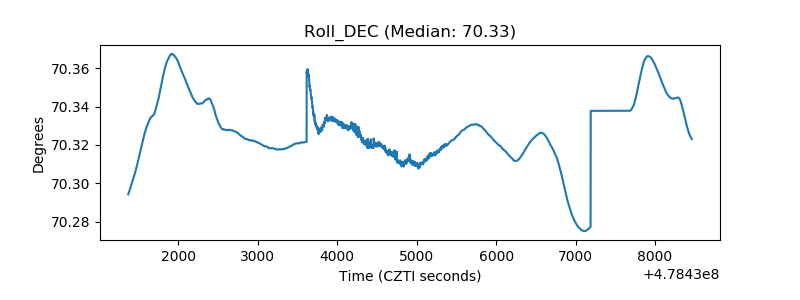 |
| _Roll_RA | 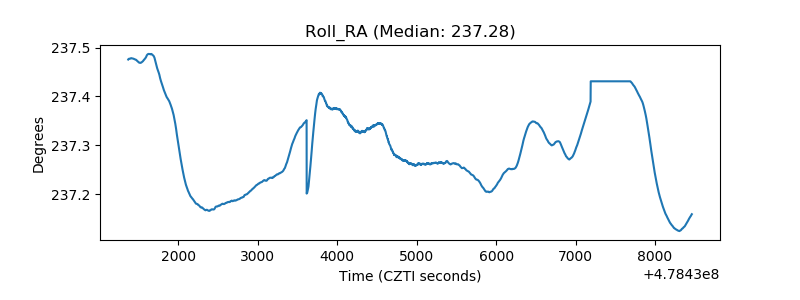 |
| Veto Counter | 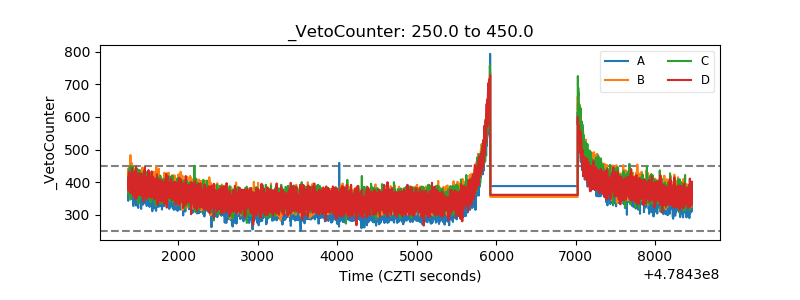 |