| Param | Original file | Final file |
|---|---|---|
| Filename | modeM0/AS1C07_001T02_9000006452_50959cztM0_level2.fits | modeM0/AS1C07_001T02_9000006452_50959cztM0_level2_quad_clean.evt |
| Size (bytes) | 700,583,040 | 82,728,000 |
| Size | 668.1 MB | 78.9 MB |
| Events in quadrant A | 9,323,416 | 417,081 |
| Events in quadrant B | 5,240,917 | 616,136 |
| Events in quadrant C | 3,778,781 | 556,695 |
| Events in quadrant D | 7,105,866 | 477,929 |
| Mode SS | |||
|---|---|---|---|
| Quadrant | BADHDUFLAG | Total packets | Discarded packets |
| A | 0 | 128 | 0 |
| B | 0 | 128 | 0 |
| C | 0 | 128 | 0 |
| D | 0 | 128 | 0 |
| Mode M9 | |||
|---|---|---|---|
| Quadrant | BADHDUFLAG | Total packets | Discarded packets |
| A | 0 | 10 | 0 |
| B | 0 | 10 | 0 |
| C | 0 | 10 | 0 |
| D | 0 | 10 | 0 |
| Mode M0 | |||
|---|---|---|---|
| Quadrant | BADHDUFLAG | Total packets | Discarded packets |
| A | 0 | 32002 | 1 |
| B | 0 | 19875 | 1 |
| C | 0 | 15466 | 9 |
| D | 0 | 25467 | 1 |
| Quadrant | Total seconds | Saturated seconds | Saturation percentage |
|---|---|---|---|
| A | 6254 | 2322 | 37.128238% |
| B | 6255 | 610 | 9.752198% |
| C | 6254 | 231 | 3.693636% |
| D | 6254 | 973 | 15.558043% |
Noise dominated data is calculated using 1-second bins in cleaned event files. If a bin has >2000 counts, and if more than 50% of those come from <1% of pixels, then it is considered to be noise-dominated and hence unusable.
| Quadrant | # 1 sec bins | Bins with >0 counts | Bins with >2000 counts | High rate bins dominated by noise | Noise dominated (total time) | Noise dominated (detector-on time) | Marked lightcurve |
|---|---|---|---|---|---|---|---|
| A | 7290 | 6256 | 1793 | 1793 | 24.60% | 28.66% | 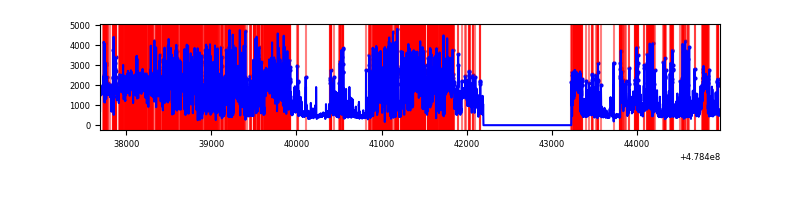 |
| B | 7291 | 6257 | 344 | 344 | 4.72% | 5.50% | 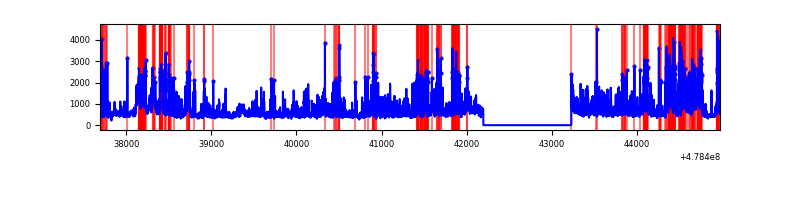 |
| C | 7290 | 6256 | 110 | 110 | 1.51% | 1.76% | 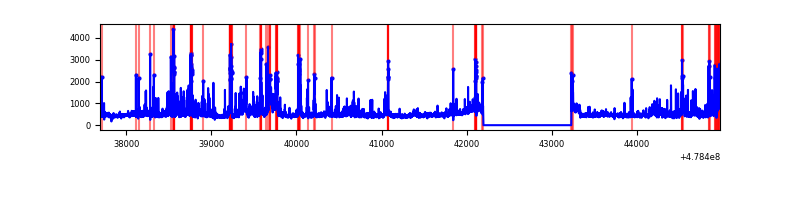 |
| D | 7290 | 6256 | 808 | 808 | 11.08% | 12.92% | 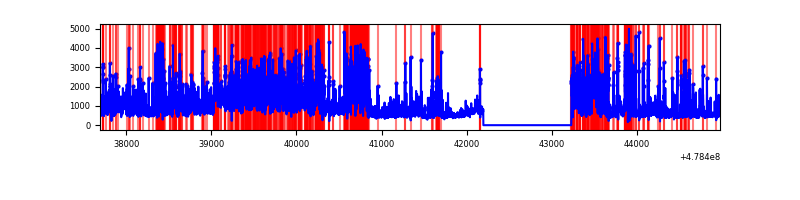 |
Top three noisy pixels from each quadrant. If the there are fewer than three noisy pixels in the level2.evt file, extra rows are filled as -1
| Pixel properties | Quadrant properties | ||||||
|---|---|---|---|---|---|---|---|
| Quadrant | DetID | PixID | Counts | Sigma | Mean | Median | Sigma |
| A | 14 | 254 | 2255177 | 15439.87 | 581 | 564 | 146.0 |
| A | 12 | 80 | 2223510 | 15223.01 | 581 | 564 | 146.0 |
| A | 8 | 43 | 1777480 | 12168.54 | 581 | 564 | 146.0 |
| B | 5 | 236 | 1717133 | 12668.63 | 644 | 621 | 135.5 |
| B | 4 | 171 | 284027 | 2091.66 | 644 | 621 | 135.5 |
| B | 0 | 171 | 149771 | 1100.79 | 644 | 621 | 135.5 |
| C | 0 | 193 | 439011 | 2442.65 | 643 | 635 | 179.5 |
| C | 12 | 247 | 141526 | 785.05 | 643 | 635 | 179.5 |
| C | 0 | 177 | 104355 | 577.93 | 643 | 635 | 179.5 |
| D | 8 | 176 | 1488396 | 8762.82 | 610 | 588 | 169.8 |
| D | 2 | 62 | 1465589 | 8628.5 | 610 | 588 | 169.8 |
| D | 10 | 172 | 537484 | 3162.19 | 610 | 588 | 169.8 |
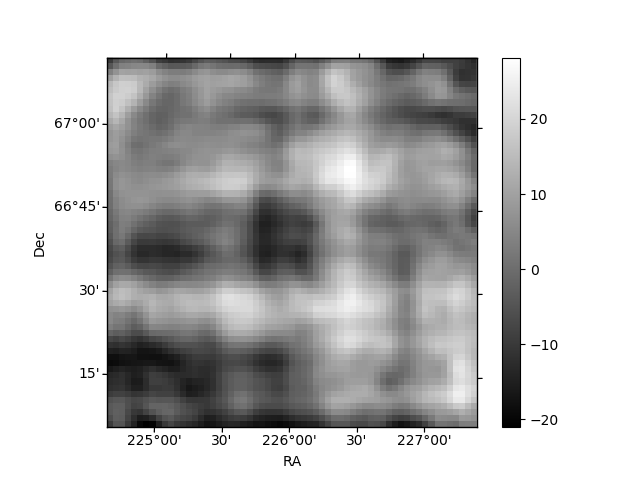
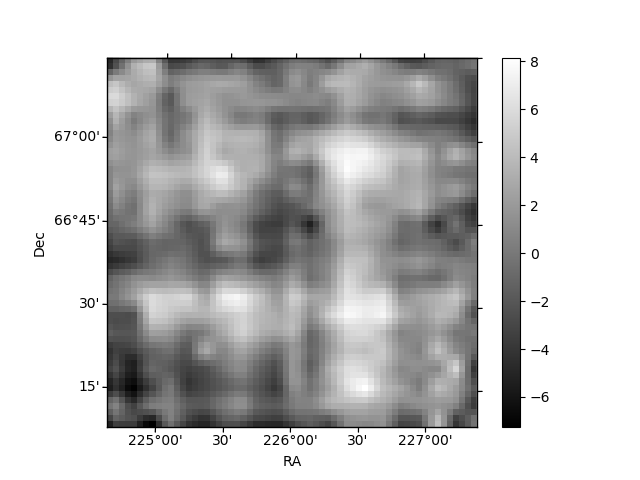
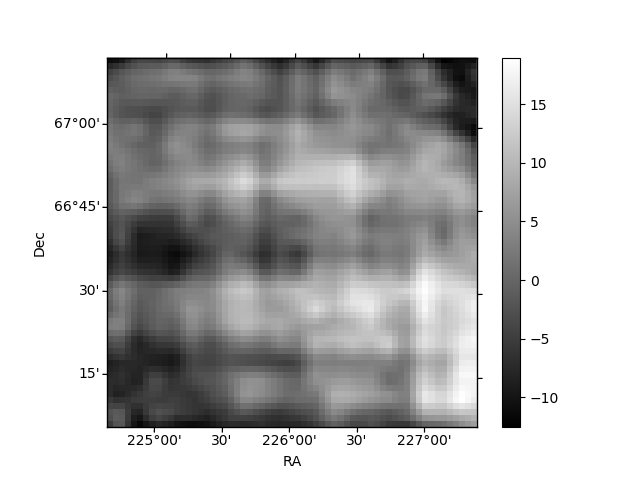
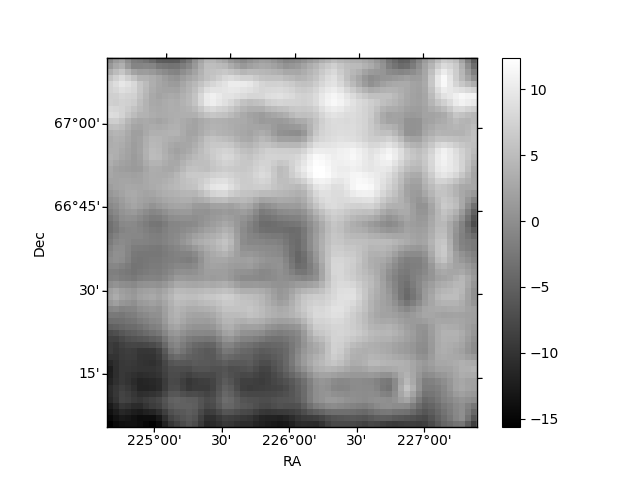
Histogram calculated using DETX and DETY for each event in the final _common_clean file
| Quadrant A | 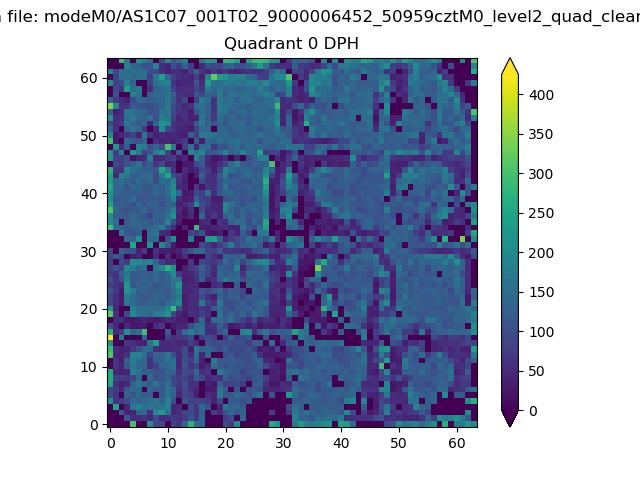 |
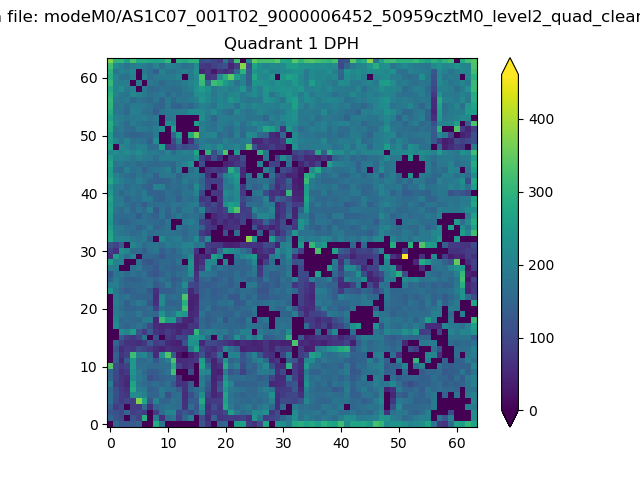 |
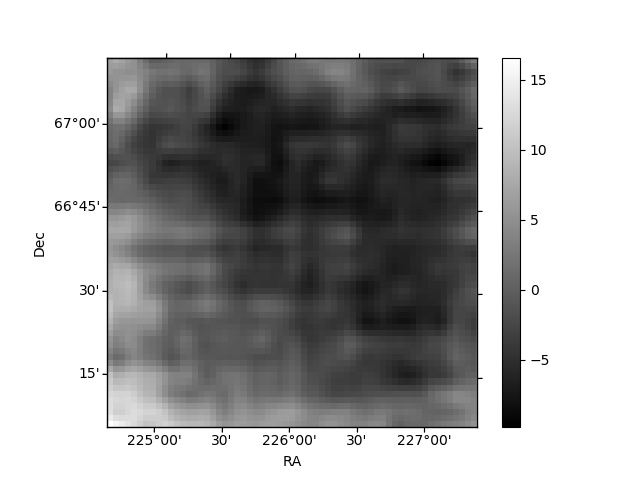
Quadrant B |
|---|---|---|---|
| Quadrant D | 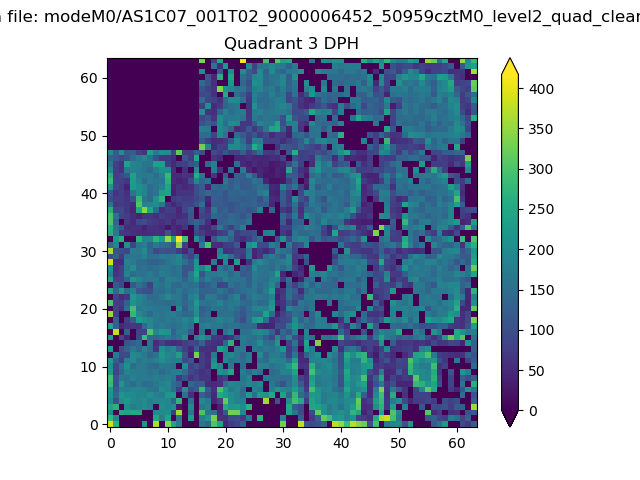 |
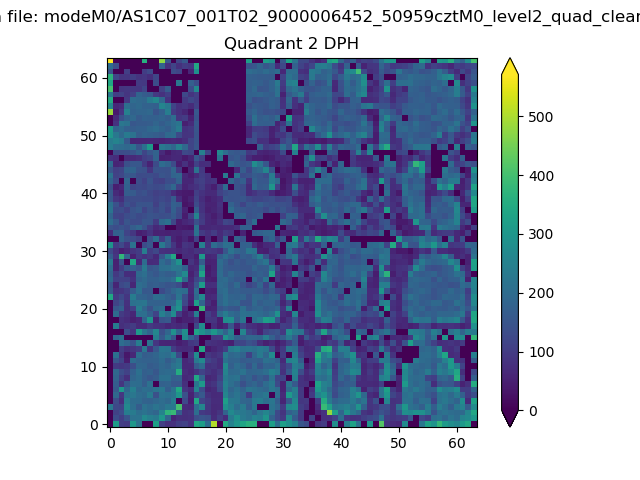 |
Quadrant C |
| Plot type | Count rate plots | Images |
|---|---|---|
| Comparison with Poisson distribution Blue bars denote a histogram of data divided into 1 sec bins. Red curve is a Poisson curve with rate = median count rate of data. |
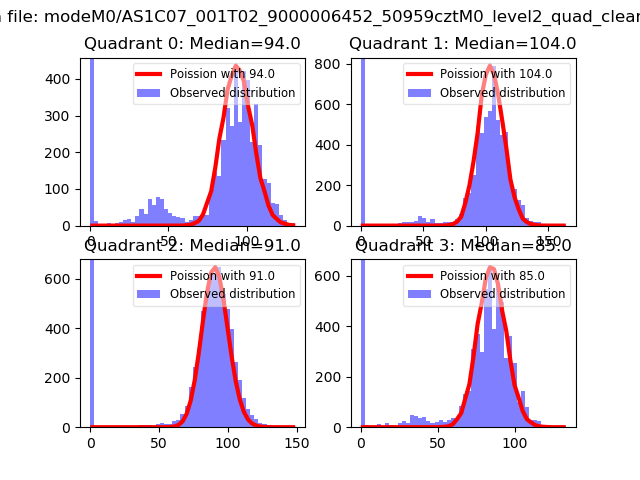 |
 |
| Quadrant-wise count rates Data is divided into 100 sec bins |
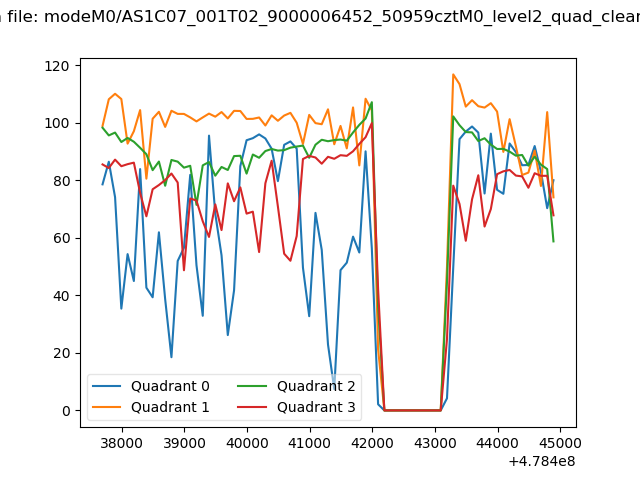 |
|
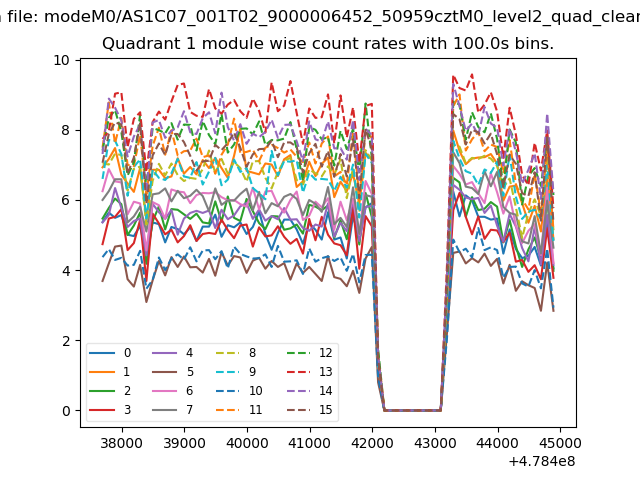
| Module-wise count rates for Quadrant A Data is divided into 100 sec bins |
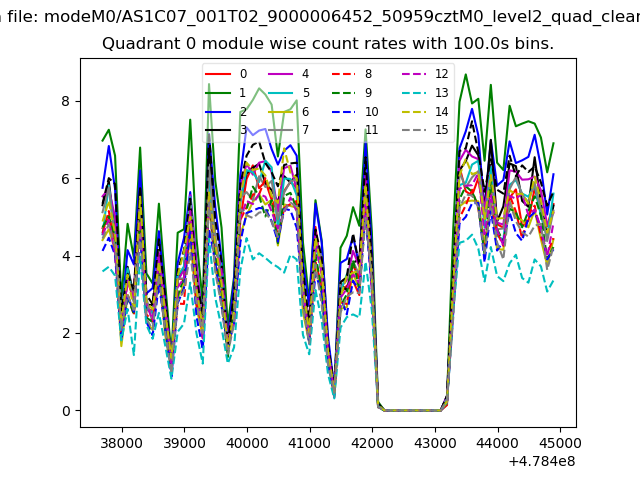 |
 |
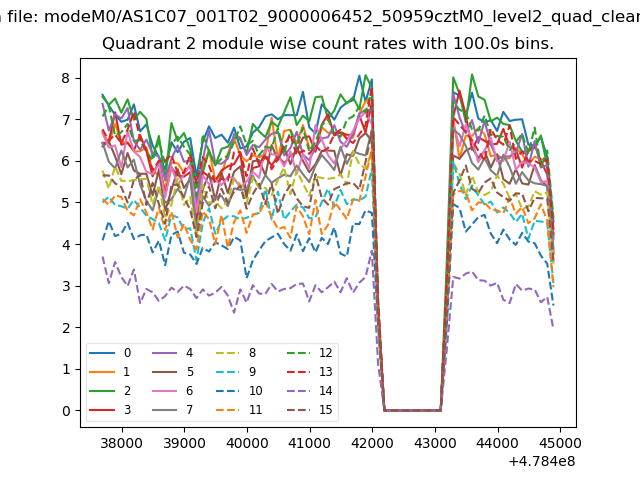
| Module-wise count rates for Quadrant B Data is divided into 100 sec bins |
 |
 |
| Module-wise count rates for Quadrant C Data is divided into 100 sec bins |
 |
 |
| Module-wise count rates for Quadrant D Data is divided into 100 sec bins |
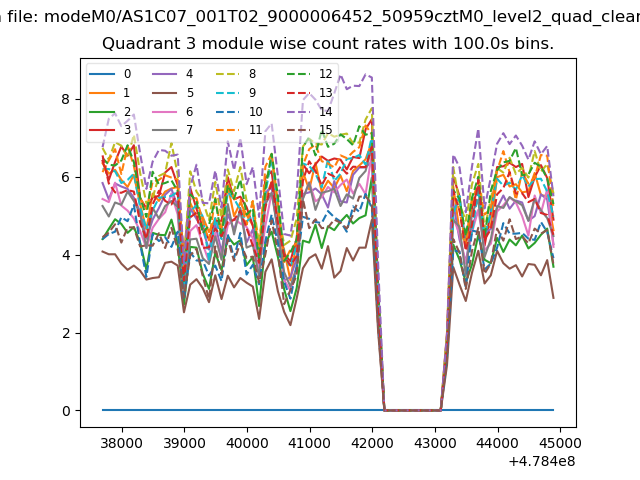 |
 |
| Parameter | Plot |
|---|---|
| CZT HV Monitor |  |
| D_VDD | 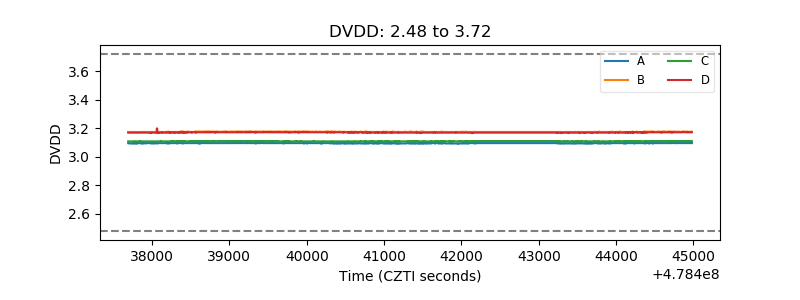 |
| Temperature 1 | 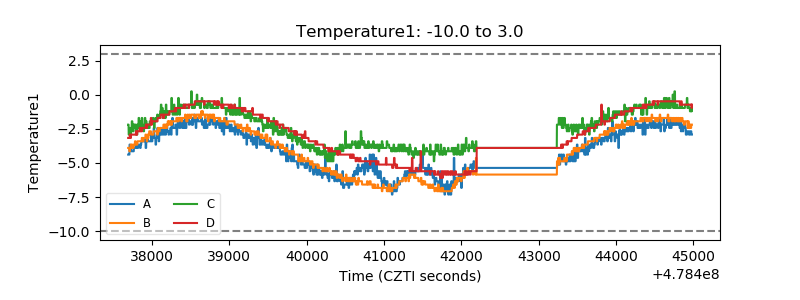 |
| Veto HV Monitor | 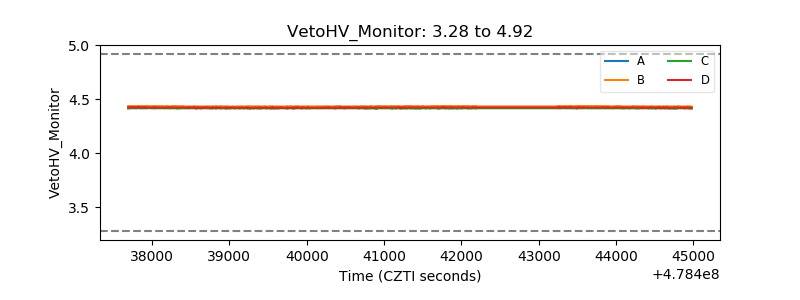 |
| Veto LLD | 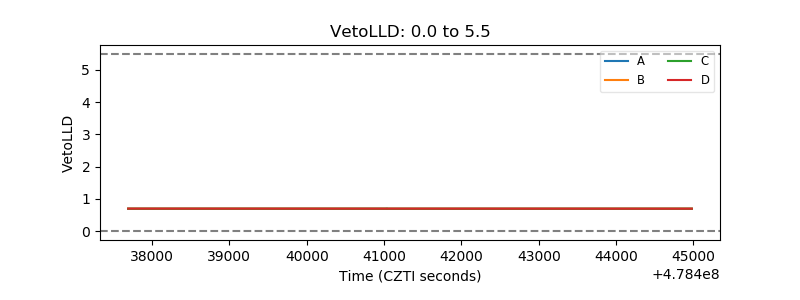 |
| Alpha Counter | 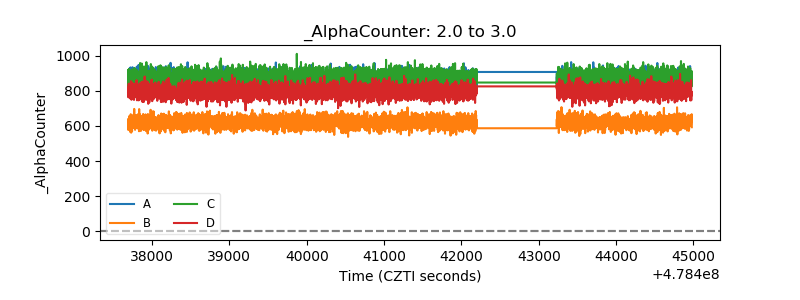 |
| _CPM_Rate | 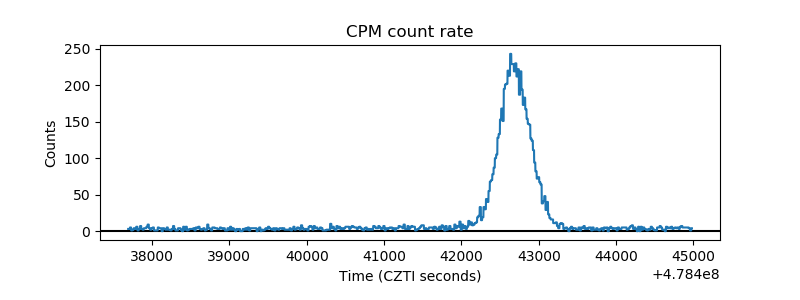 |
| CZT Counter | 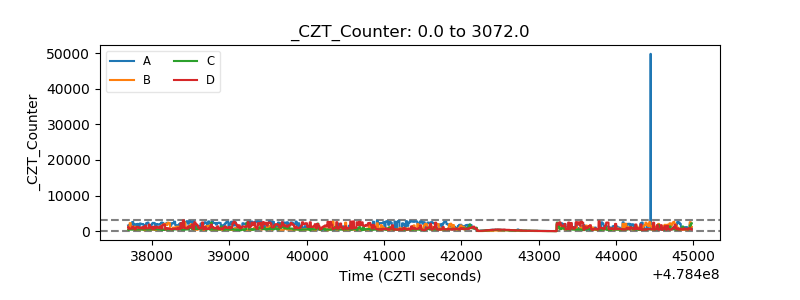 |
| +2.5 Volts monitor | 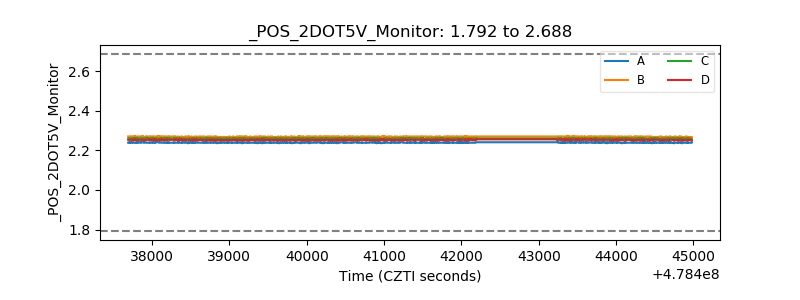 |
| +5 Volts monitor | 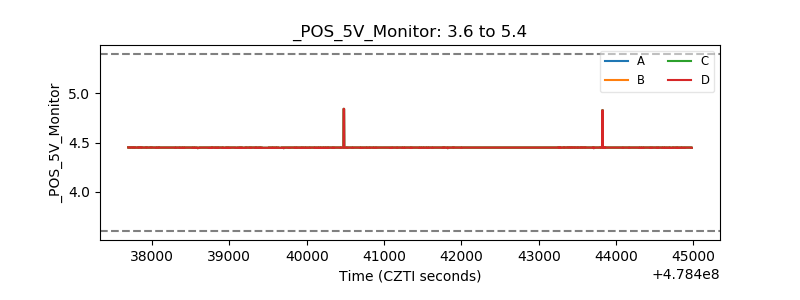 |
| _ROLL_ROT | 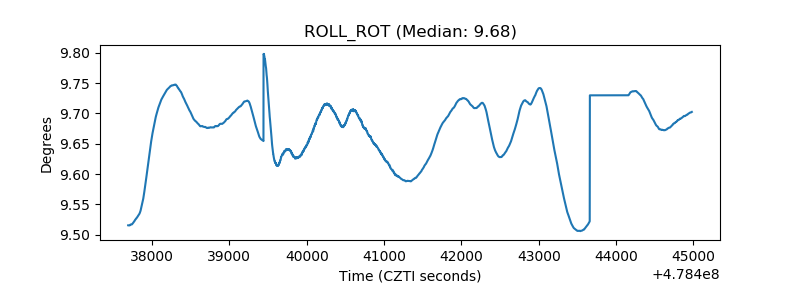 |
| _Roll_DEC | 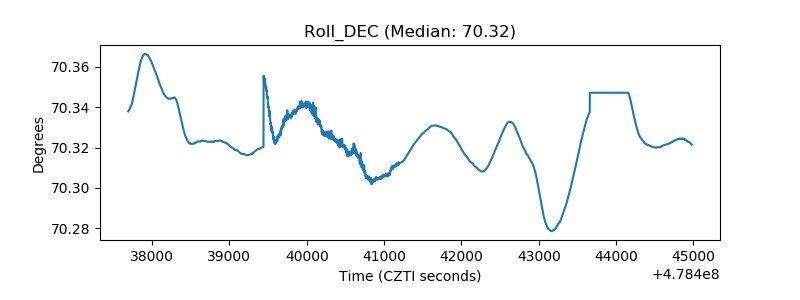 |
| _Roll_RA | 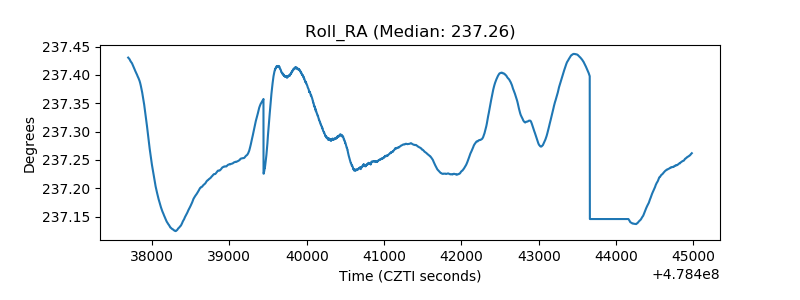 |
| Veto Counter | 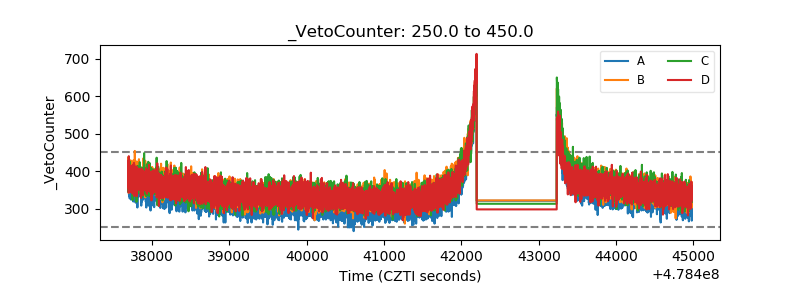 |