| Param | Original file | Final file |
|---|---|---|
| Filename | modeM0/AS1C07_001T02_9000006452_50960cztM0_level2.fits | modeM0/AS1C07_001T02_9000006452_50960cztM0_level2_quad_clean.evt |
| Size (bytes) | 719,688,960 | 77,031,360 |
| Size | 686.3 MB | 73.5 MB |
| Events in quadrant A | 7,497,536 | 482,369 |
| Events in quadrant B | 8,988,634 | 410,903 |
| Events in quadrant C | 4,208,018 | 526,376 |
| Events in quadrant D | 5,470,433 | 483,277 |
| Mode SS | |||
|---|---|---|---|
| Quadrant | BADHDUFLAG | Total packets | Discarded packets |
| A | 0 | 124 | 0 |
| B | 0 | 124 | 0 |
| C | 0 | 124 | 0 |
| D | 0 | 124 | 0 |
| Mode M9 | |||
|---|---|---|---|
| Quadrant | BADHDUFLAG | Total packets | Discarded packets |
| A | 0 | 8 | 0 |
| B | 0 | 8 | 0 |
| C | 0 | 8 | 0 |
| D | 0 | 8 | 0 |
| Mode M0 | |||
|---|---|---|---|
| Quadrant | BADHDUFLAG | Total packets | Discarded packets |
| A | 0 | 26507 | 1 |
| B | 0 | 30994 | 1 |
| C | 0 | 16641 | 1 |
| D | 0 | 20444 | 1 |
| Quadrant | Total seconds | Saturated seconds | Saturation percentage |
|---|---|---|---|
| A | 6147 | 1345 | 21.880592% |
| B | 6148 | 2460 | 40.013012% |
| C | 6147 | 432 | 7.027818% |
| D | 6147 | 591 | 9.614446% |
Noise dominated data is calculated using 1-second bins in cleaned event files. If a bin has >2000 counts, and if more than 50% of those come from <1% of pixels, then it is considered to be noise-dominated and hence unusable.
| Quadrant | # 1 sec bins | Bins with >0 counts | Bins with >2000 counts | High rate bins dominated by noise | Noise dominated (total time) | Noise dominated (detector-on time) | Marked lightcurve |
|---|---|---|---|---|---|---|---|
| A | 6922 | 6148 | 1120 | 1120 | 16.18% | 18.22% | 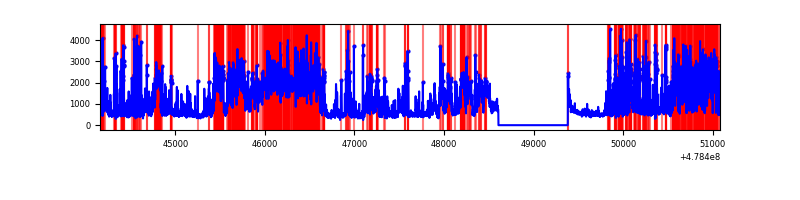 |
| B | 6922 | 6148 | 1994 | 1994 | 28.81% | 32.43% | 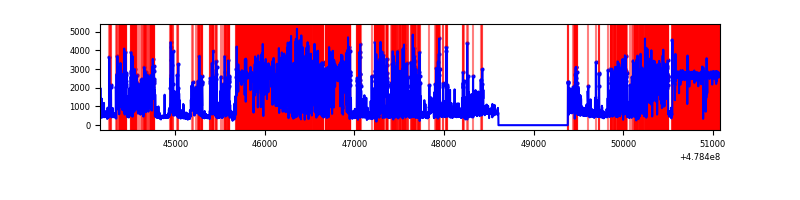 |
| C | 6922 | 6148 | 259 | 259 | 3.74% | 4.21% | 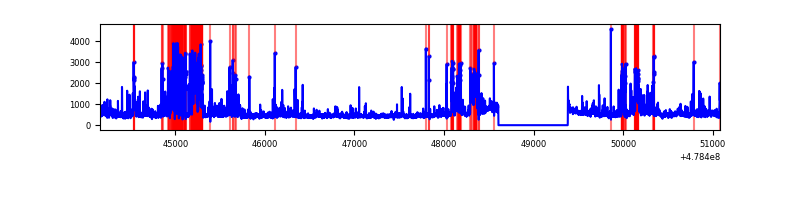 |
| D | 6922 | 6148 | 419 | 419 | 6.05% | 6.82% | 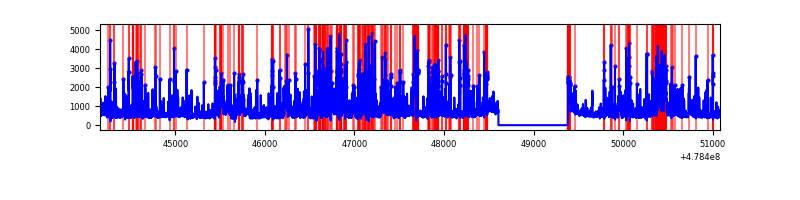 |
Top three noisy pixels from each quadrant. If the there are fewer than three noisy pixels in the level2.evt file, extra rows are filled as -1
| Pixel properties | Quadrant properties | ||||||
|---|---|---|---|---|---|---|---|
| Quadrant | DetID | PixID | Counts | Sigma | Mean | Median | Sigma |
| A | 12 | 80 | 2134604 | 13941.4 | 616 | 599 | 153.1 |
| A | 8 | 43 | 1125301 | 7347.65 | 616 | 599 | 153.1 |
| A | 14 | 254 | 1069549 | 6983.42 | 616 | 599 | 153.1 |
| B | 5 | 236 | 6271211 | 58002.85 | 511 | 494 | 108.1 |
| B | 8 | 128 | 186400 | 1719.59 | 511 | 494 | 108.1 |
| B | 4 | 206 | 129151 | 1190.05 | 511 | 494 | 108.1 |
| C | 1 | 29 | 526978 | 3066.67 | 624 | 617 | 171.6 |
| C | 13 | 3 | 302432 | 1758.43 | 624 | 617 | 171.6 |
| C | 3 | 233 | 131334 | 761.58 | 624 | 617 | 171.6 |
| D | 8 | 176 | 869400 | 5084.89 | 610 | 588 | 170.9 |
| D | 3 | 12 | 685006 | 4005.69 | 610 | 588 | 170.9 |
| D | 10 | 181 | 438427 | 2562.54 | 610 | 588 | 170.9 |
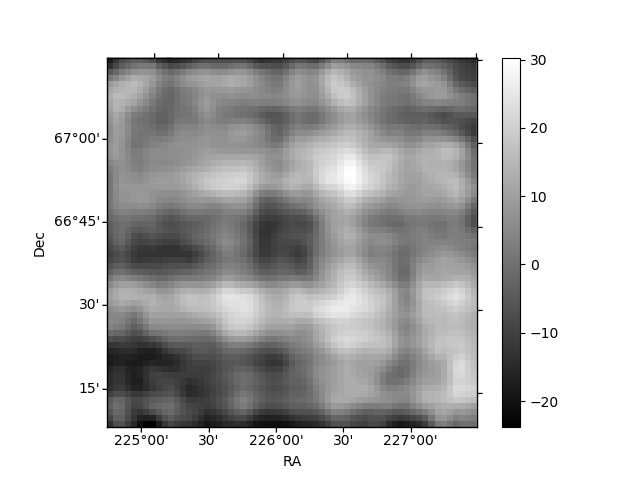
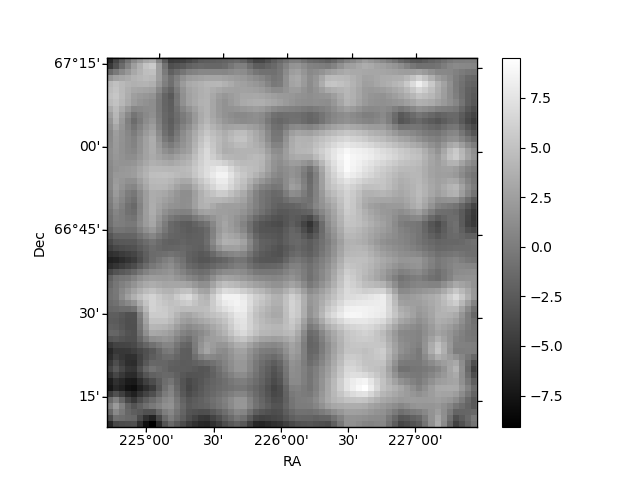
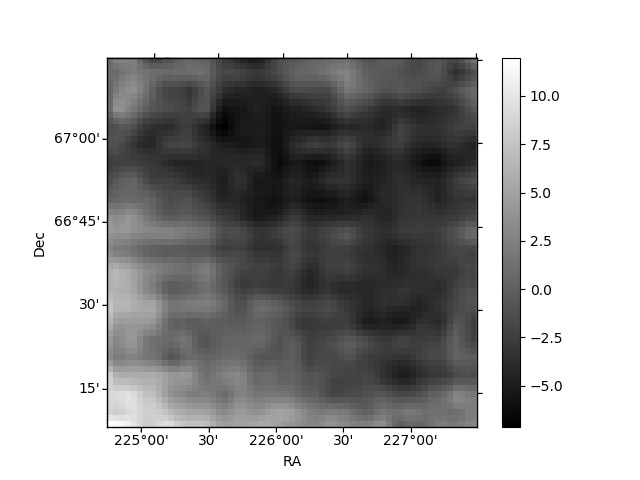
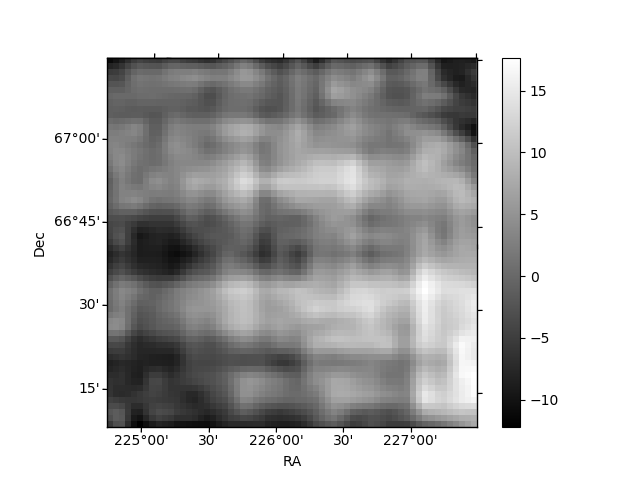
Histogram calculated using DETX and DETY for each event in the final _common_clean file
| Quadrant A | 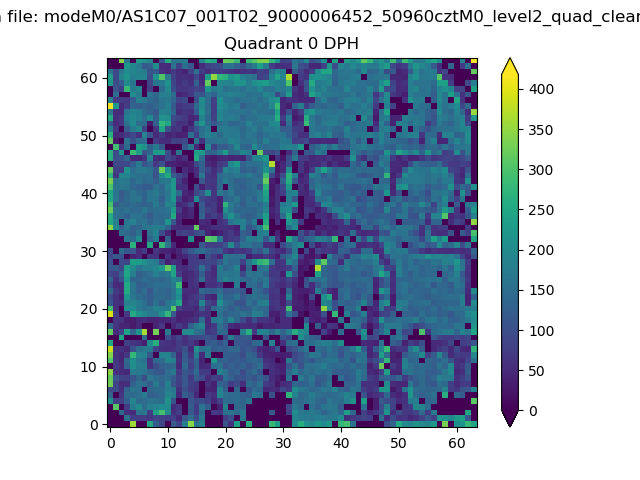 |
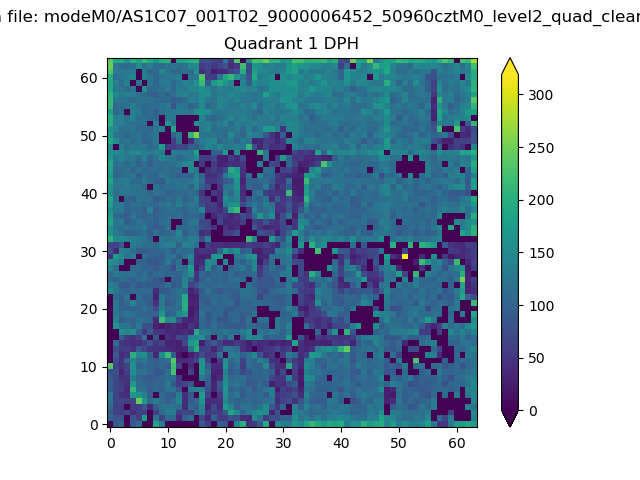 |
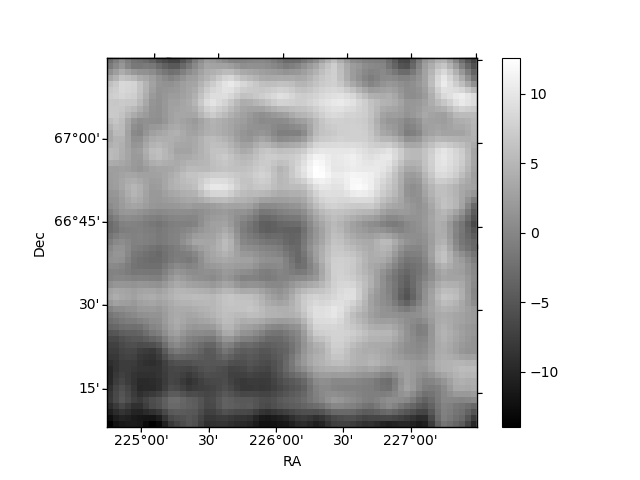
Quadrant B |
|---|---|---|---|
| Quadrant D | 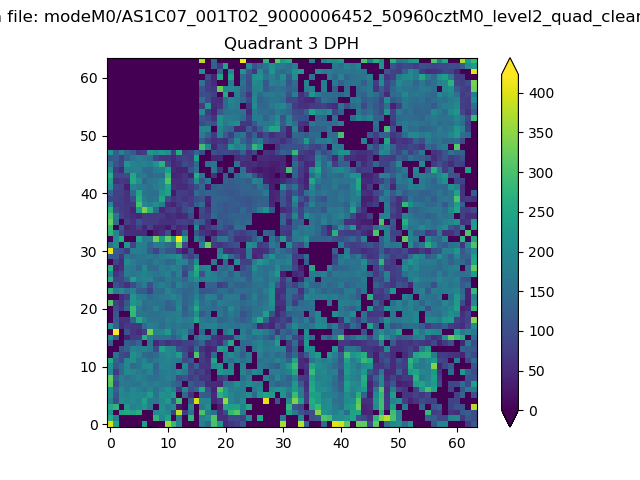 |
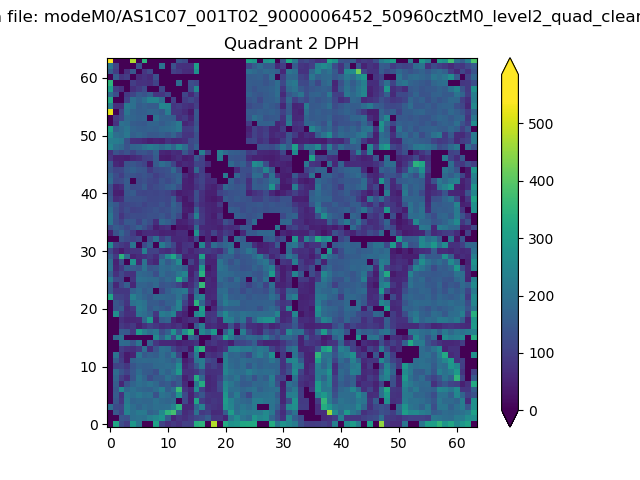 |
Quadrant C |
| Plot type | Count rate plots | Images |
|---|---|---|
| Comparison with Poisson distribution Blue bars denote a histogram of data divided into 1 sec bins. Red curve is a Poisson curve with rate = median count rate of data. |
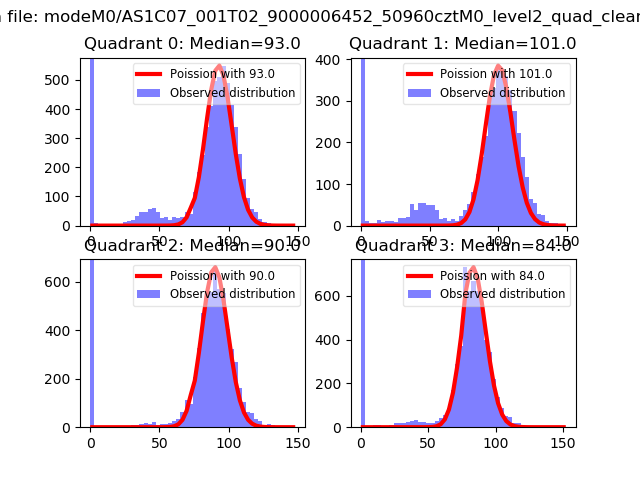 |
 |
| Quadrant-wise count rates Data is divided into 100 sec bins |
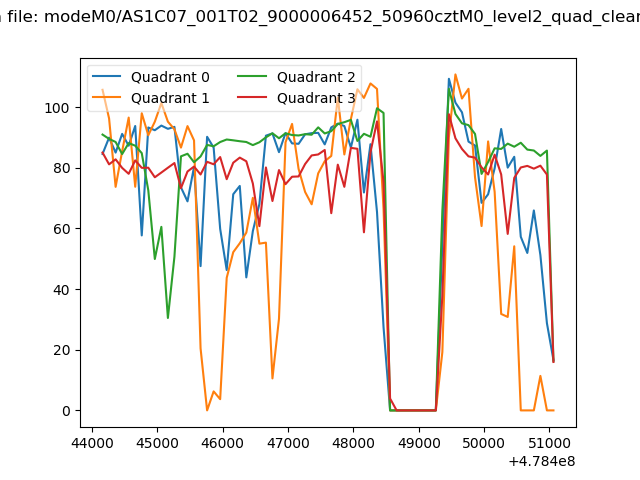 |
|
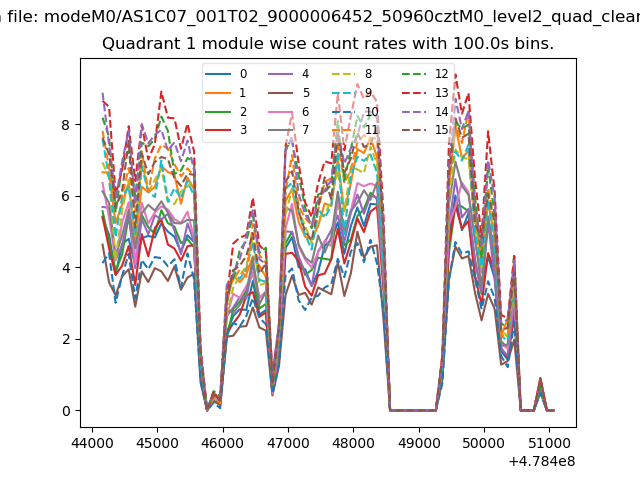
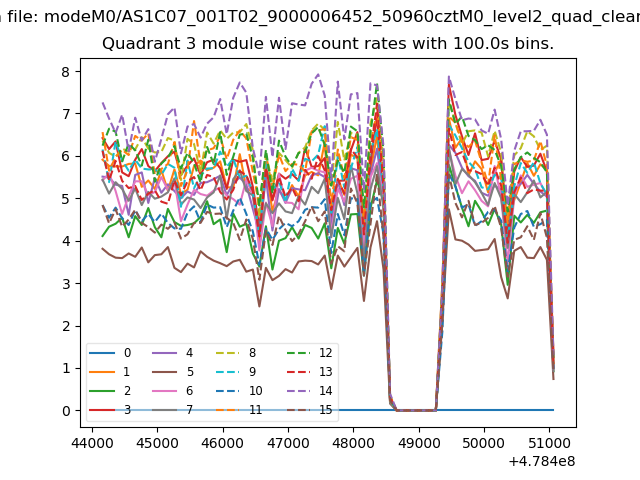
| Module-wise count rates for Quadrant A Data is divided into 100 sec bins |
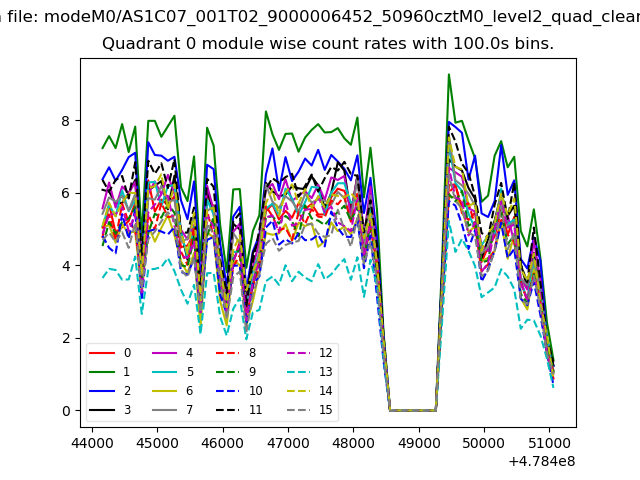 |
 |
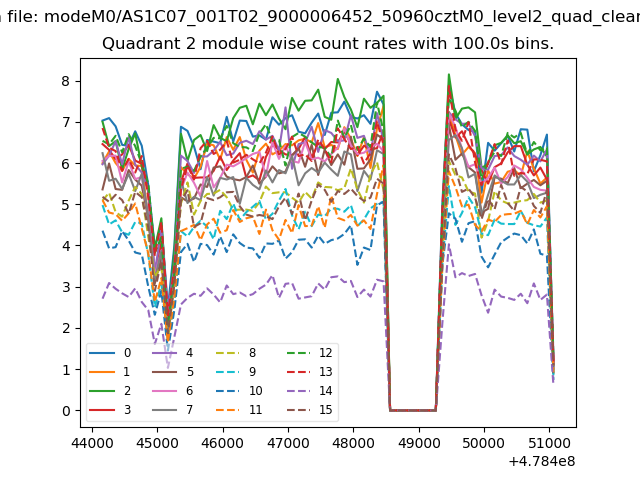
| Module-wise count rates for Quadrant B Data is divided into 100 sec bins |
 |
 |
| Module-wise count rates for Quadrant C Data is divided into 100 sec bins |
 |
 |
| Module-wise count rates for Quadrant D Data is divided into 100 sec bins |
 |
 |
| Parameter | Plot |
|---|---|
| CZT HV Monitor | 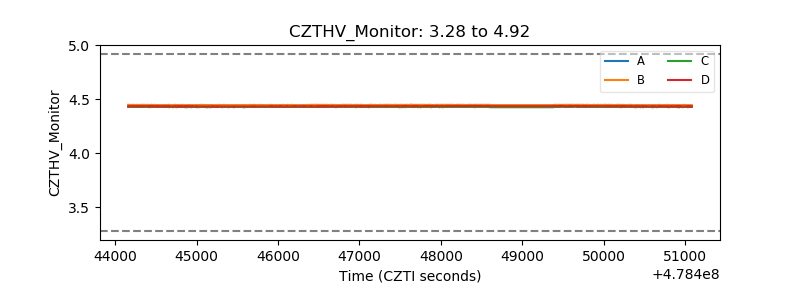 |
| D_VDD | 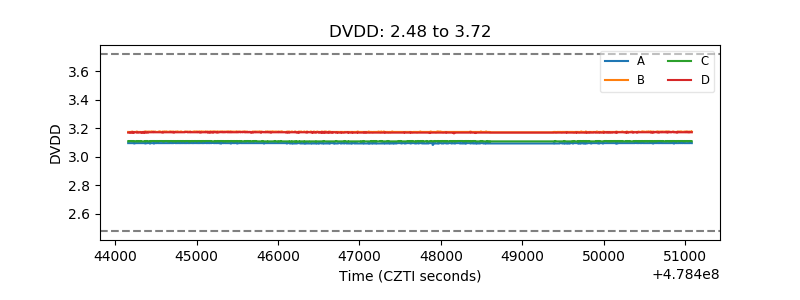 |
| Temperature 1 | 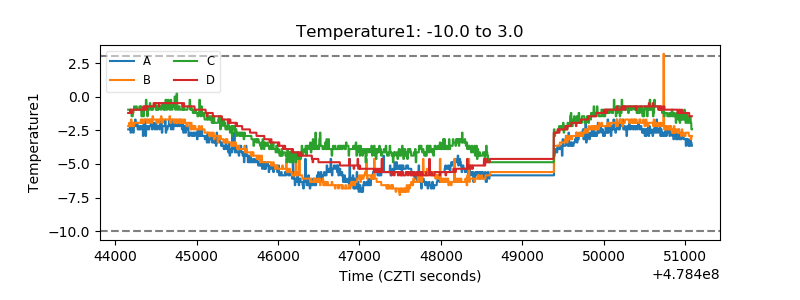 |
| Veto HV Monitor | 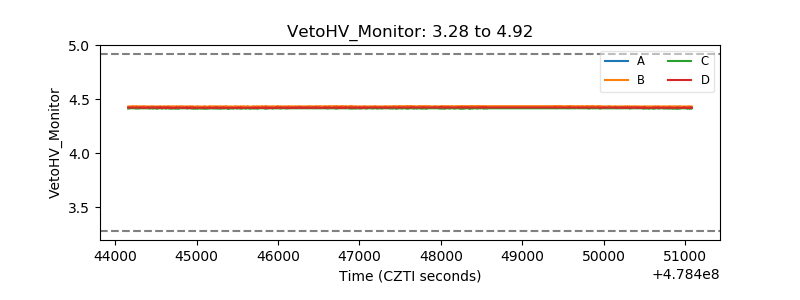 |
| Veto LLD | 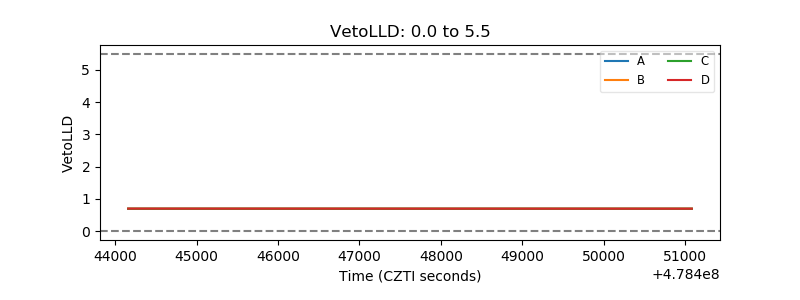 |
| Alpha Counter | 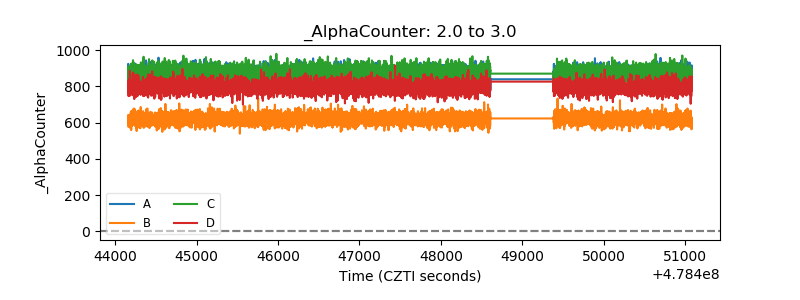 |
| _CPM_Rate | 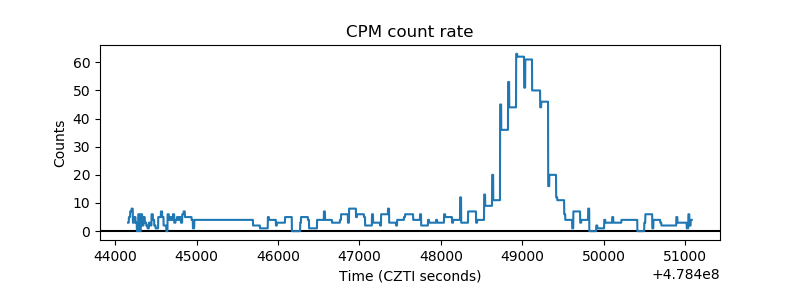 |
| CZT Counter | 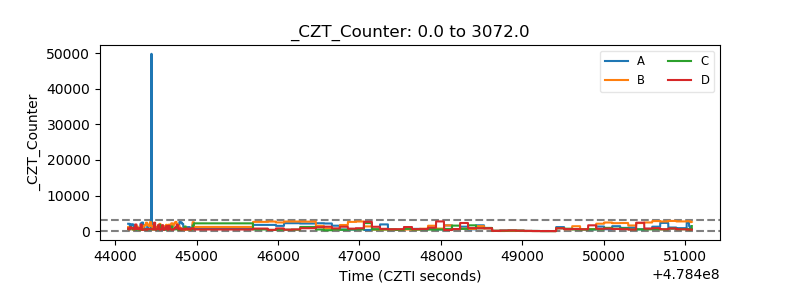 |
| +2.5 Volts monitor | 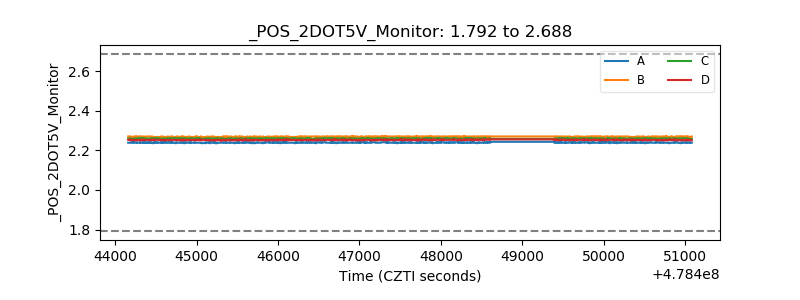 |
| +5 Volts monitor |  |
| _ROLL_ROT | 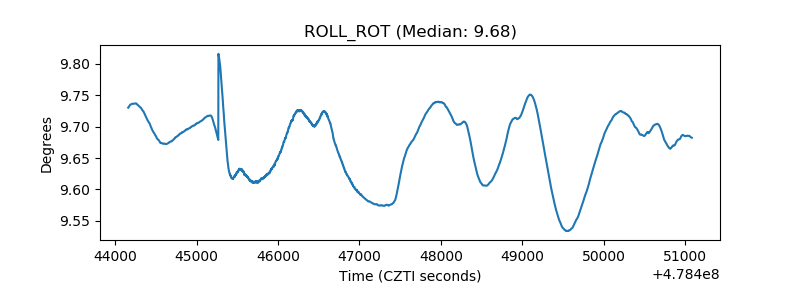 |
| _Roll_DEC | 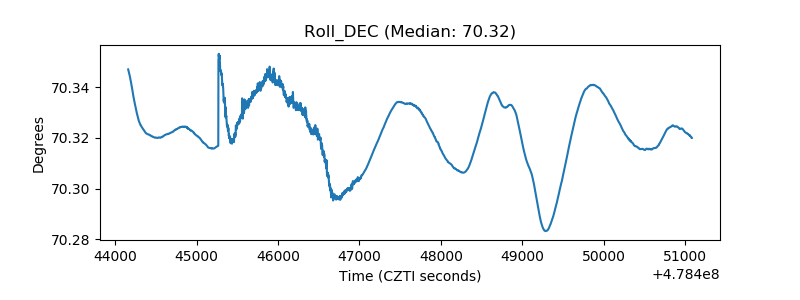 |
| _Roll_RA | 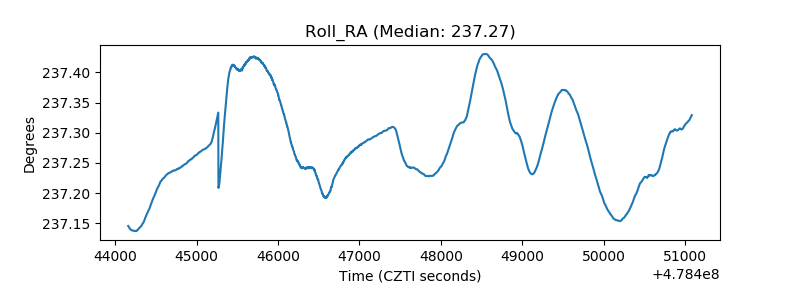 |
| Veto Counter | 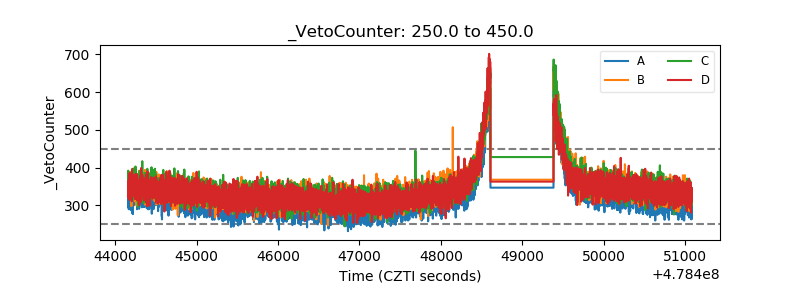 |