| Param | Original file | Final file |
|---|---|---|
| Filename | modeM0/AS1C07_001T02_9000006452_50961cztM0_level2.fits | modeM0/AS1C07_001T02_9000006452_50961cztM0_level2_quad_clean.evt |
| Size (bytes) | 912,211,200 | 83,488,320 |
| Size | 870.0 MB | 79.6 MB |
| Events in quadrant A | 7,196,194 | 598,060 |
| Events in quadrant B | 13,414,234 | 311,891 |
| Events in quadrant C | 4,681,013 | 622,604 |
| Events in quadrant D | 7,919,027 | 494,831 |
| Mode SS | |||
|---|---|---|---|
| Quadrant | BADHDUFLAG | Total packets | Discarded packets |
| A | 0 | 146 | 0 |
| B | 0 | 146 | 0 |
| C | 0 | 146 | 0 |
| D | 0 | 146 | 0 |
| Mode M9 | |||
|---|---|---|---|
| Quadrant | BADHDUFLAG | Total packets | Discarded packets |
| A | 0 | 3 | 0 |
| B | 0 | 3 | 0 |
| C | 0 | 3 | 0 |
| D | 0 | 3 | 0 |
| Mode M0 | |||
|---|---|---|---|
| Quadrant | BADHDUFLAG | Total packets | Discarded packets |
| A | 0 | 26379 | 1 |
| B | 0 | 44848 | 1 |
| C | 0 | 18789 | 1 |
| D | 0 | 28542 | 1 |
| Quadrant | Total seconds | Saturated seconds | Saturation percentage |
|---|---|---|---|
| A | 7191 | 1219 | 16.951745% |
| B | 7191 | 4416 | 61.410096% |
| C | 7192 | 386 | 5.367075% |
| D | 7192 | 1479 | 20.564516% |
Noise dominated data is calculated using 1-second bins in cleaned event files. If a bin has >2000 counts, and if more than 50% of those come from <1% of pixels, then it is considered to be noise-dominated and hence unusable.
| Quadrant | # 1 sec bins | Bins with >0 counts | Bins with >2000 counts | High rate bins dominated by noise | Noise dominated (total time) | Noise dominated (detector-on time) | Marked lightcurve |
|---|---|---|---|---|---|---|---|
| A | 7431 | 7194 | 921 | 921 | 12.39% | 12.80% | 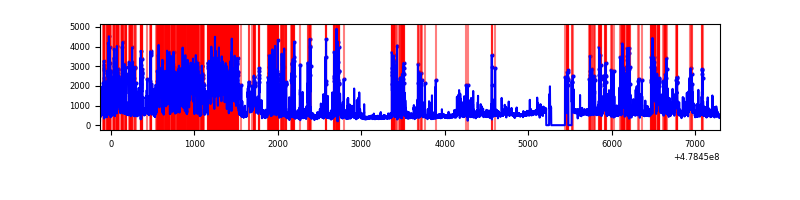 |
| B | 7431 | 7192 | 3979 | 3979 | 53.55% | 55.33% | 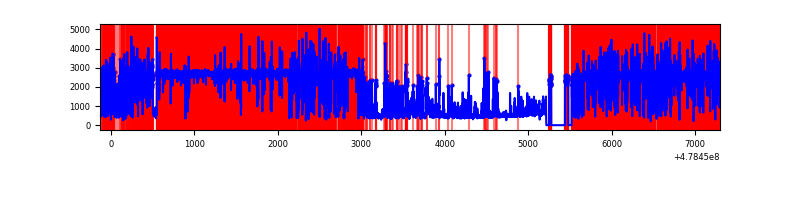 |
| C | 7432 | 7195 | 206 | 206 | 2.77% | 2.86% | 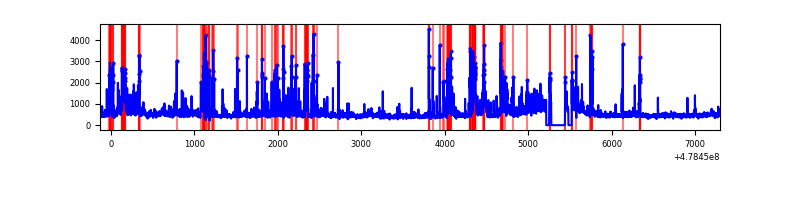 |
| D | 7432 | 7194 | 1209 | 1209 | 16.27% | 16.81% | 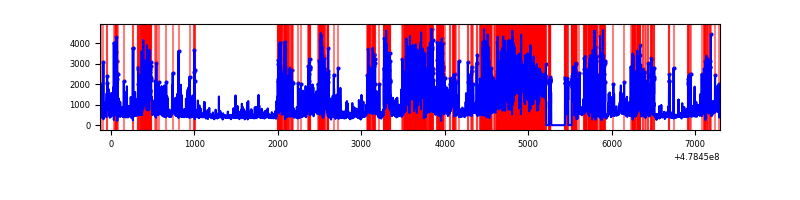 |
Top three noisy pixels from each quadrant. If the there are fewer than three noisy pixels in the level2.evt file, extra rows are filled as -1
| Pixel properties | Quadrant properties | ||||||
|---|---|---|---|---|---|---|---|
| Quadrant | DetID | PixID | Counts | Sigma | Mean | Median | Sigma |
| A | 8 | 43 | 2044484 | 11244.19 | 725 | 706 | 181.8 |
| A | 14 | 254 | 1285147 | 7066.57 | 725 | 706 | 181.8 |
| A | 4 | 3 | 185503 | 1016.69 | 725 | 706 | 181.8 |
| B | 5 | 236 | 10945604 | 117342.99 | 438 | 423 | 93.3 |
| B | 8 | 128 | 154535 | 1652.23 | 438 | 423 | 93.3 |
| B | 4 | 171 | 135919 | 1452.65 | 438 | 423 | 93.3 |
| C | 13 | 3 | 378921 | 1868.06 | 735 | 726 | 202.5 |
| C | 0 | 193 | 346950 | 1710.14 | 735 | 726 | 202.5 |
| C | 3 | 233 | 142413 | 699.85 | 735 | 726 | 202.5 |
| D | 8 | 176 | 3249297 | 17662.84 | 659 | 636 | 183.9 |
| D | 2 | 249 | 678379 | 3684.86 | 659 | 636 | 183.9 |
| D | 10 | 181 | 611322 | 3320.28 | 659 | 636 | 183.9 |
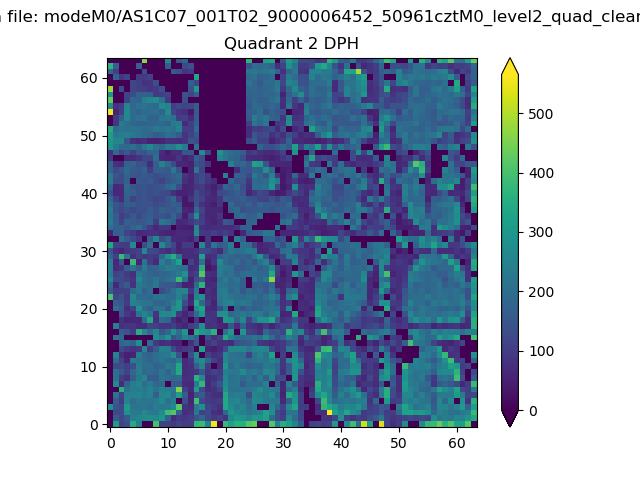
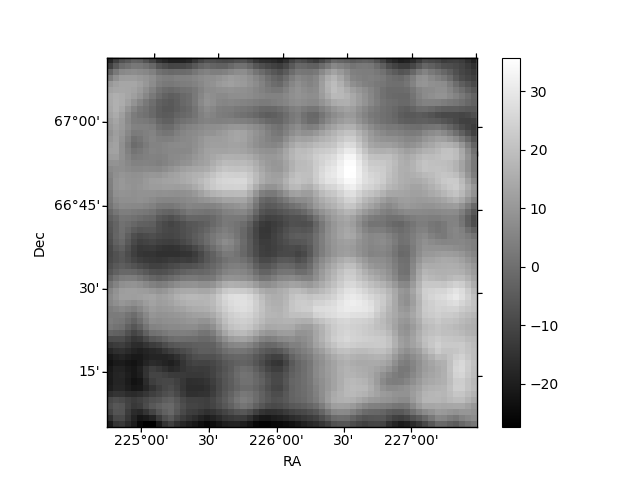
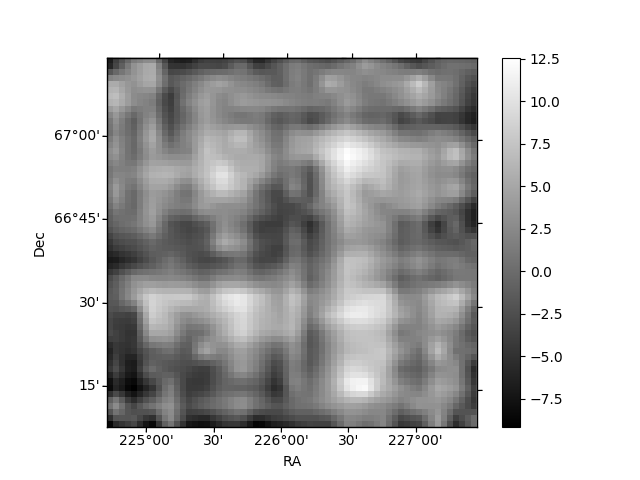
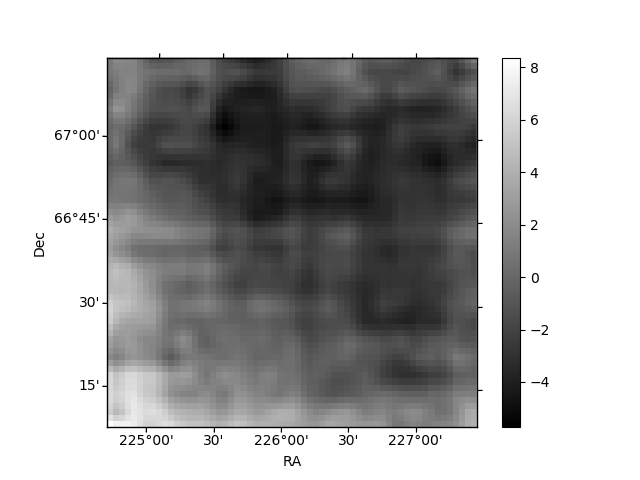
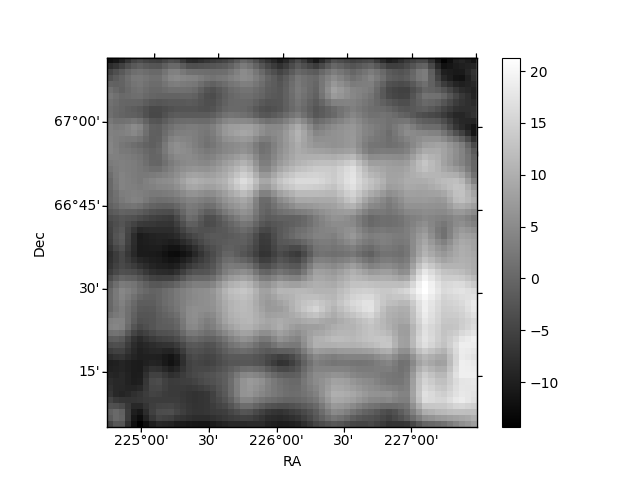
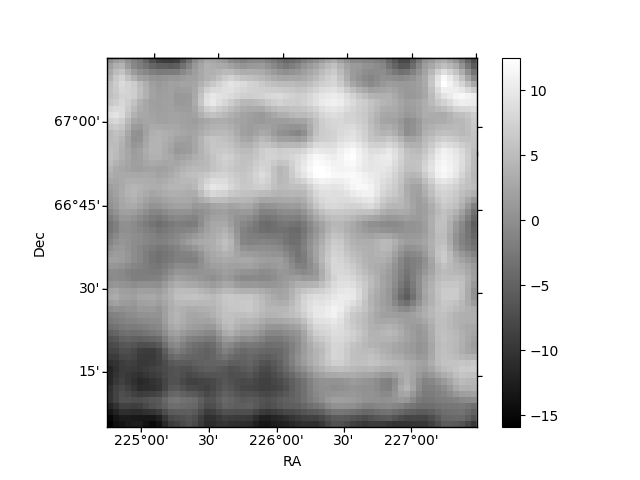
Histogram calculated using DETX and DETY for each event in the final _common_clean file
| Quadrant A | 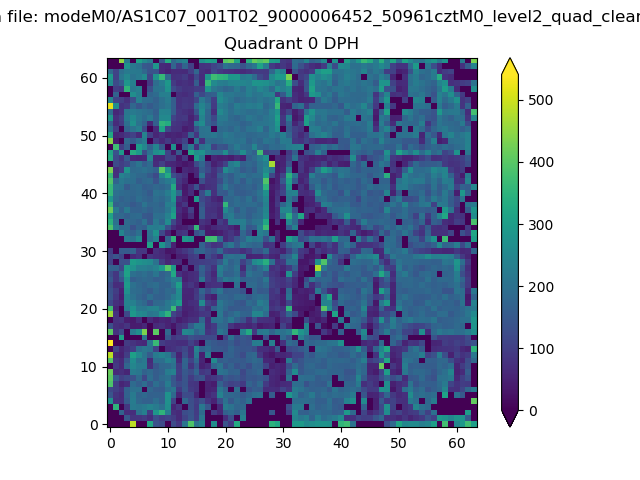 |
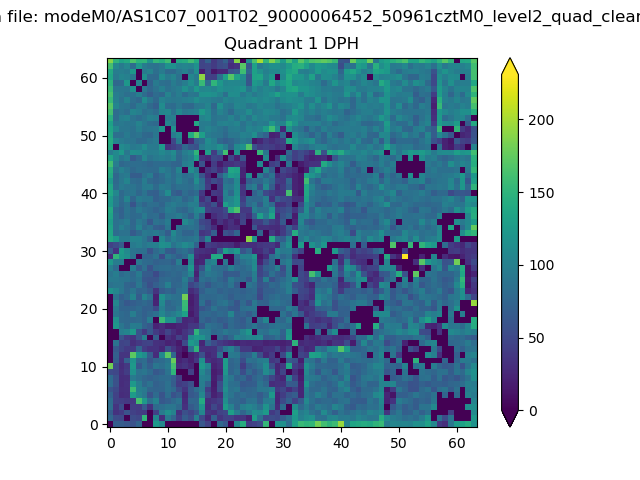 |
Quadrant B |
|---|---|---|---|
| Quadrant D | 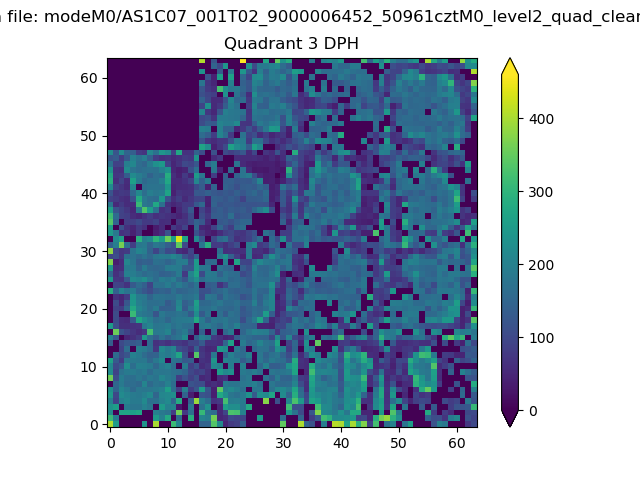 |
 |
Quadrant C |
| Plot type | Count rate plots | Images |
|---|---|---|
| Comparison with Poisson distribution Blue bars denote a histogram of data divided into 1 sec bins. Red curve is a Poisson curve with rate = median count rate of data. |
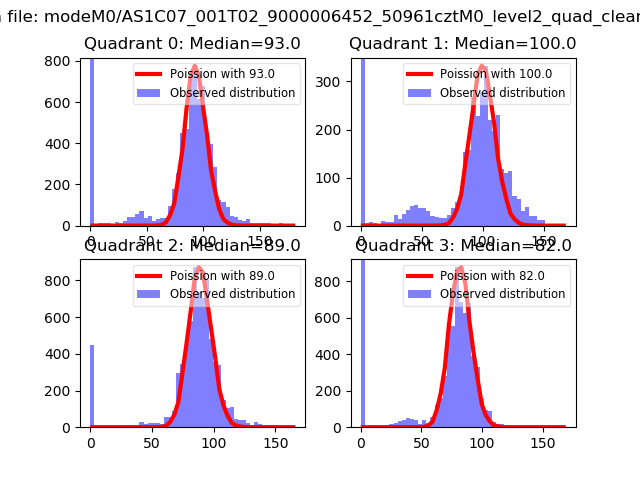 |
 |
| Quadrant-wise count rates Data is divided into 100 sec bins |
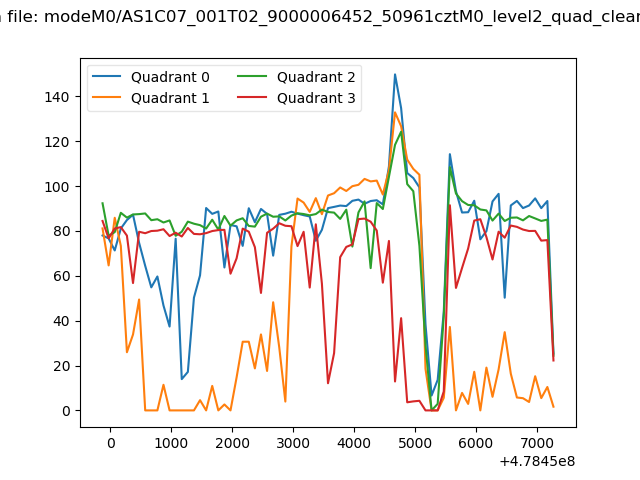 |
|
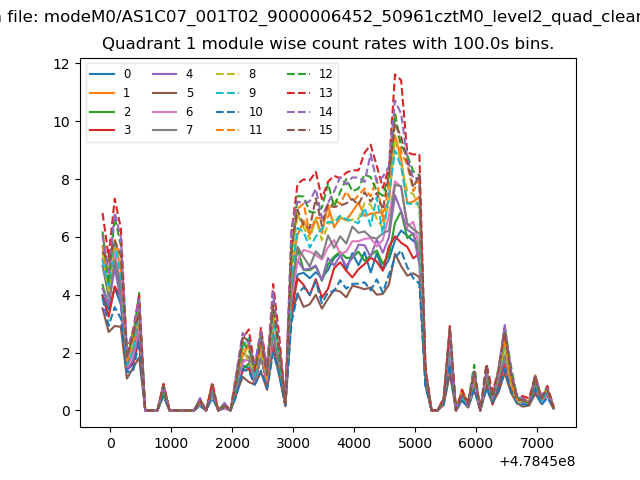
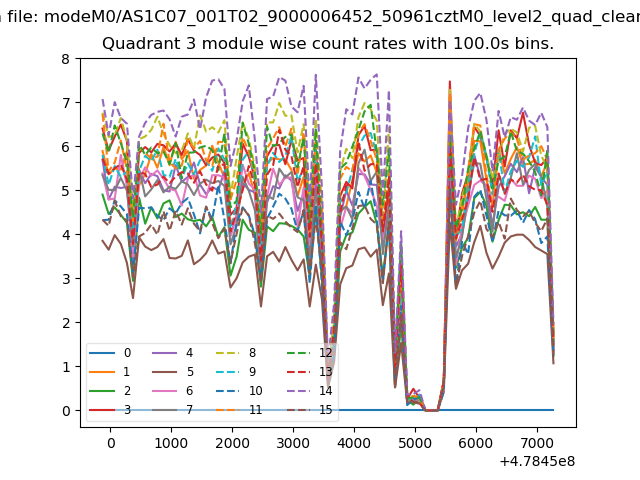
| Module-wise count rates for Quadrant A Data is divided into 100 sec bins |
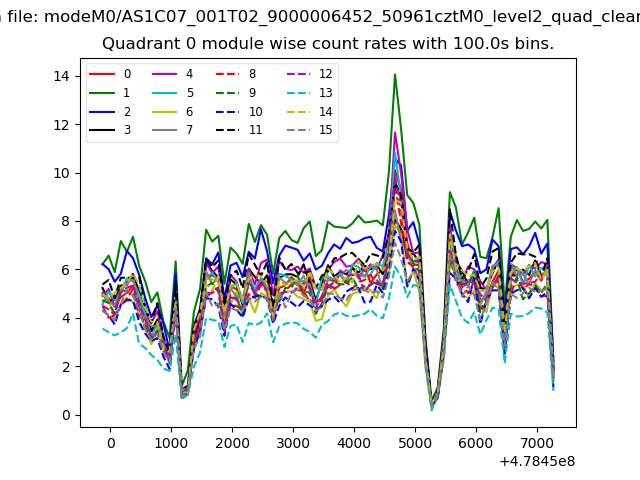 |
 |
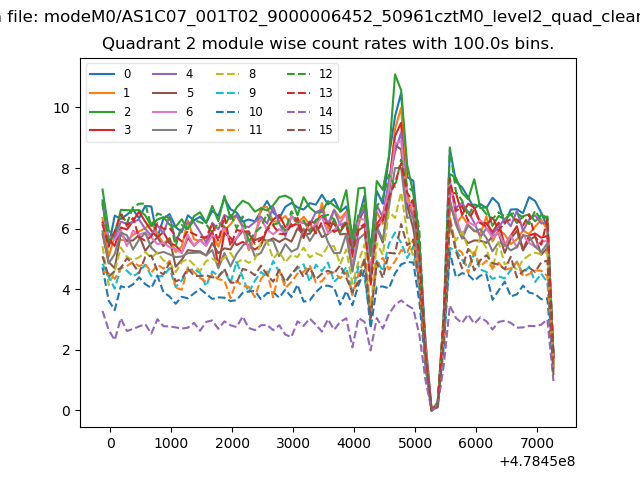
| Module-wise count rates for Quadrant B Data is divided into 100 sec bins |
 |
 |
| Module-wise count rates for Quadrant C Data is divided into 100 sec bins |
 |
 |
| Module-wise count rates for Quadrant D Data is divided into 100 sec bins |
 |
 |
| Parameter | Plot |
|---|---|
| CZT HV Monitor | 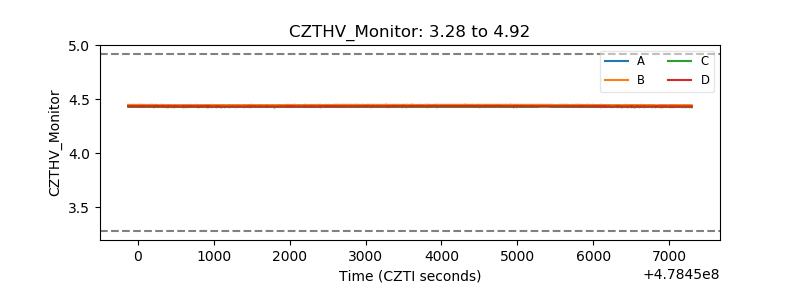 |
| D_VDD | 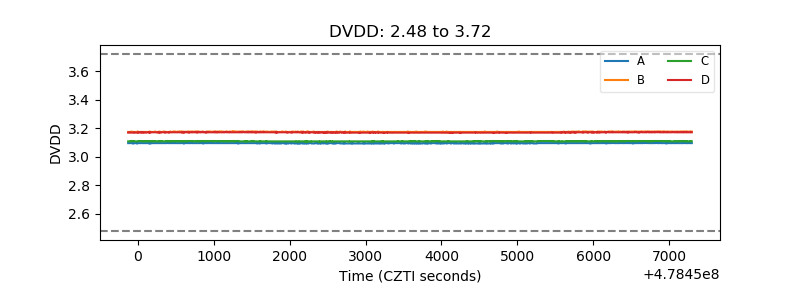 |
| Temperature 1 | 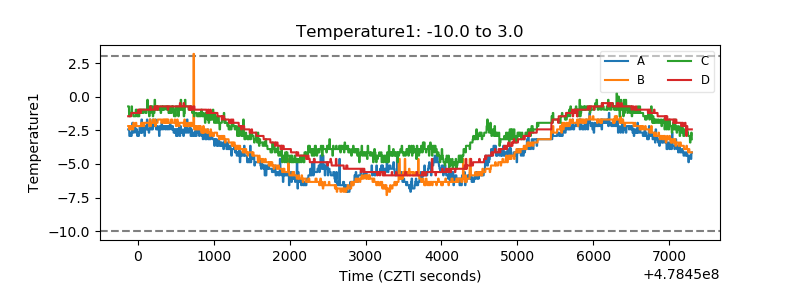 |
| Veto HV Monitor |  |
| Veto LLD | 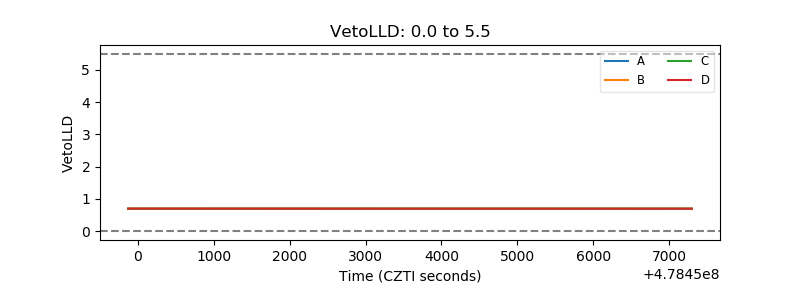 |
| Alpha Counter | 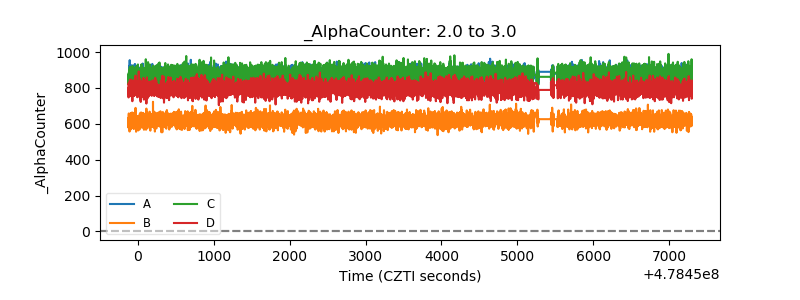 |
| _CPM_Rate | 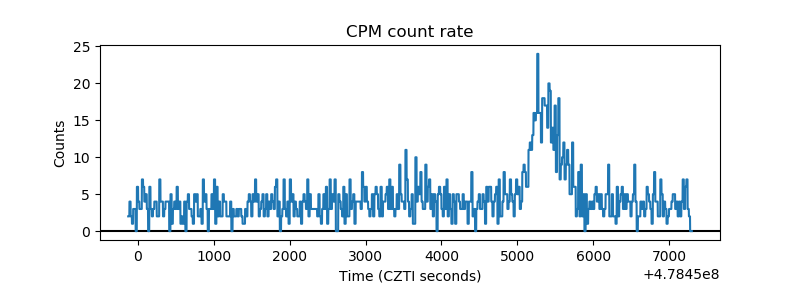 |
| CZT Counter | 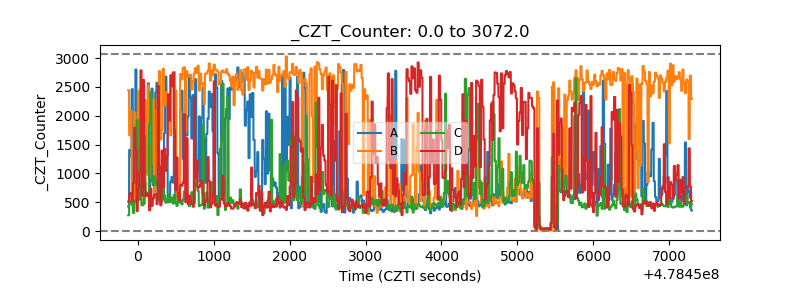 |
| +2.5 Volts monitor | 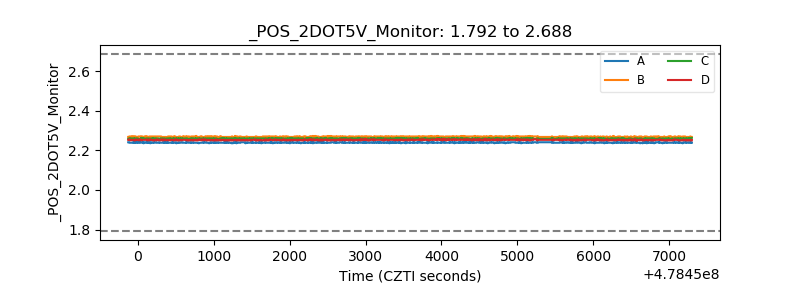 |
| +5 Volts monitor | 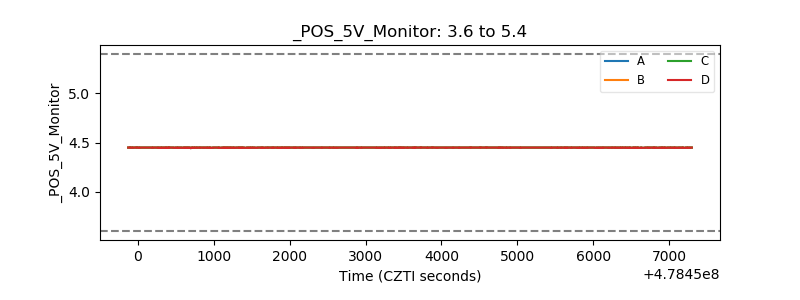 |
| _ROLL_ROT | 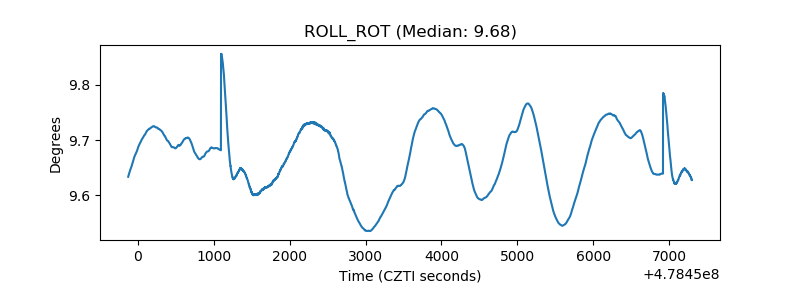 |
| _Roll_DEC | 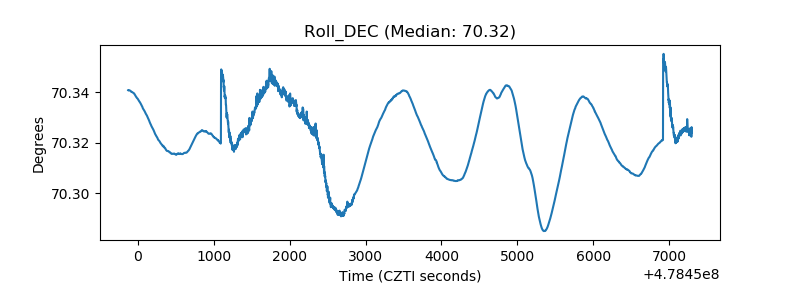 |
| _Roll_RA | 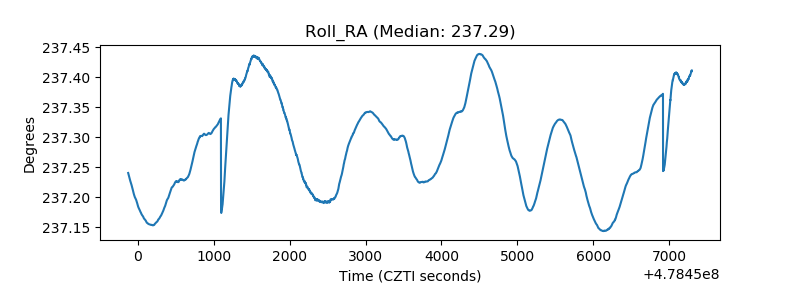 |
| Veto Counter | 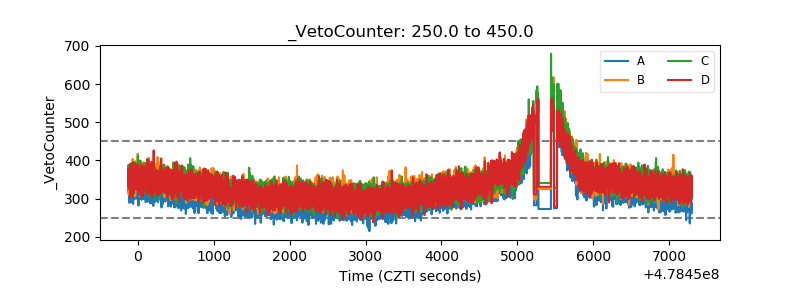 |