| Param | Original file | Final file |
|---|---|---|
| Filename | modeM0/AS1C07_001T02_9000006452_50962cztM0_level2.fits | modeM0/AS1C07_001T02_9000006452_50962cztM0_level2_quad_clean.evt |
| Size (bytes) | 1,067,109,120 | 81,835,200 |
| Size | 1017.7 MB | 78.0 MB |
| Events in quadrant A | 6,448,597 | 630,784 |
| Events in quadrant B | 16,642,083 | 227,751 |
| Events in quadrant C | 5,389,890 | 635,849 |
| Events in quadrant D | 10,436,183 | 457,336 |
| Mode SS | |||
|---|---|---|---|
| Quadrant | BADHDUFLAG | Total packets | Discarded packets |
| A | 0 | 150 | 0 |
| B | 0 | 150 | 0 |
| C | 0 | 150 | 0 |
| D | 0 | 150 | 0 |
| Mode M0 | |||
|---|---|---|---|
| Quadrant | BADHDUFLAG | Total packets | Discarded packets |
| A | 0 | 24427 | 0 |
| B | 0 | 54684 | 5 |
| C | 0 | 21130 | 0 |
| D | 0 | 36198 | 0 |
| Quadrant | Total seconds | Saturated seconds | Saturation percentage |
|---|---|---|---|
| A | 7559 | 898 | 11.879878% |
| B | 7558 | 5784 | 76.528182% |
| C | 7558 | 447 | 5.914263% |
| D | 7558 | 2225 | 29.439005% |
Noise dominated data is calculated using 1-second bins in cleaned event files. If a bin has >2000 counts, and if more than 50% of those come from <1% of pixels, then it is considered to be noise-dominated and hence unusable.
| Quadrant | # 1 sec bins | Bins with >0 counts | Bins with >2000 counts | High rate bins dominated by noise | Noise dominated (total time) | Noise dominated (detector-on time) | Marked lightcurve |
|---|---|---|---|---|---|---|---|
| A | 7559 | 7559 | 674 | 674 | 8.92% | 8.92% | 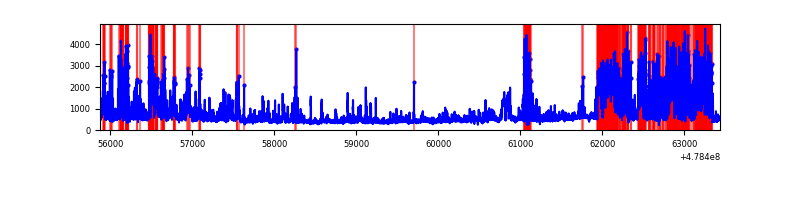 |
| B | 7558 | 7558 | 4825 | 4825 | 63.84% | 63.84% | 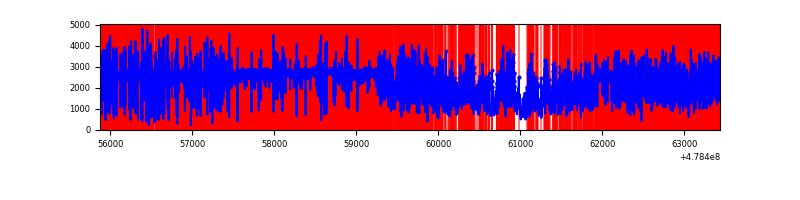 |
| C | 7558 | 7558 | 292 | 292 | 3.86% | 3.86% | 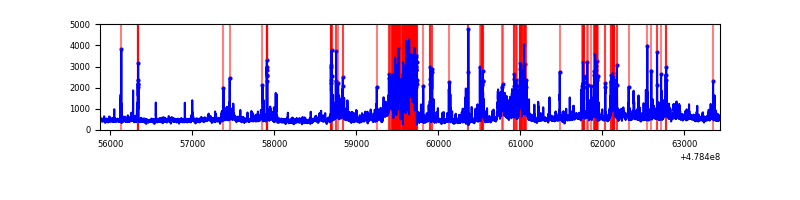 |
| D | 7558 | 7558 | 2031 | 2031 | 26.87% | 26.87% | 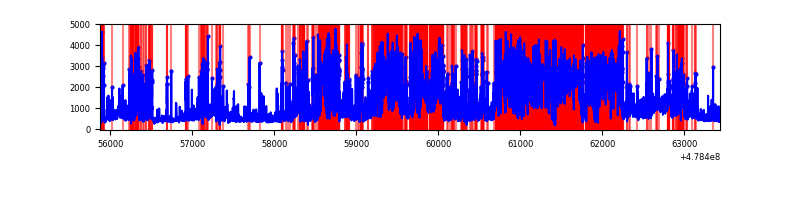 |
Top three noisy pixels from each quadrant. If the there are fewer than three noisy pixels in the level2.evt file, extra rows are filled as -1
| Pixel properties | Quadrant properties | ||||||
|---|---|---|---|---|---|---|---|
| Quadrant | DetID | PixID | Counts | Sigma | Mean | Median | Sigma |
| A | 8 | 43 | 1911779 | 10290.31 | 755 | 738 | 185.7 |
| A | 14 | 254 | 403118 | 2166.68 | 755 | 738 | 185.7 |
| A | 4 | 3 | 214502 | 1151.05 | 755 | 738 | 185.7 |
| B | 5 | 236 | 13948002 | 139129.62 | 460 | 444 | 100.2 |
| B | 4 | 171 | 416988 | 4155.11 | 460 | 444 | 100.2 |
| B | 10 | 28 | 89663 | 889.98 | 460 | 444 | 100.2 |
| C | 13 | 3 | 1384827 | 6653.07 | 754 | 745 | 208.0 |
| C | 12 | 247 | 281720 | 1350.6 | 754 | 745 | 208.0 |
| C | 13 | 49 | 181667 | 869.66 | 754 | 745 | 208.0 |
| D | 8 | 176 | 6590757 | 35583.52 | 653 | 630 | 185.2 |
| D | 0 | 33 | 273724 | 1474.58 | 653 | 630 | 185.2 |
| D | 10 | 181 | 183588 | 987.89 | 653 | 630 | 185.2 |
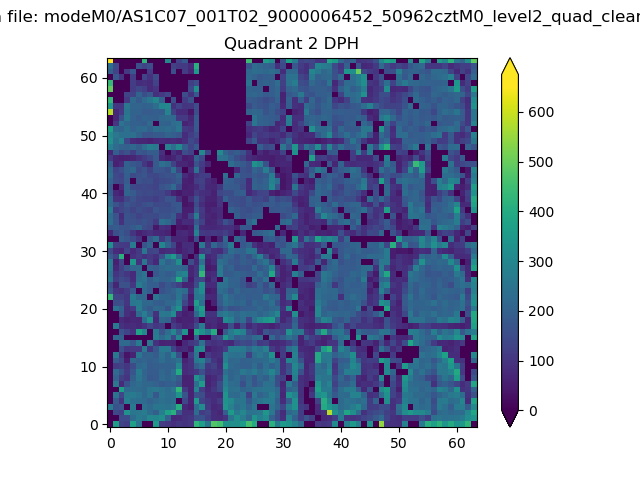
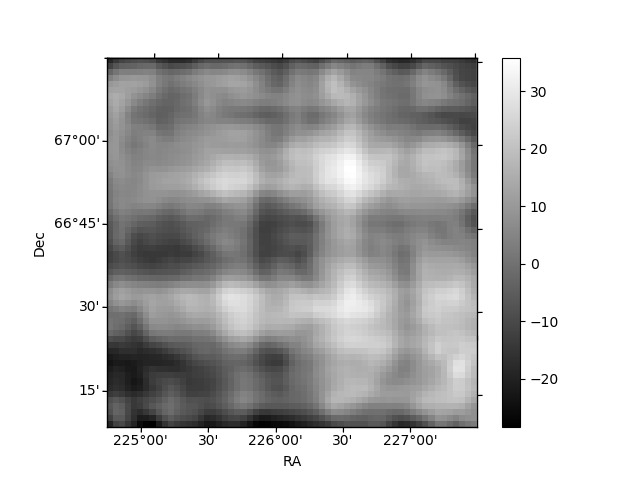
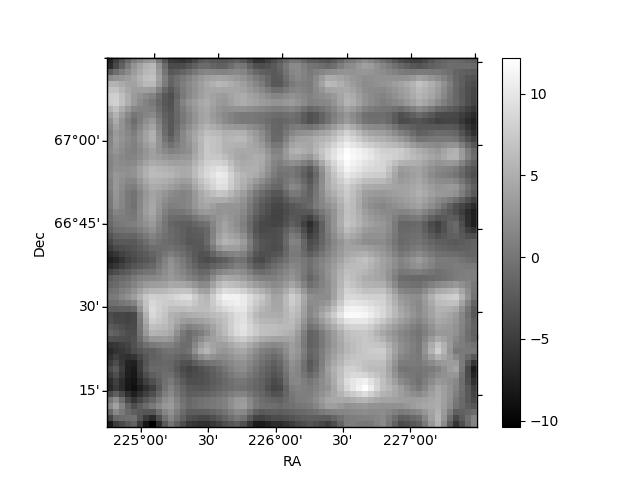
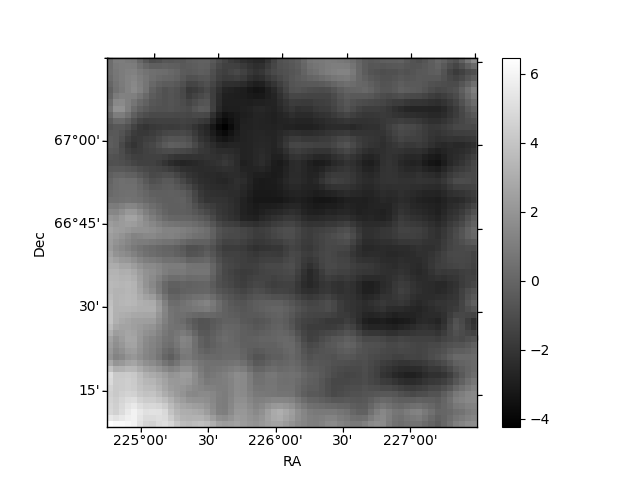
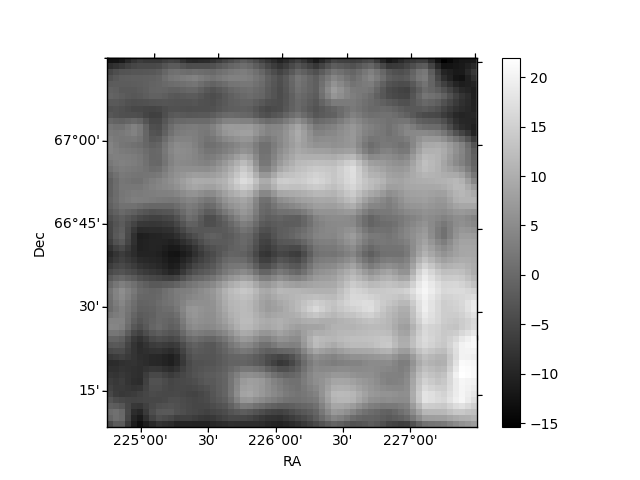
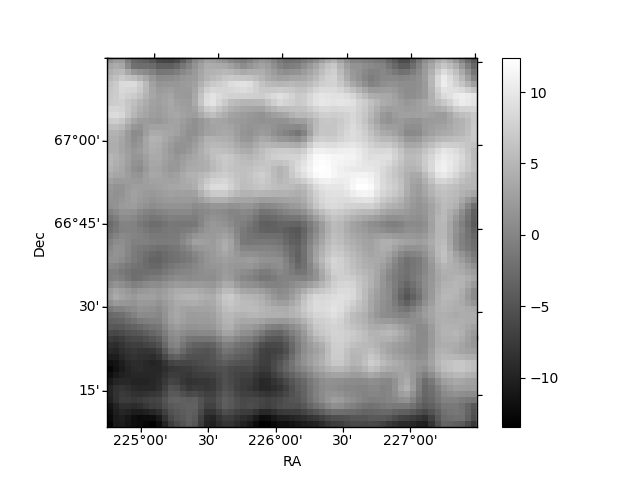
Histogram calculated using DETX and DETY for each event in the final _common_clean file
| Quadrant A | 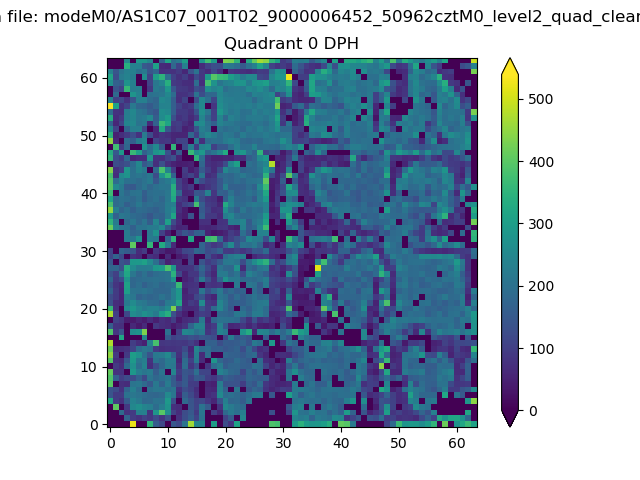 |
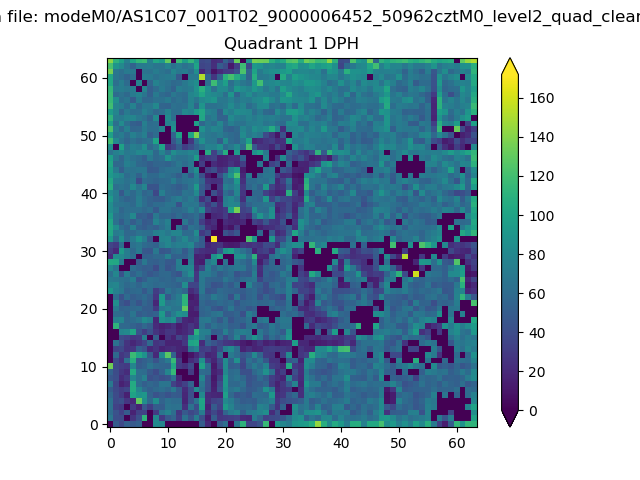 |
Quadrant B |
|---|---|---|---|
| Quadrant D | 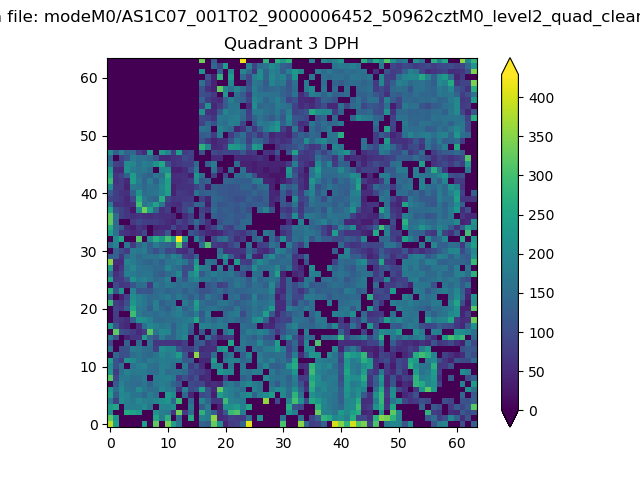 |
 |
Quadrant C |
| Plot type | Count rate plots | Images |
|---|---|---|
| Comparison with Poisson distribution Blue bars denote a histogram of data divided into 1 sec bins. Red curve is a Poisson curve with rate = median count rate of data. |
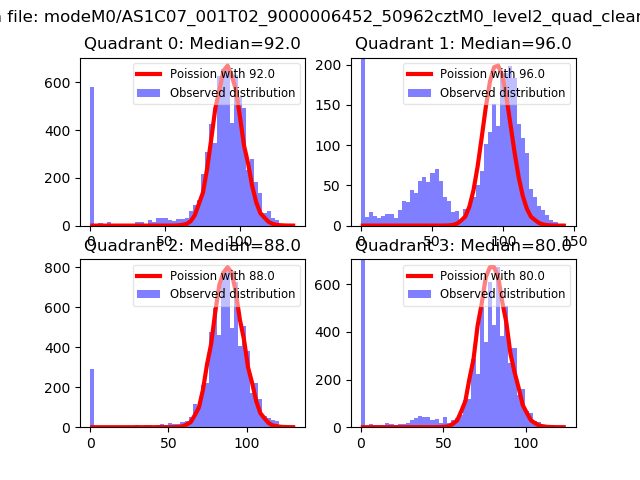 |
 |
| Quadrant-wise count rates Data is divided into 100 sec bins |
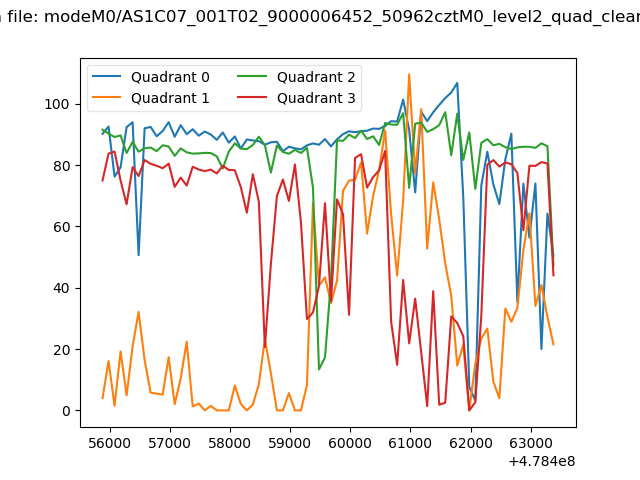 |
|
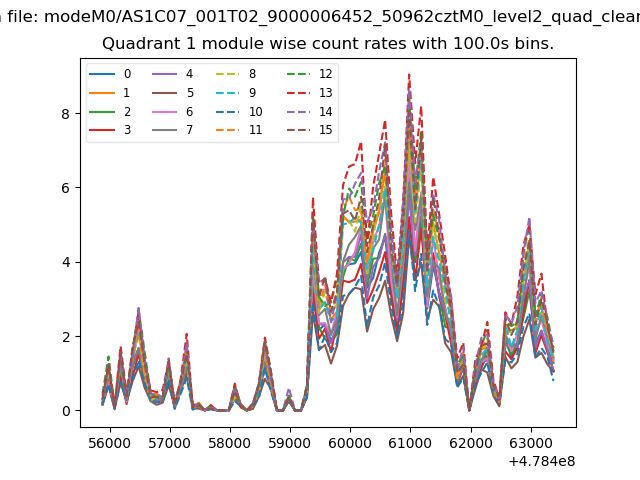
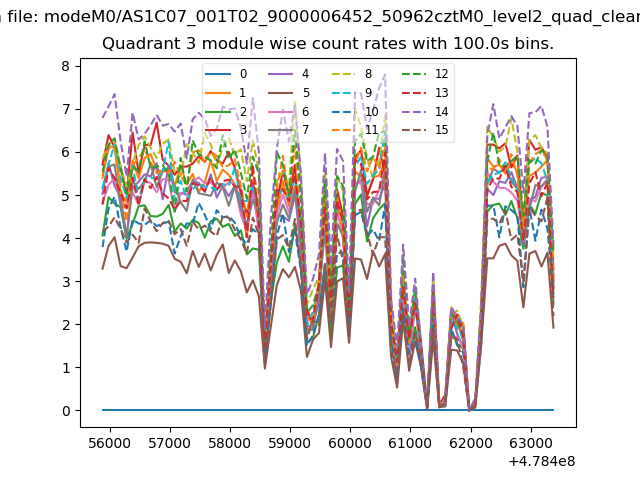
| Module-wise count rates for Quadrant A Data is divided into 100 sec bins |
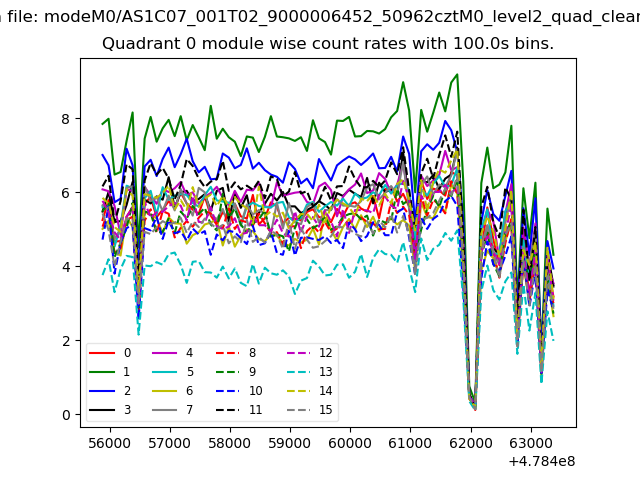 |
 |
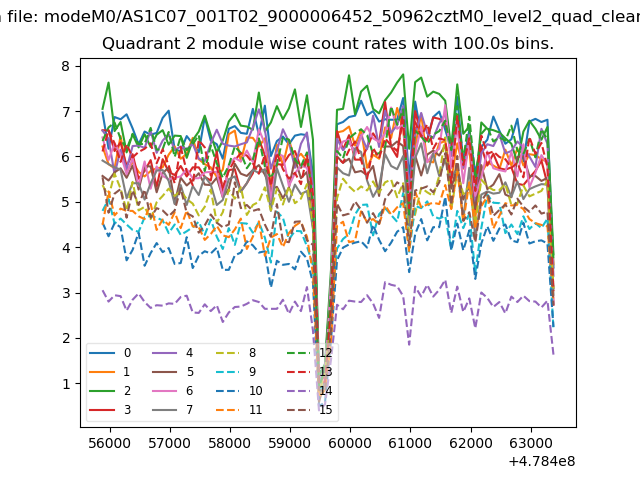
| Module-wise count rates for Quadrant B Data is divided into 100 sec bins |
 |
 |
| Module-wise count rates for Quadrant C Data is divided into 100 sec bins |
 |
 |
| Module-wise count rates for Quadrant D Data is divided into 100 sec bins |
 |
 |
| Parameter | Plot |
|---|---|
| CZT HV Monitor | 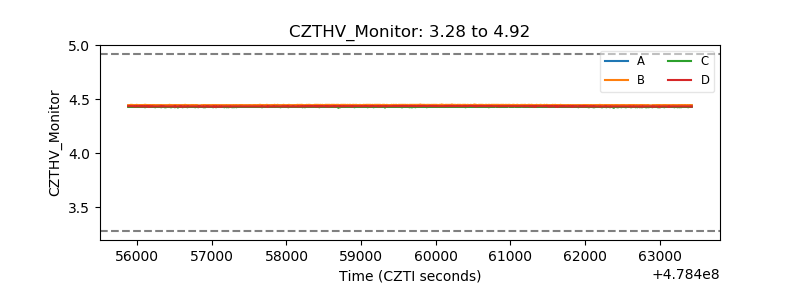 |
| D_VDD | 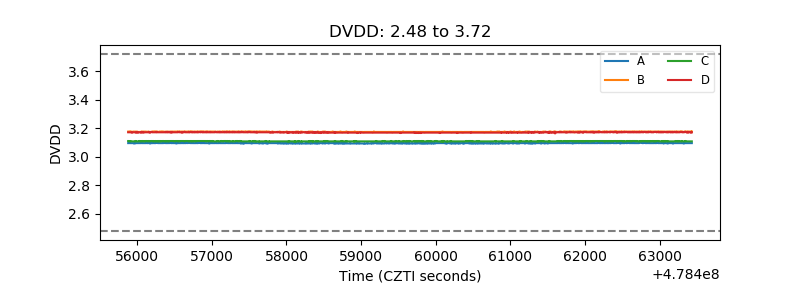 |
| Temperature 1 | 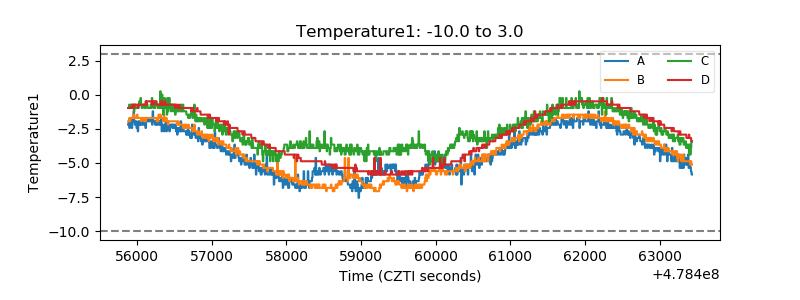 |
| Veto HV Monitor | 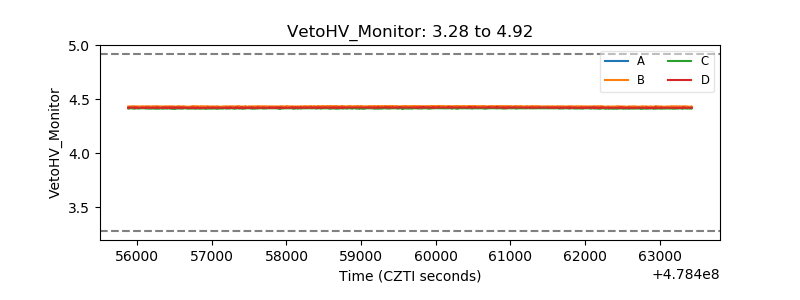 |
| Veto LLD | 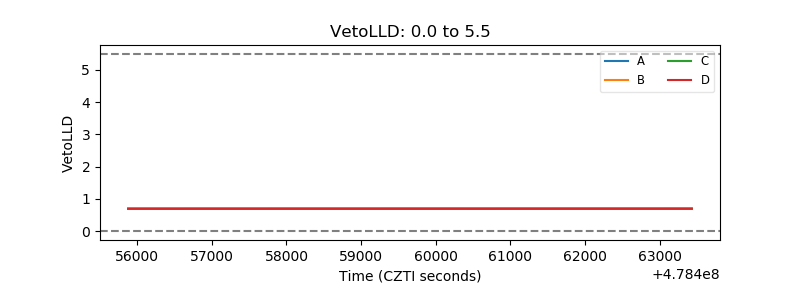 |
| Alpha Counter | 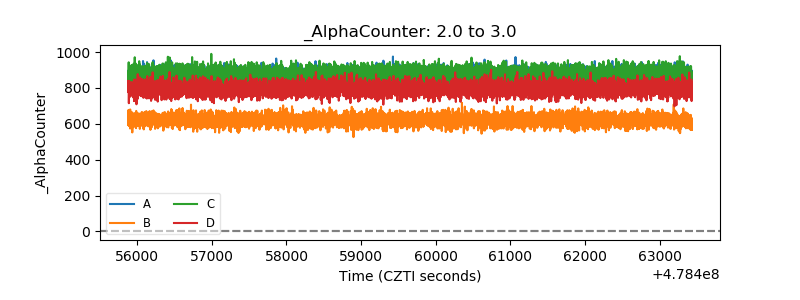 |
| _CPM_Rate | 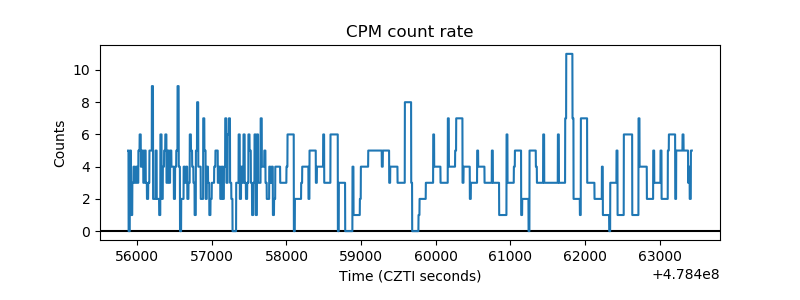 |
| CZT Counter | 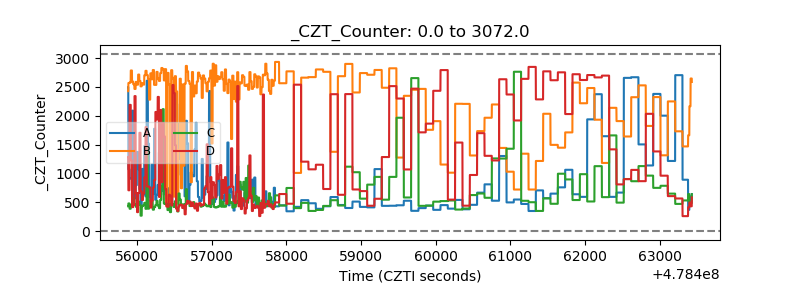 |
| +2.5 Volts monitor | 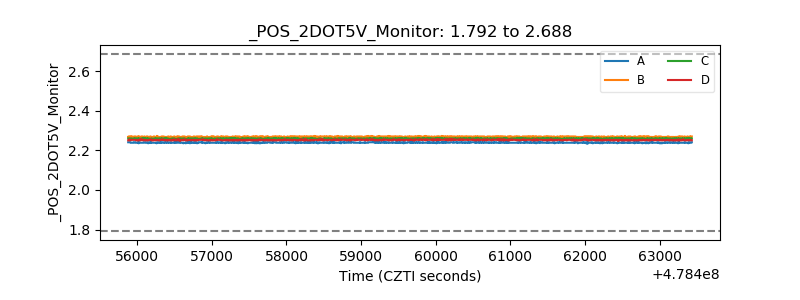 |
| +5 Volts monitor | 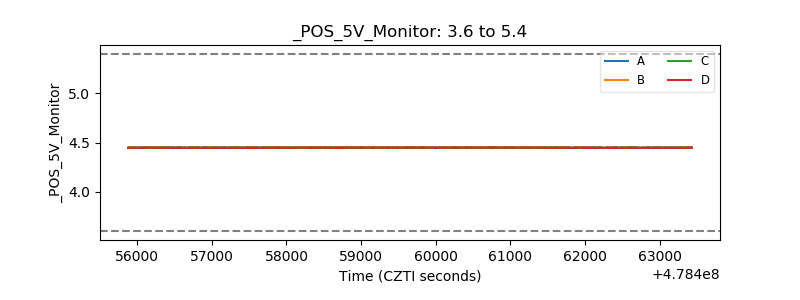 |
| _ROLL_ROT | 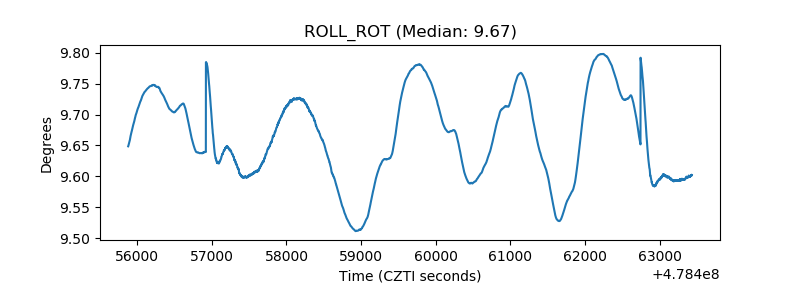 |
| _Roll_DEC | 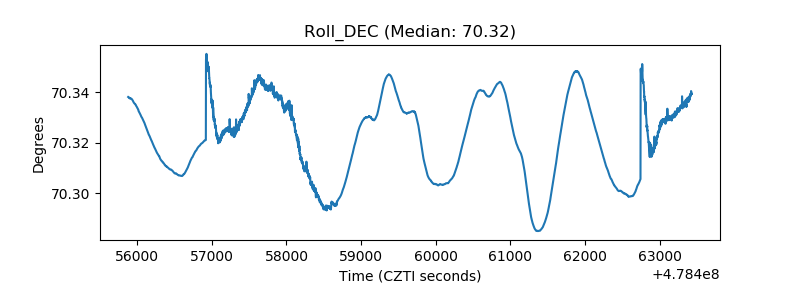 |
| _Roll_RA | 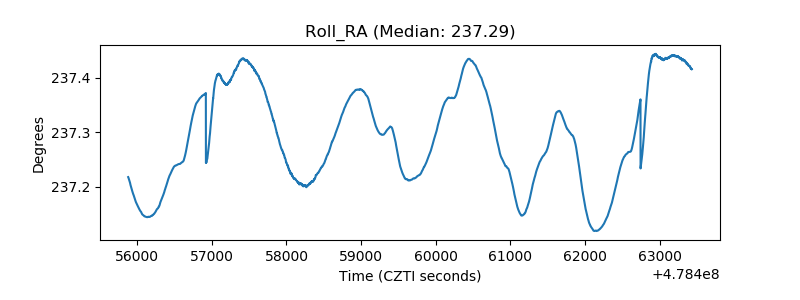 |
| Veto Counter | 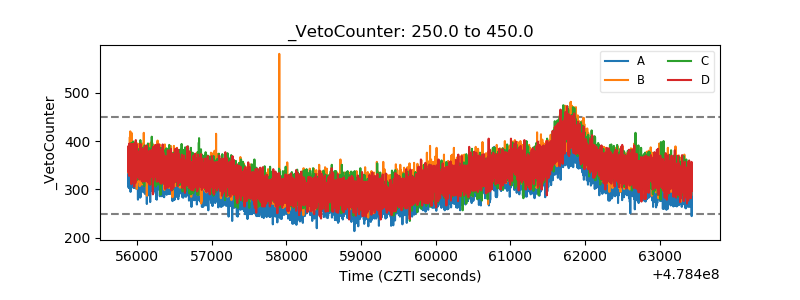 |