| Param | Original file | Final file |
|---|---|---|
| Filename | modeM0/AS1C07_001T02_9000006452_50963cztM0_level2.fits | modeM0/AS1C07_001T02_9000006452_50963cztM0_level2_quad_clean.evt |
| Size (bytes) | 992,554,560 | 89,009,280 |
| Size | 946.6 MB | 84.9 MB |
| Events in quadrant A | 7,993,792 | 554,224 |
| Events in quadrant B | 10,857,785 | 552,624 |
| Events in quadrant C | 6,181,606 | 624,198 |
| Events in quadrant D | 11,127,529 | 440,212 |
| Mode SS | |||
|---|---|---|---|
| Quadrant | BADHDUFLAG | Total packets | Discarded packets |
| A | 0 | 150 | 0 |
| B | 0 | 150 | 0 |
| C | 0 | 150 | 0 |
| D | 0 | 150 | 0 |
| Mode M0 | |||
|---|---|---|---|
| Quadrant | BADHDUFLAG | Total packets | Discarded packets |
| A | 0 | 28992 | 0 |
| B | 0 | 37467 | 0 |
| C | 0 | 23509 | 3 |
| D | 0 | 38190 | 0 |
| Quadrant | Total seconds | Saturated seconds | Saturation percentage |
|---|---|---|---|
| A | 7520 | 1704 | 22.659574% |
| B | 7520 | 2445 | 32.513298% |
| C | 7519 | 591 | 7.860088% |
| D | 7519 | 2488 | 33.089507% |
Noise dominated data is calculated using 1-second bins in cleaned event files. If a bin has >2000 counts, and if more than 50% of those come from <1% of pixels, then it is considered to be noise-dominated and hence unusable.
| Quadrant | # 1 sec bins | Bins with >0 counts | Bins with >2000 counts | High rate bins dominated by noise | Noise dominated (total time) | Noise dominated (detector-on time) | Marked lightcurve |
|---|---|---|---|---|---|---|---|
| A | 7520 | 7520 | 1372 | 1372 | 18.24% | 18.24% | 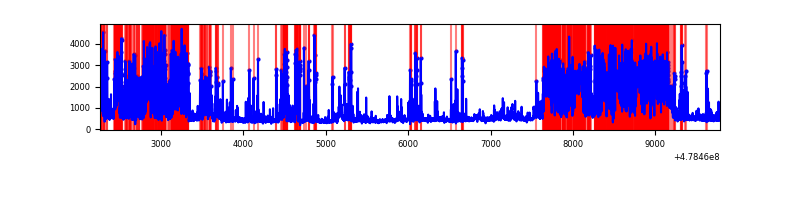 |
| B | 7520 | 7520 | 1920 | 1920 | 25.53% | 25.53% | 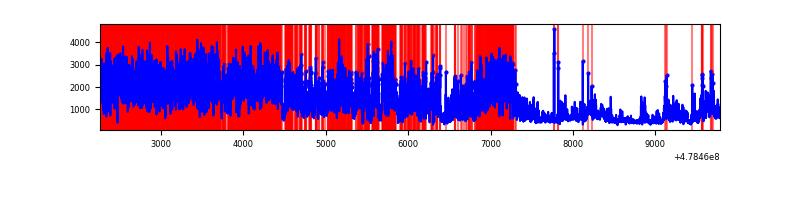 |
| C | 7519 | 7519 | 411 | 411 | 5.47% | 5.47% | 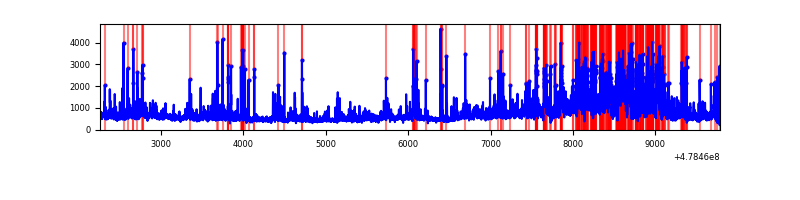 |
| D | 7519 | 7519 | 2313 | 2313 | 30.76% | 30.76% | 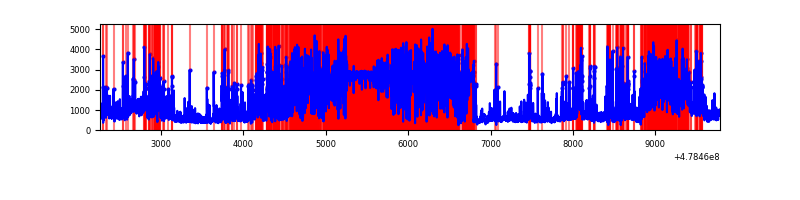 |
Top three noisy pixels from each quadrant. If the there are fewer than three noisy pixels in the level2.evt file, extra rows are filled as -1
| Pixel properties | Quadrant properties | ||||||
|---|---|---|---|---|---|---|---|
| Quadrant | DetID | PixID | Counts | Sigma | Mean | Median | Sigma |
| A | 8 | 43 | 3565278 | 20237.08 | 702 | 685 | 176.1 |
| A | 14 | 254 | 695385 | 3943.98 | 702 | 685 | 176.1 |
| A | 4 | 3 | 239185 | 1354.02 | 702 | 685 | 176.1 |
| B | 5 | 236 | 6883967 | 45408.76 | 711 | 686 | 151.6 |
| B | 4 | 171 | 469517 | 3092.86 | 711 | 686 | 151.6 |
| B | 4 | 206 | 170104 | 1117.64 | 711 | 686 | 151.6 |
| C | 12 | 247 | 528572 | 2509.06 | 747 | 741 | 210.4 |
| C | 13 | 49 | 517038 | 2454.23 | 747 | 741 | 210.4 |
| C | 15 | 198 | 286962 | 1360.56 | 747 | 741 | 210.4 |
| D | 8 | 176 | 5587137 | 30481.4 | 649 | 625 | 183.3 |
| D | 15 | 184 | 1253802 | 6837.65 | 649 | 625 | 183.3 |
| D | 3 | 12 | 480046 | 2615.84 | 649 | 625 | 183.3 |
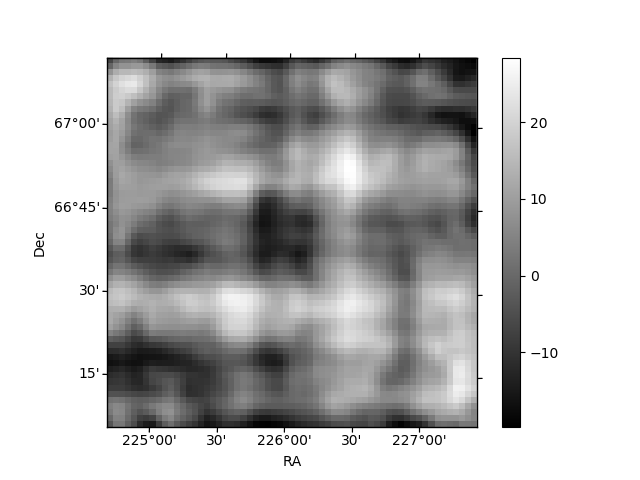
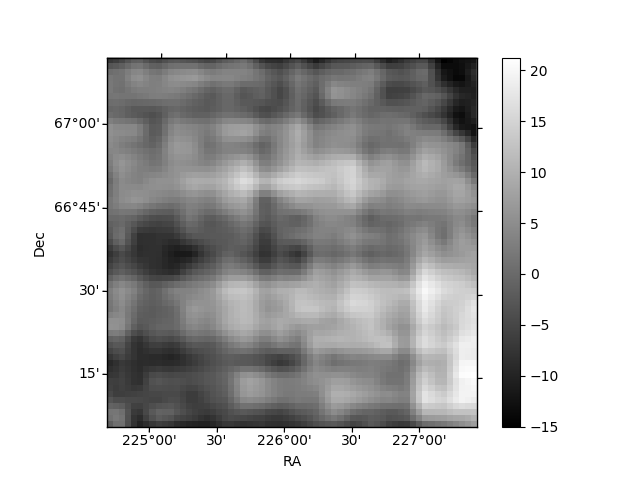
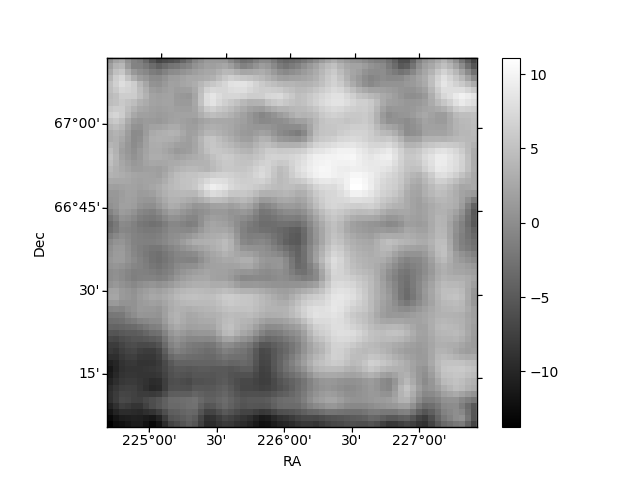
Histogram calculated using DETX and DETY for each event in the final _common_clean file
| Quadrant A | 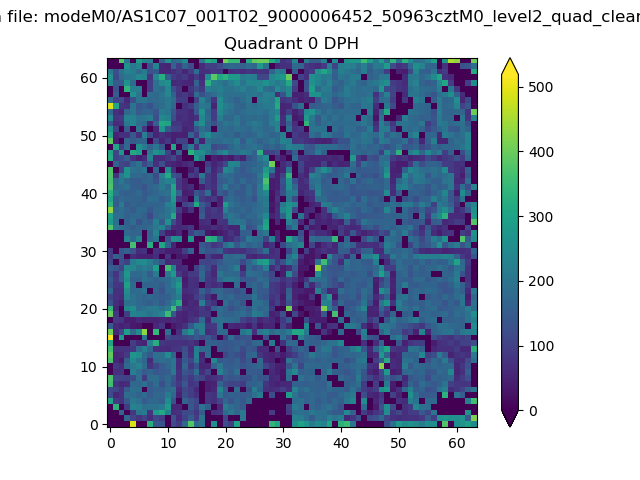 |
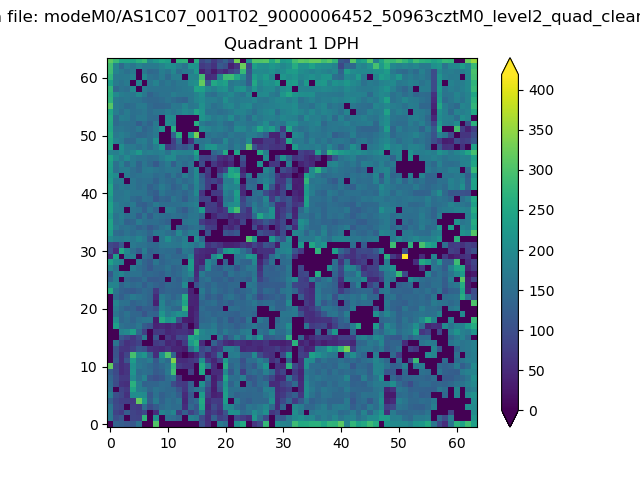 |
Quadrant B |
|---|---|---|---|
| Quadrant D | 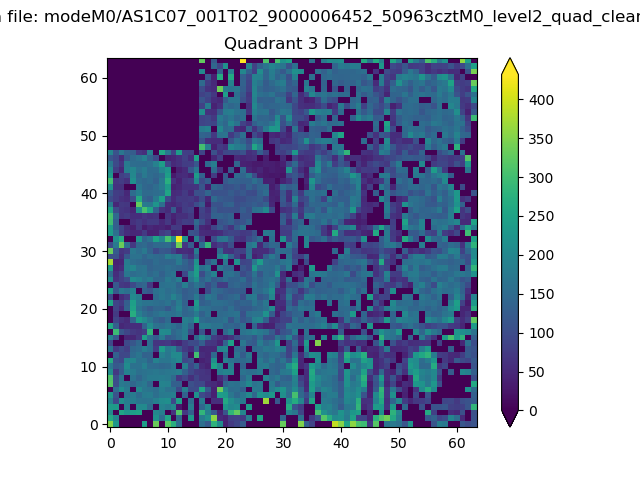 |
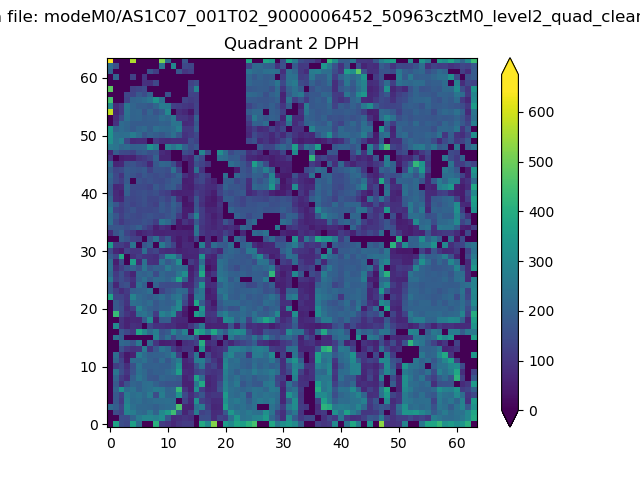 |
Quadrant C |
| Plot type | Count rate plots | Images |
|---|---|---|
| Comparison with Poisson distribution Blue bars denote a histogram of data divided into 1 sec bins. Red curve is a Poisson curve with rate = median count rate of data. |
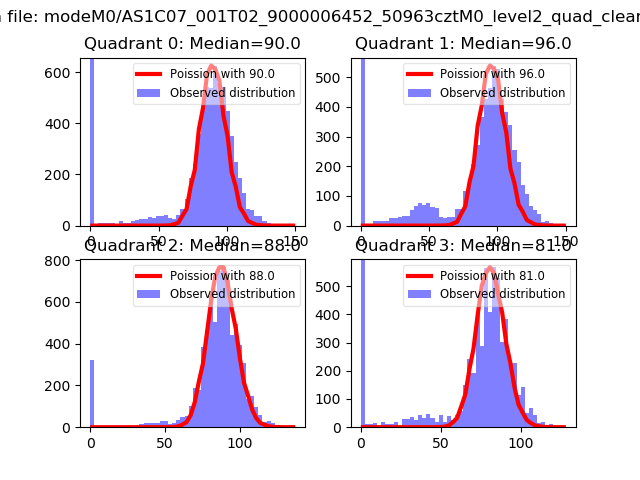 |
 |
| Quadrant-wise count rates Data is divided into 100 sec bins |
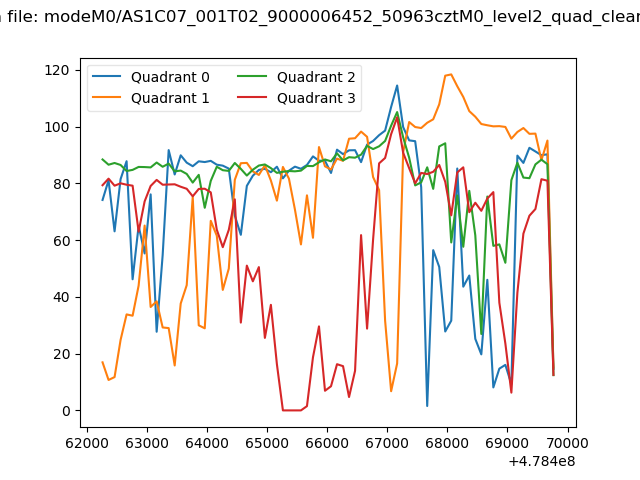 |
|
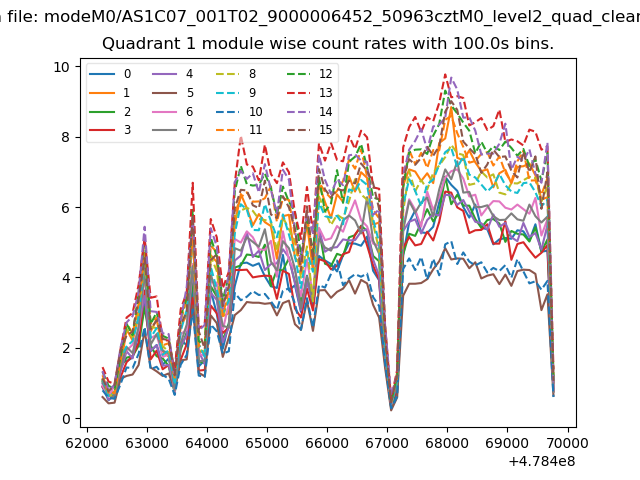
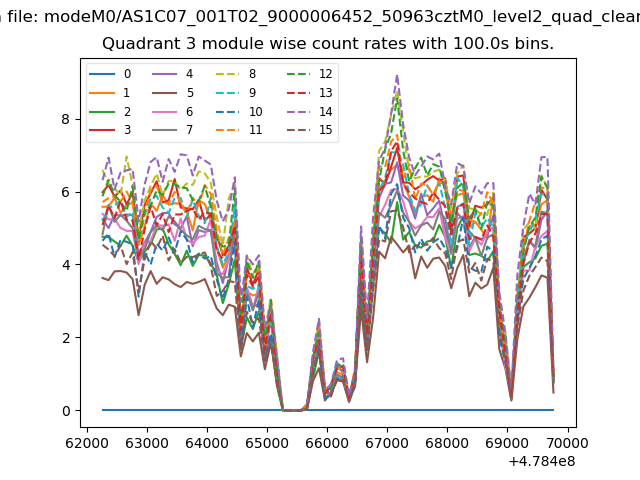
| Module-wise count rates for Quadrant A Data is divided into 100 sec bins |
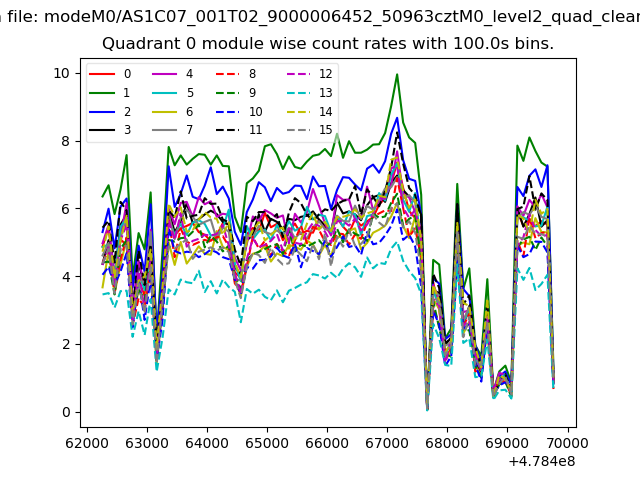 |
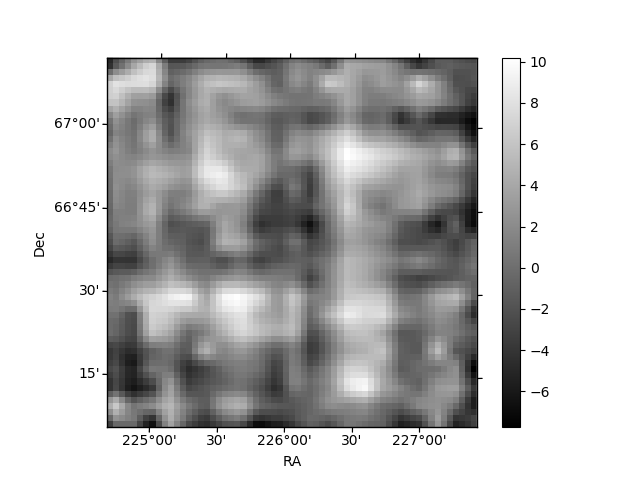 |
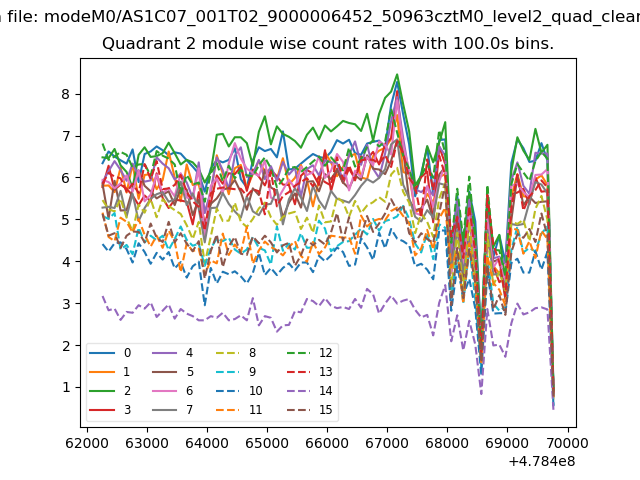
| Module-wise count rates for Quadrant B Data is divided into 100 sec bins |
 |
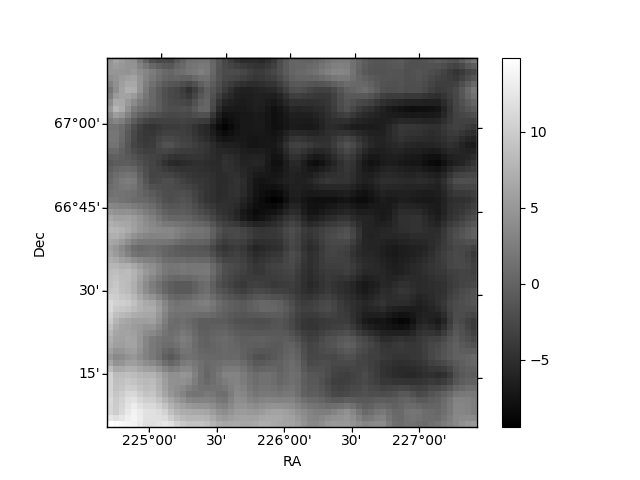 |
| Module-wise count rates for Quadrant C Data is divided into 100 sec bins |
 |
 |
| Module-wise count rates for Quadrant D Data is divided into 100 sec bins |
 |
 |
| Parameter | Plot |
|---|---|
| CZT HV Monitor | 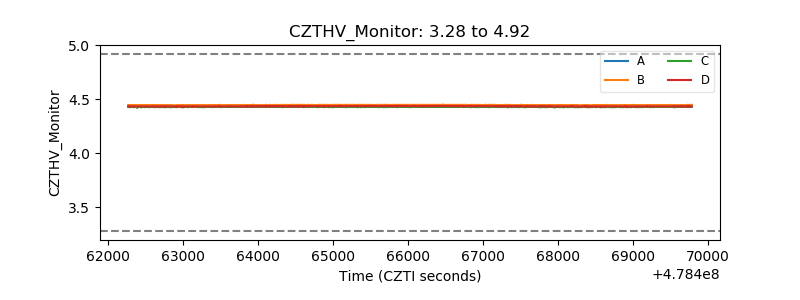 |
| D_VDD | 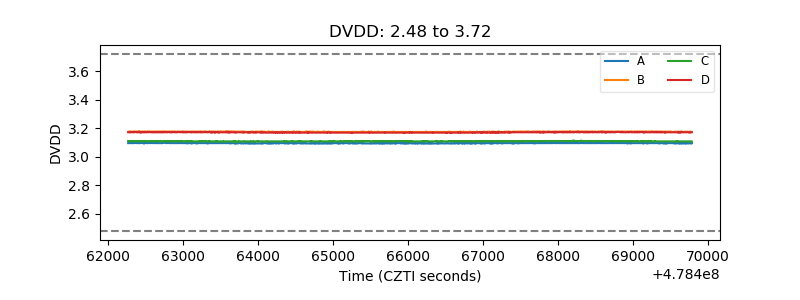 |
| Temperature 1 | 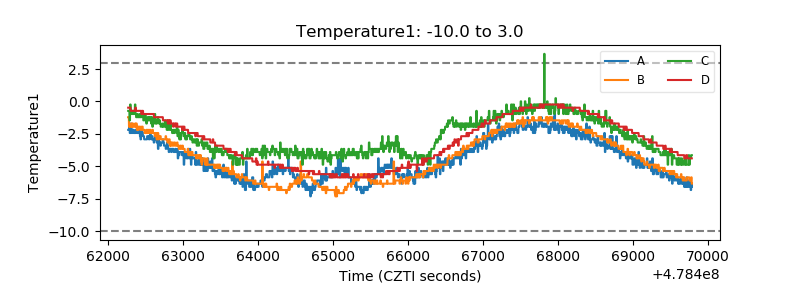 |
| Veto HV Monitor | 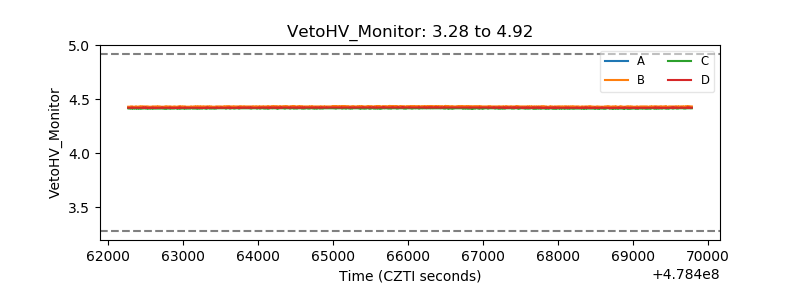 |
| Veto LLD | 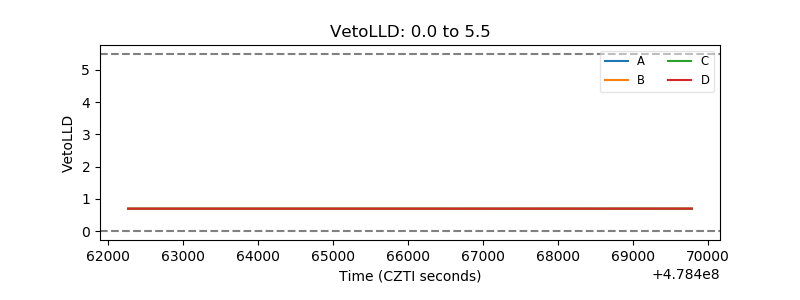 |
| Alpha Counter | 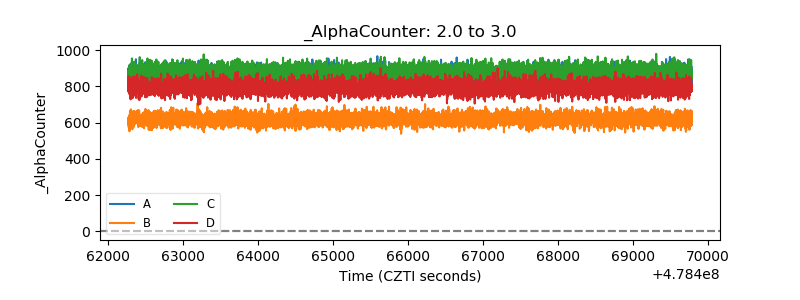 |
| _CPM_Rate | 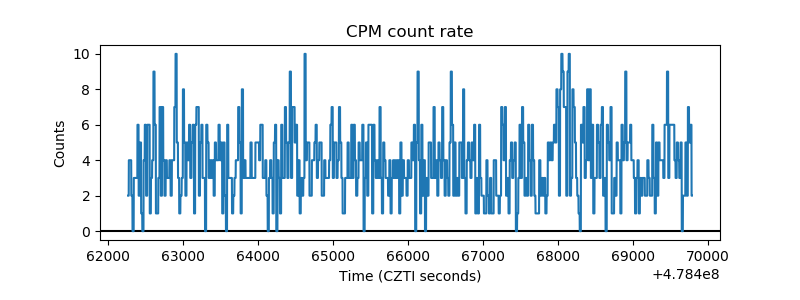 |
| CZT Counter | 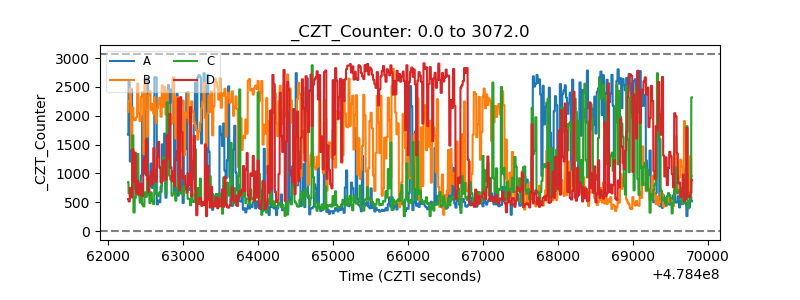 |
| +2.5 Volts monitor | 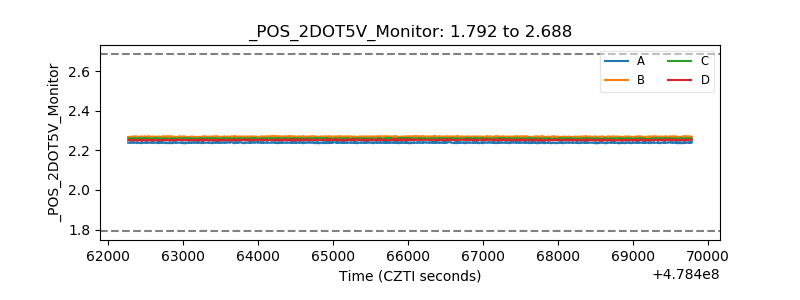 |
| +5 Volts monitor | 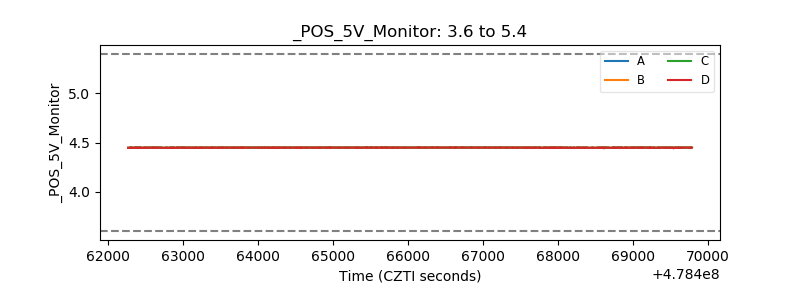 |
| _ROLL_ROT | 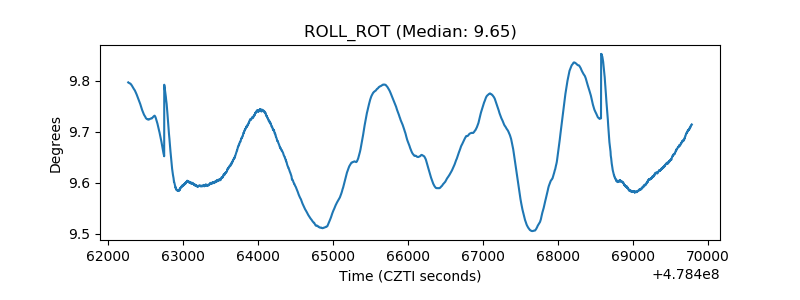 |
| _Roll_DEC | 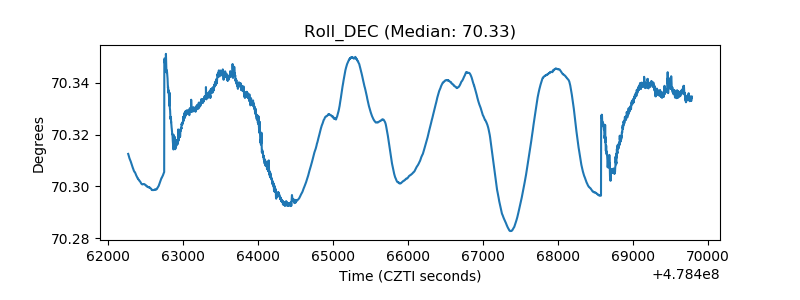 |
| _Roll_RA | 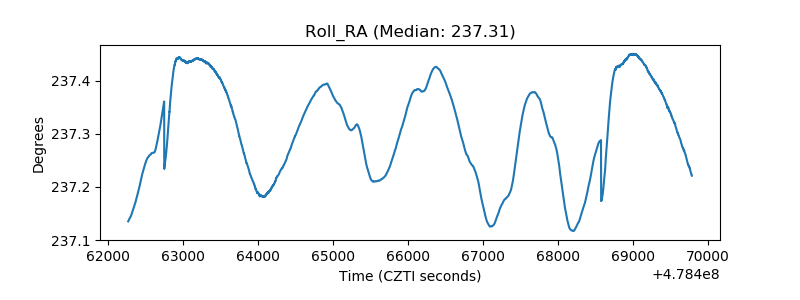 |
| Veto Counter | 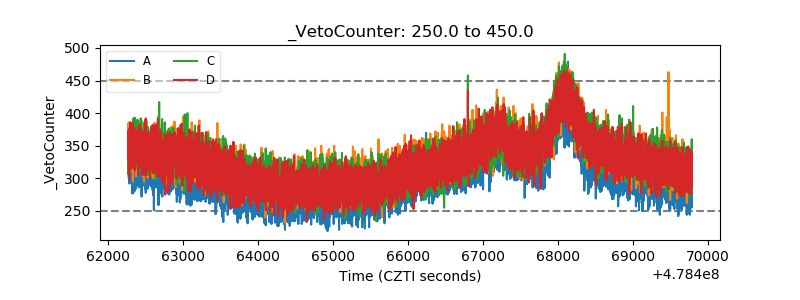 |