| Param | Original file | Final file |
|---|---|---|
| Filename | modeM0/AS1C07_001T02_9000006452_50966cztM0_level2.fits | modeM0/AS1C07_001T02_9000006452_50966cztM0_level2_quad_clean.evt |
| Size (bytes) | 2,105,524,800 | 156,660,480 |
| Size | 2.0 GB | 149.4 MB |
| Events in quadrant A | 17,021,426 | 1,022,866 |
| Events in quadrant B | 13,465,829 | 1,204,176 |
| Events in quadrant C | 21,343,484 | 813,130 |
| Events in quadrant D | 24,997,662 | 703,731 |
| Mode SS | |||
|---|---|---|---|
| Quadrant | BADHDUFLAG | Total packets | Discarded packets |
| A | 0 | 292 | 0 |
| B | 0 | 292 | 0 |
| C | 0 | 292 | 0 |
| D | 0 | 292 | 0 |
| Mode M9 | |||
|---|---|---|---|
| Quadrant | BADHDUFLAG | Total packets | Discarded packets |
| A | 0 | 4 | 0 |
| B | 0 | 4 | 0 |
| C | 0 | 4 | 0 |
| D | 0 | 4 | 0 |
| Mode M0 | |||
|---|---|---|---|
| Quadrant | BADHDUFLAG | Total packets | Discarded packets |
| A | 0 | 60606 | 4 |
| B | 0 | 50280 | 1 |
| C | 0 | 73445 | 1 |
| D | 0 | 84256 | 1 |
| Quadrant | Total seconds | Saturated seconds | Saturation percentage |
|---|---|---|---|
| A | 14450 | 3375 | 23.356401% |
| B | 14451 | 2543 | 17.597398% |
| C | 14451 | 5373 | 37.180818% |
| D | 14451 | 6243 | 43.201163% |
Noise dominated data is calculated using 1-second bins in cleaned event files. If a bin has >2000 counts, and if more than 50% of those come from <1% of pixels, then it is considered to be noise-dominated and hence unusable.
| Quadrant | # 1 sec bins | Bins with >0 counts | Bins with >2000 counts | High rate bins dominated by noise | Noise dominated (total time) | Noise dominated (detector-on time) | Marked lightcurve |
|---|---|---|---|---|---|---|---|
| A | 14845 | 14451 | 2791 | 2791 | 18.80% | 19.31% | 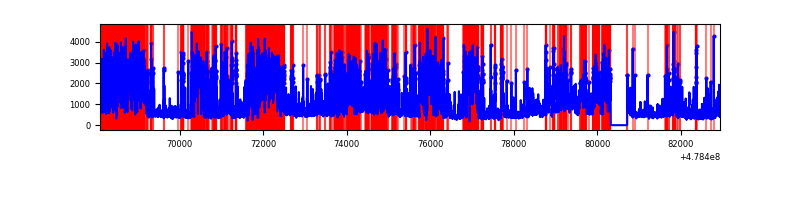 |
| B | 14846 | 14452 | 2224 | 2224 | 14.98% | 15.39% | 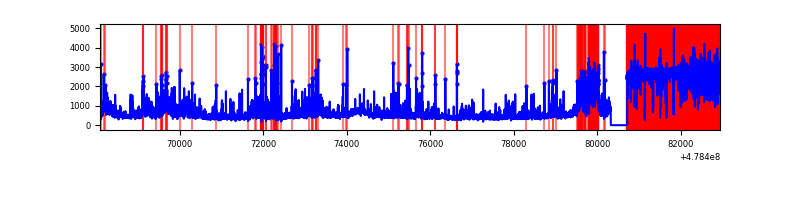 |
| C | 14846 | 14452 | 4752 | 4752 | 32.01% | 32.88% | 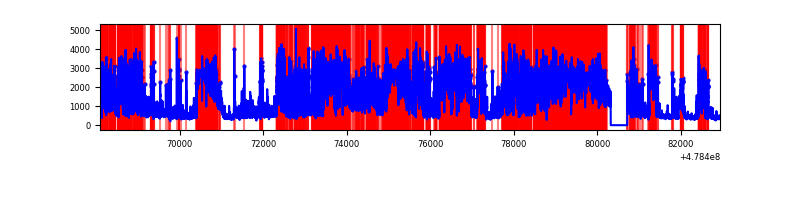 |
| D | 14846 | 14451 | 5763 | 5763 | 38.82% | 39.88% | 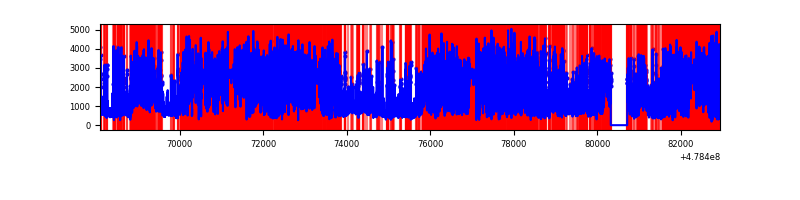 |
Top three noisy pixels from each quadrant. If the there are fewer than three noisy pixels in the level2.evt file, extra rows are filled as -1
| Pixel properties | Quadrant properties | ||||||
|---|---|---|---|---|---|---|---|
| Quadrant | DetID | PixID | Counts | Sigma | Mean | Median | Sigma |
| A | 8 | 43 | 6715833 | 19107.1 | 1376 | 1336 | 351.4 |
| A | 14 | 254 | 1260874 | 3584.2 | 1376 | 1336 | 351.4 |
| A | 12 | 80 | 940607 | 2672.83 | 1376 | 1336 | 351.4 |
| B | 5 | 236 | 5646549 | 19681.83 | 1354 | 1302 | 286.8 |
| B | 4 | 171 | 1094059 | 3809.83 | 1354 | 1302 | 286.8 |
| B | 8 | 128 | 336053 | 1167.09 | 1354 | 1302 | 286.8 |
| C | 15 | 147 | 9730811 | 27635.89 | 1226 | 1213 | 352.1 |
| C | 3 | 242 | 1814087 | 5149.28 | 1226 | 1213 | 352.1 |
| C | 13 | 49 | 680672 | 1929.93 | 1226 | 1213 | 352.1 |
| D | 8 | 176 | 14308033 | 40699.49 | 1181 | 1134 | 351.5 |
| D | 15 | 184 | 1483211 | 4216.13 | 1181 | 1134 | 351.5 |
| D | 3 | 12 | 1072661 | 3048.22 | 1181 | 1134 | 351.5 |
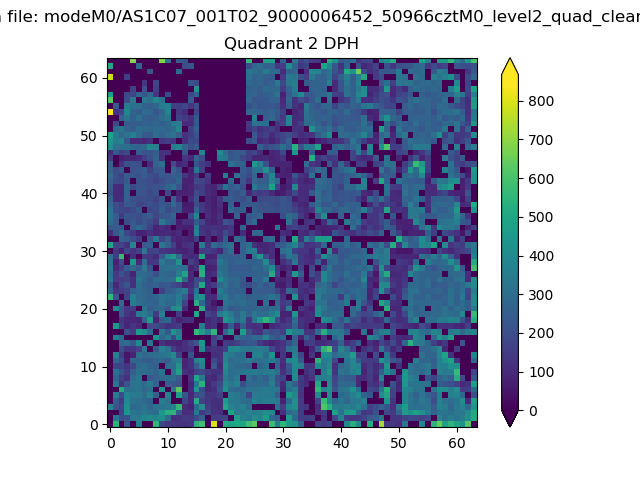
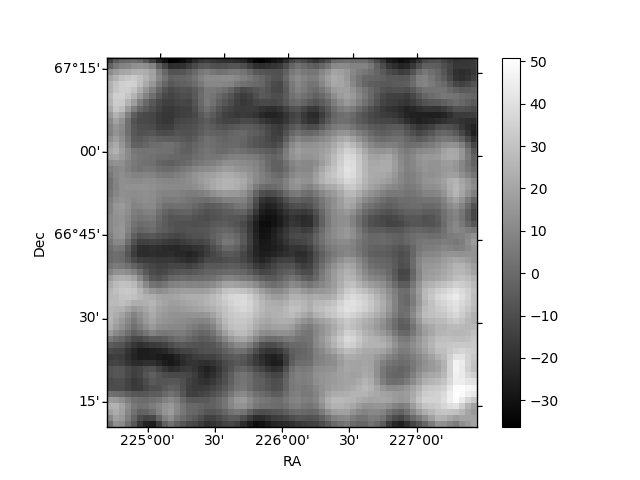
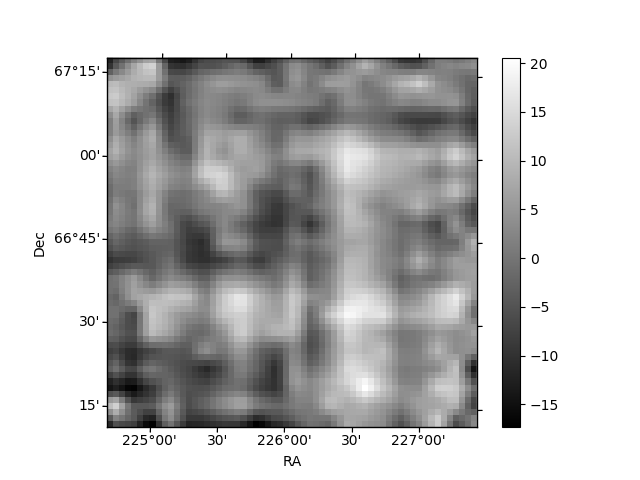
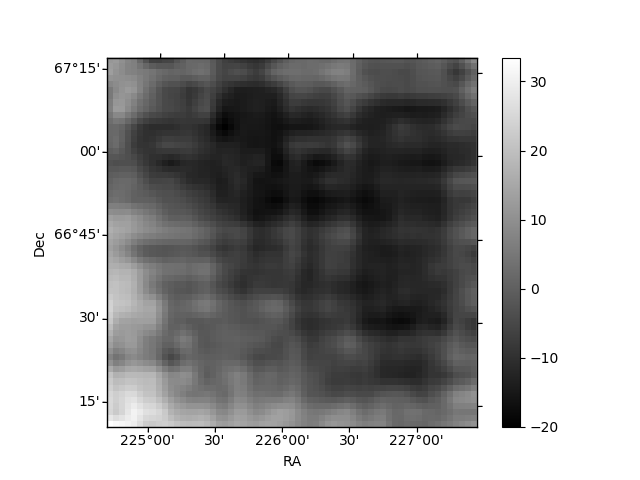
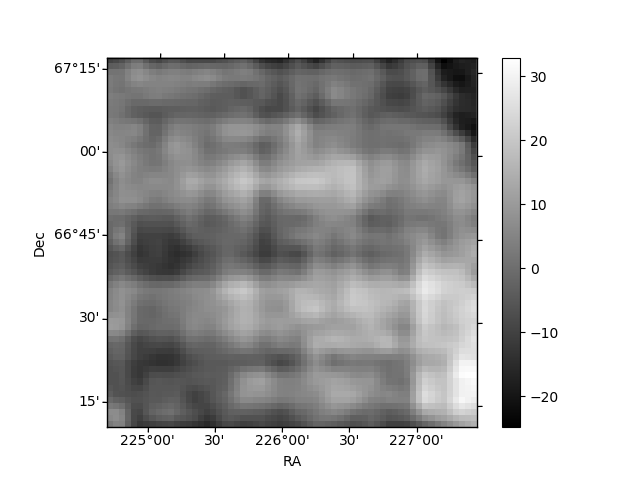
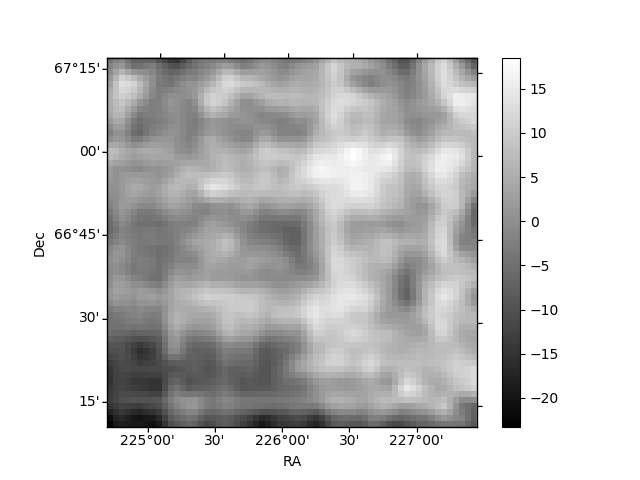
Histogram calculated using DETX and DETY for each event in the final _common_clean file
| Quadrant A | 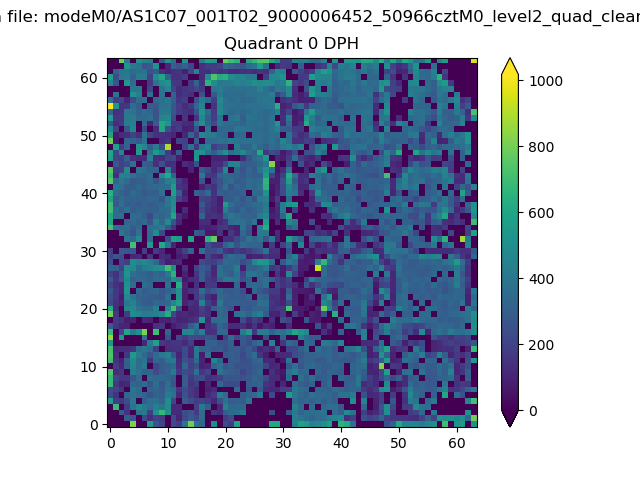 |
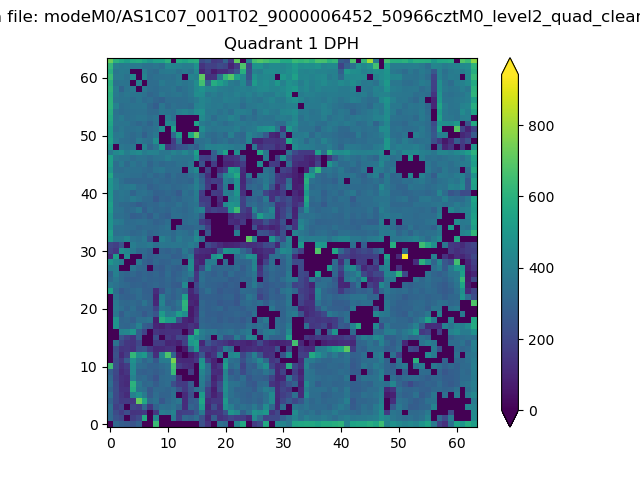 |
Quadrant B |
|---|---|---|---|
| Quadrant D | 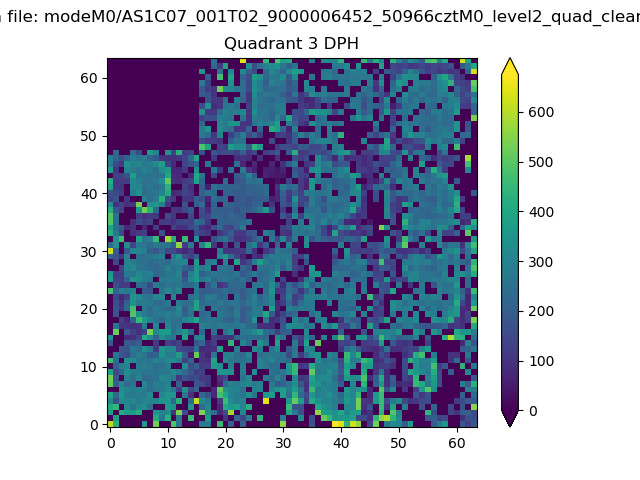 |
 |
Quadrant C |
| Plot type | Count rate plots | Images |
|---|---|---|
| Comparison with Poisson distribution Blue bars denote a histogram of data divided into 1 sec bins. Red curve is a Poisson curve with rate = median count rate of data. |
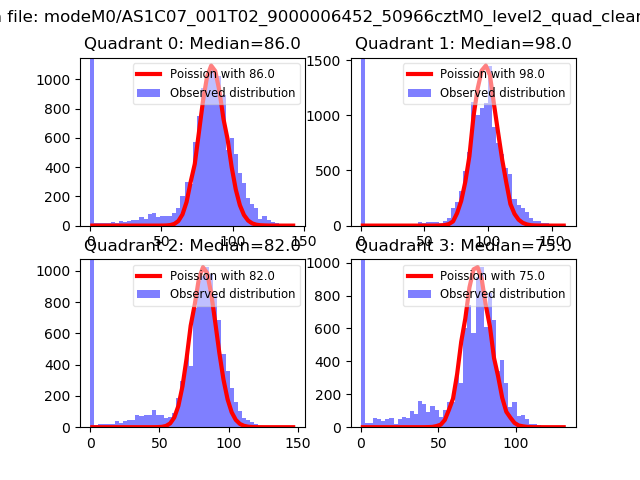 |
 |
| Quadrant-wise count rates Data is divided into 100 sec bins |
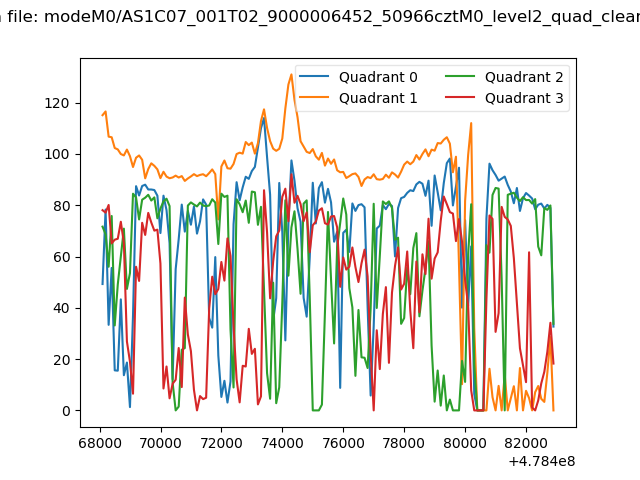 |
|
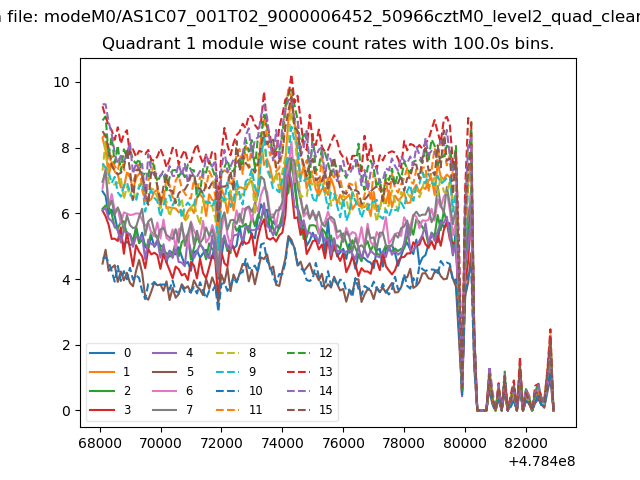
| Module-wise count rates for Quadrant A Data is divided into 100 sec bins |
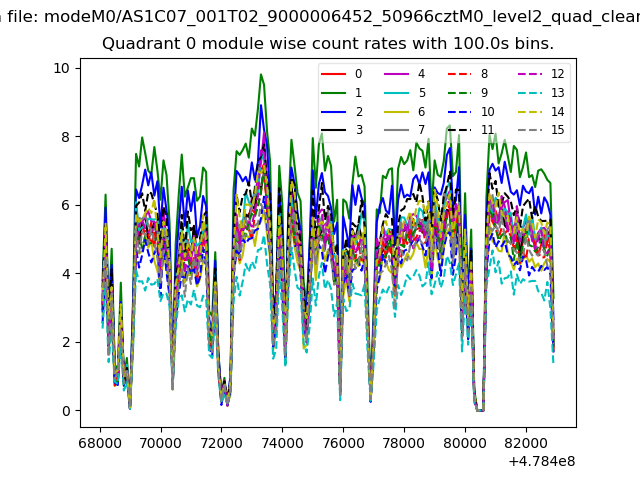 |
 |
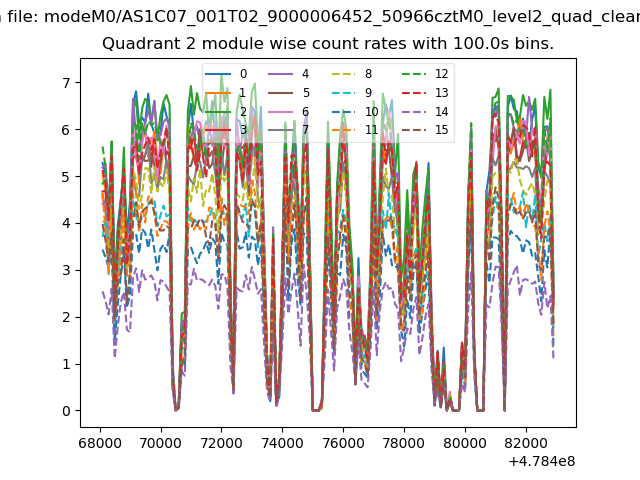
| Module-wise count rates for Quadrant B Data is divided into 100 sec bins |
 |
 |
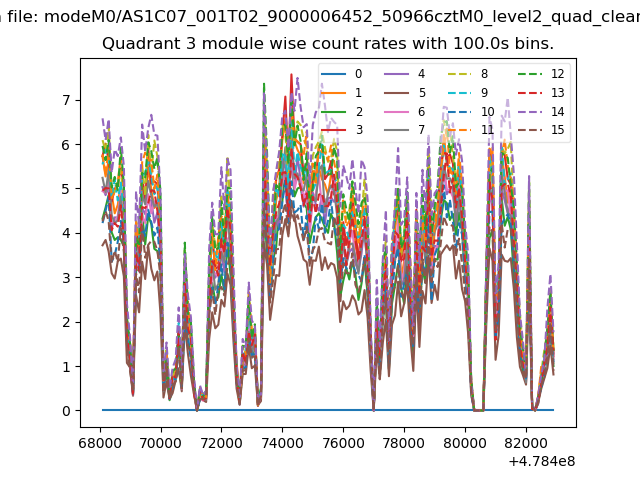
| Module-wise count rates for Quadrant C Data is divided into 100 sec bins |
 |
 |
| Module-wise count rates for Quadrant D Data is divided into 100 sec bins |
 |
 |
| Parameter | Plot |
|---|---|
| CZT HV Monitor | 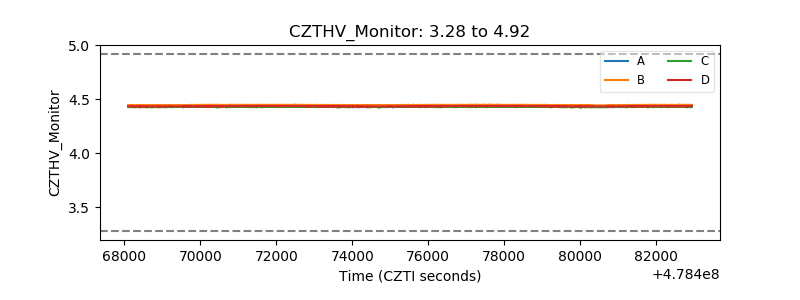 |
| D_VDD | 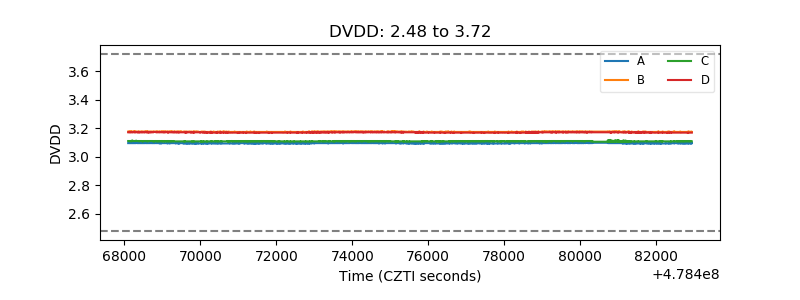 |
| Temperature 1 | 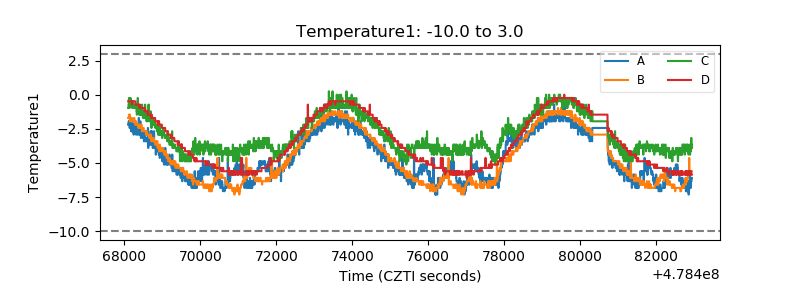 |
| Veto HV Monitor | 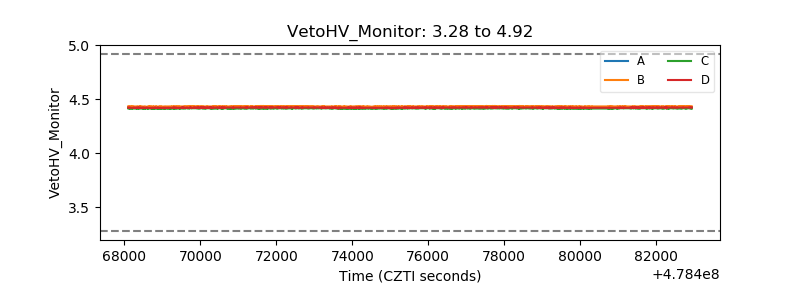 |
| Veto LLD | 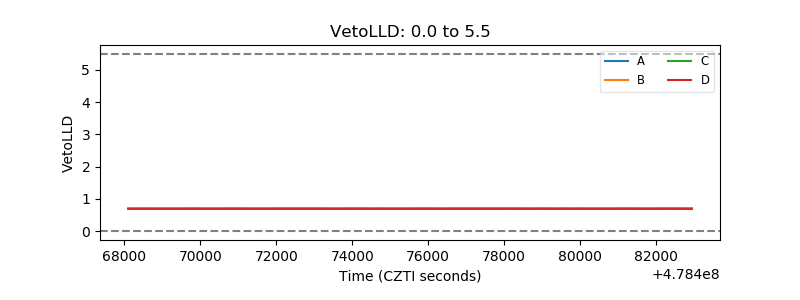 |
| Alpha Counter | 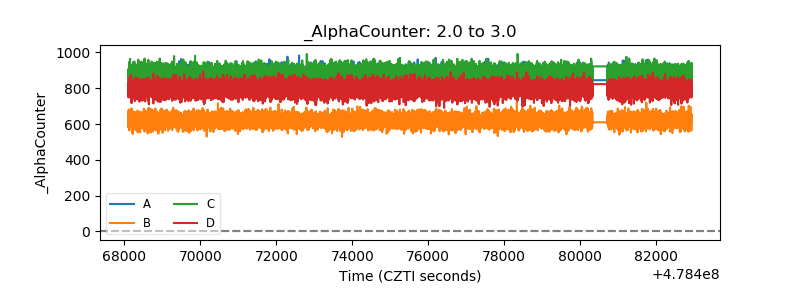 |
| _CPM_Rate | 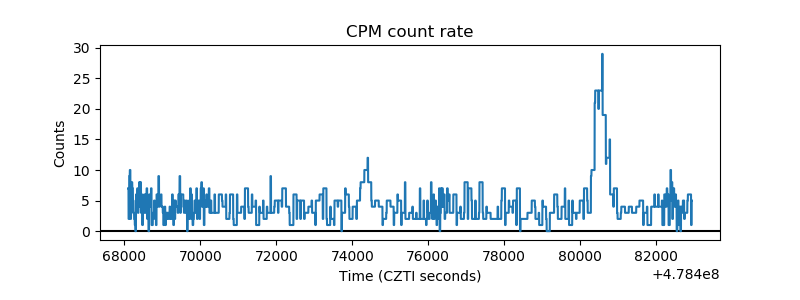 |
| CZT Counter | 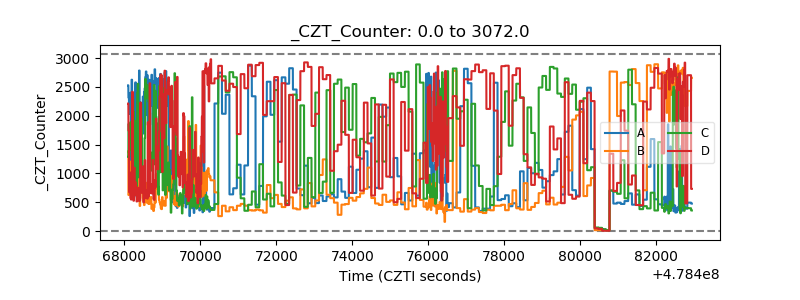 |
| +2.5 Volts monitor | 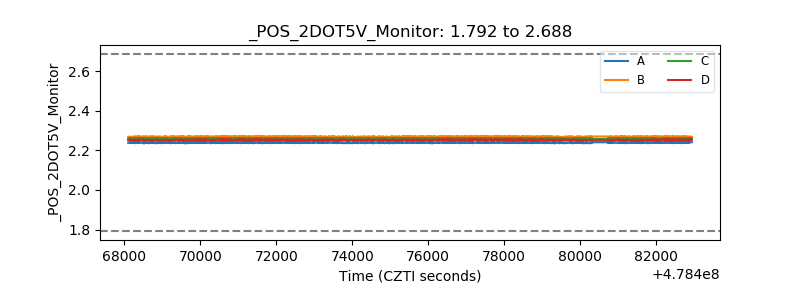 |
| +5 Volts monitor | 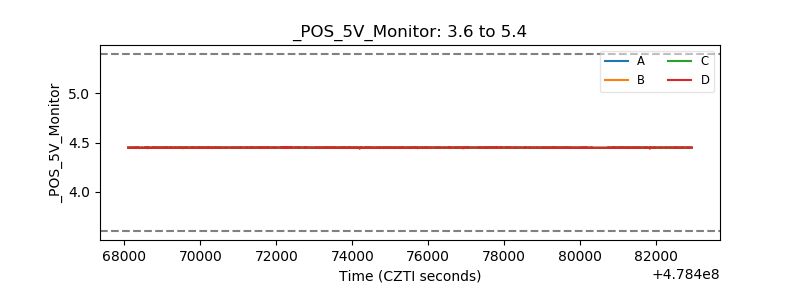 |
| _ROLL_ROT | 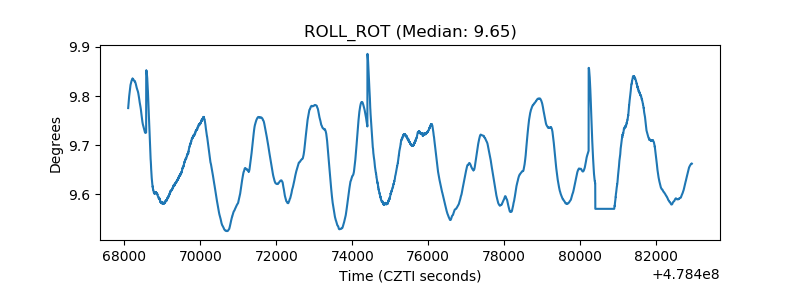 |
| _Roll_DEC | 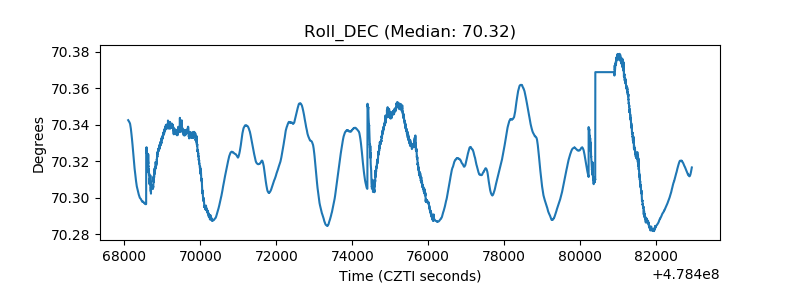 |
| _Roll_RA | 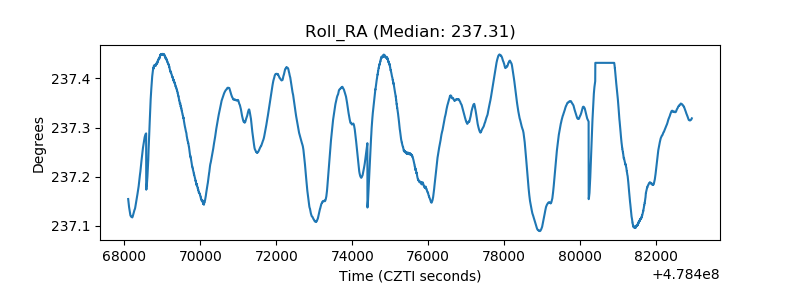 |
| Veto Counter | 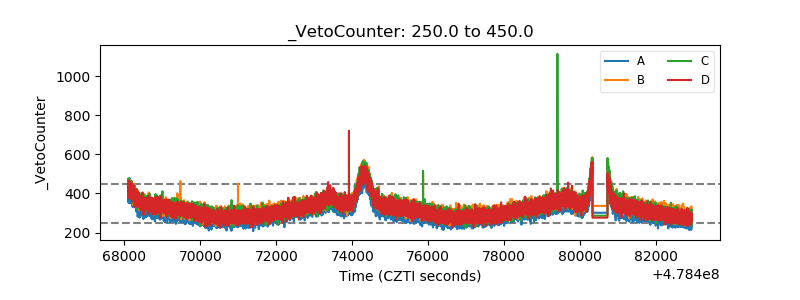 |