| Param | Original file | Final file |
|---|---|---|
| Filename | modeM0/AS1C07_001T02_9000006452_50967cztM0_level2.fits | modeM0/AS1C07_001T02_9000006452_50967cztM0_level2_quad_clean.evt |
| Size (bytes) | 1,377,316,800 | 129,214,080 |
| Size | 1.3 GB | 123.2 MB |
| Events in quadrant A | 7,684,889 | 951,998 |
| Events in quadrant B | 9,119,284 | 1,000,048 |
| Events in quadrant C | 10,618,832 | 853,341 |
| Events in quadrant D | 22,711,177 | 344,303 |
| Mode SS | |||
|---|---|---|---|
| Quadrant | BADHDUFLAG | Total packets | Discarded packets |
| A | 0 | 224 | 0 |
| B | 0 | 224 | 0 |
| C | 0 | 224 | 0 |
| D | 0 | 224 | 0 |
| Mode M9 | |||
|---|---|---|---|
| Quadrant | BADHDUFLAG | Total packets | Discarded packets |
| A | 0 | 14 | 0 |
| B | 0 | 14 | 0 |
| C | 0 | 14 | 0 |
| D | 0 | 14 | 0 |
| Mode M0 | |||
|---|---|---|---|
| Quadrant | BADHDUFLAG | Total packets | Discarded packets |
| A | 0 | 30501 | 2 |
| B | 0 | 34778 | 2 |
| C | 0 | 39351 | 2 |
| D | 0 | 74960 | 2 |
| Quadrant | Total seconds | Saturated seconds | Saturation percentage |
|---|---|---|---|
| A | 11006 | 607 | 5.515174% |
| B | 11007 | 1133 | 10.293450% |
| C | 11007 | 1479 | 13.436904% |
| D | 11007 | 7291 | 66.239666% |
Noise dominated data is calculated using 1-second bins in cleaned event files. If a bin has >2000 counts, and if more than 50% of those come from <1% of pixels, then it is considered to be noise-dominated and hence unusable.
| Quadrant | # 1 sec bins | Bins with >0 counts | Bins with >2000 counts | High rate bins dominated by noise | Noise dominated (total time) | Noise dominated (detector-on time) | Marked lightcurve |
|---|---|---|---|---|---|---|---|
| A | 12391 | 11007 | 452 | 452 | 3.65% | 4.11% | 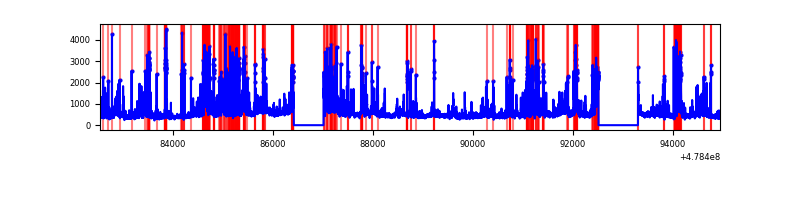 |
| B | 12392 | 11009 | 824 | 824 | 6.65% | 7.48% | 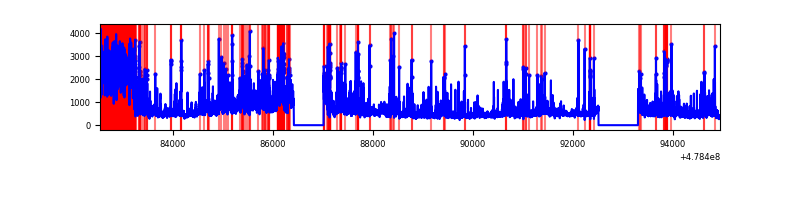 |
| C | 12392 | 11008 | 1121 | 1121 | 9.05% | 10.18% |  |
| D | 12391 | 11008 | 6677 | 6677 | 53.89% | 60.66% | 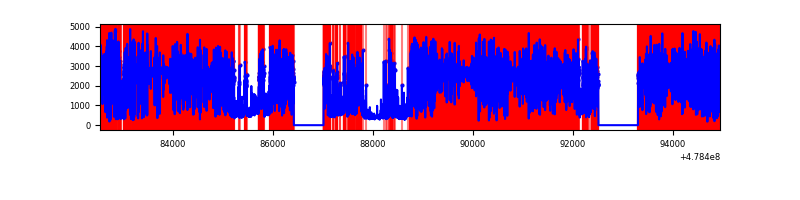 |
Top three noisy pixels from each quadrant. If the there are fewer than three noisy pixels in the level2.evt file, extra rows are filled as -1
| Pixel properties | Quadrant properties | ||||||
|---|---|---|---|---|---|---|---|
| Quadrant | DetID | PixID | Counts | Sigma | Mean | Median | Sigma |
| A | 14 | 254 | 1154277 | 4136.51 | 1107 | 1080 | 278.8 |
| A | 8 | 43 | 734407 | 2630.44 | 1107 | 1080 | 278.8 |
| A | 4 | 3 | 458906 | 1642.22 | 1107 | 1080 | 278.8 |
| B | 5 | 236 | 2816190 | 12348.35 | 1083 | 1047 | 228.0 |
| B | 4 | 171 | 563622 | 2467.68 | 1083 | 1047 | 228.0 |
| B | 4 | 206 | 424776 | 1858.65 | 1083 | 1047 | 228.0 |
| C | 15 | 147 | 1239202 | 4228.41 | 1049 | 1039 | 292.8 |
| C | 13 | 49 | 1135837 | 3875.41 | 1049 | 1039 | 292.8 |
| C | 0 | 177 | 637366 | 2173.1 | 1049 | 1039 | 292.8 |
| D | 8 | 176 | 19012630 | 97345.56 | 689 | 663 | 195.3 |
| D | 3 | 12 | 135429 | 690.03 | 689 | 663 | 195.3 |
| D | 15 | 185 | 104625 | 532.31 | 689 | 663 | 195.3 |
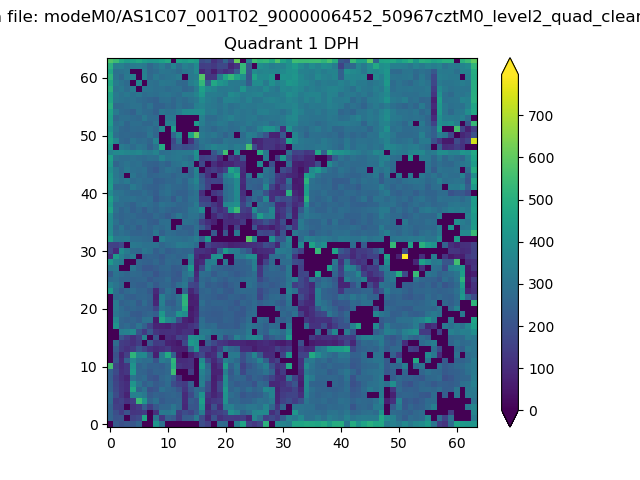
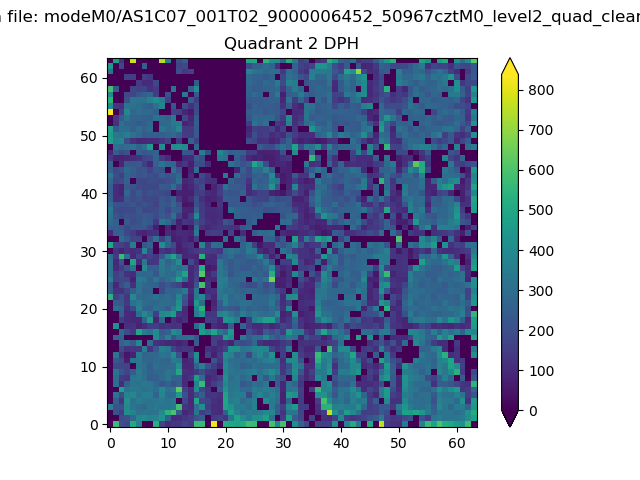
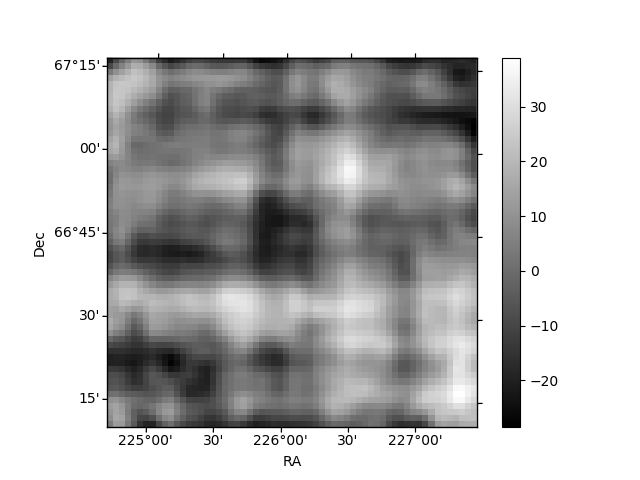
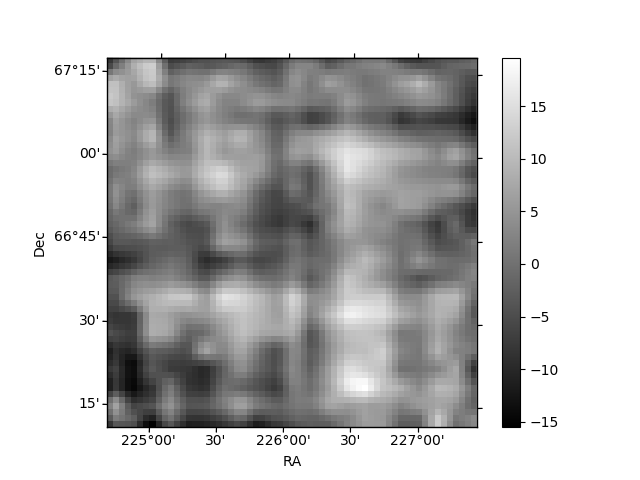
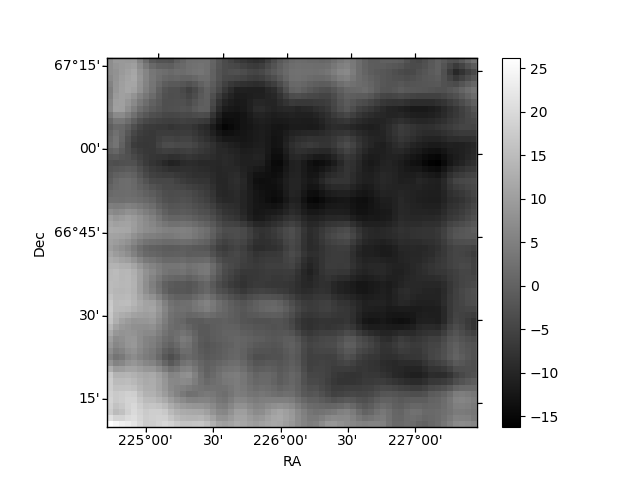
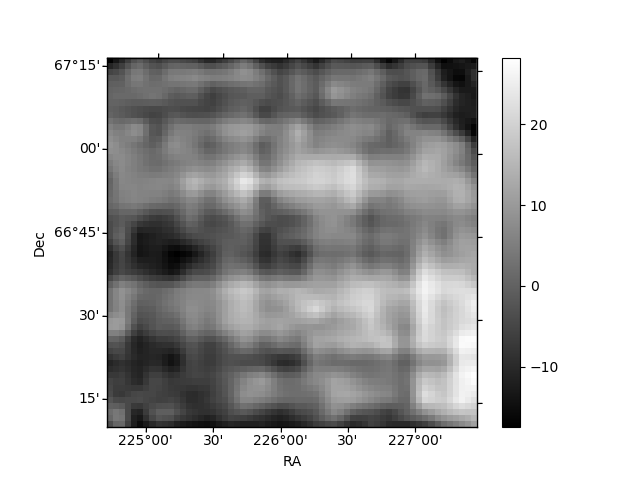
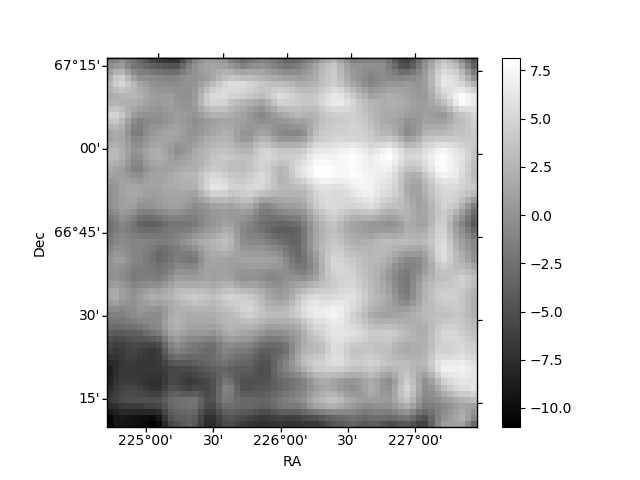
Histogram calculated using DETX and DETY for each event in the final _common_clean file
| Quadrant A | 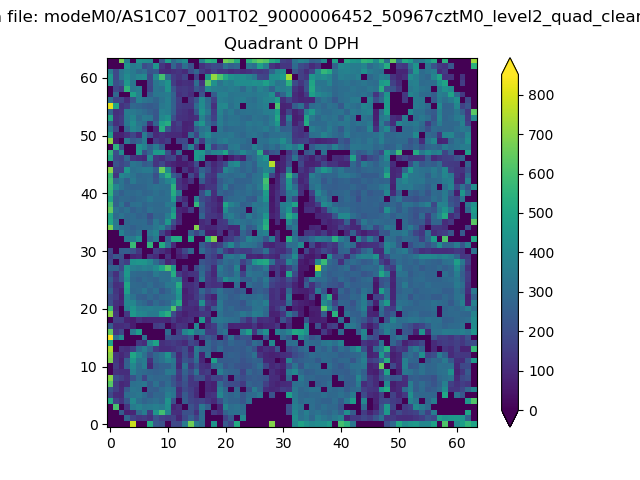 |
 |
Quadrant B |
|---|---|---|---|
| Quadrant D | 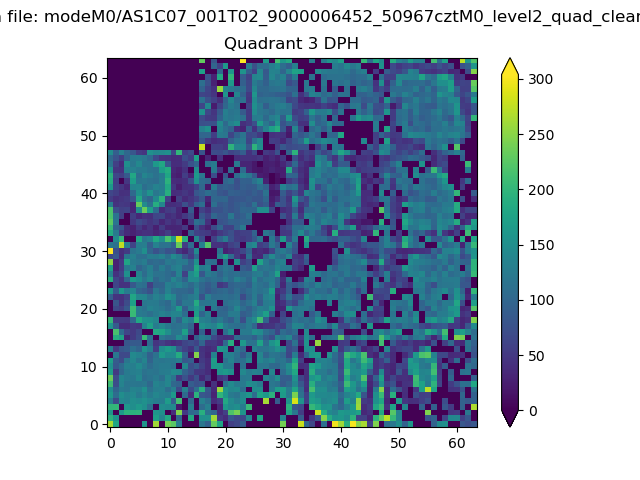 |
 |
Quadrant C |
| Plot type | Count rate plots | Images |
|---|---|---|
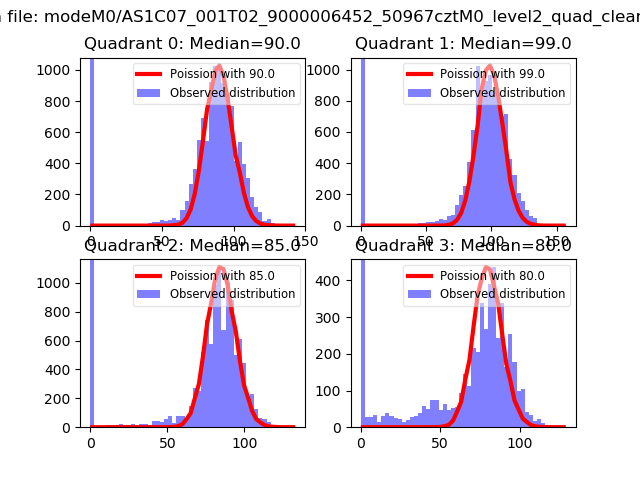
| Comparison with Poisson distribution Blue bars denote a histogram of data divided into 1 sec bins. Red curve is a Poisson curve with rate = median count rate of data. |
 |
 |
| Quadrant-wise count rates Data is divided into 100 sec bins |
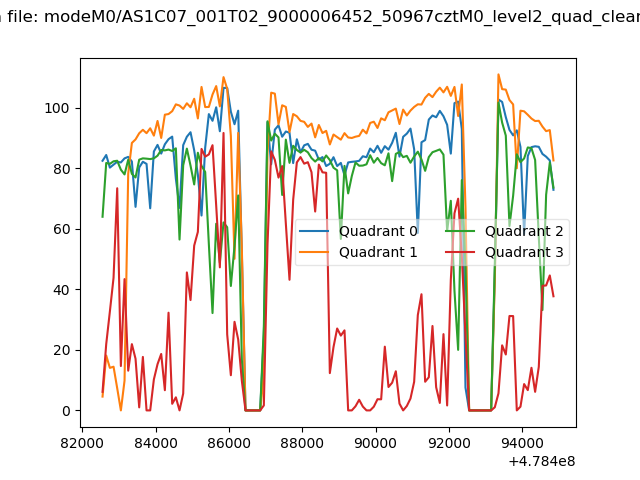 |
|
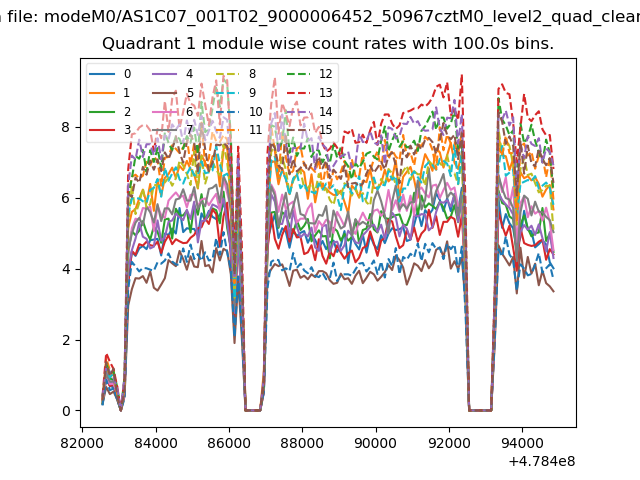
| Module-wise count rates for Quadrant A Data is divided into 100 sec bins |
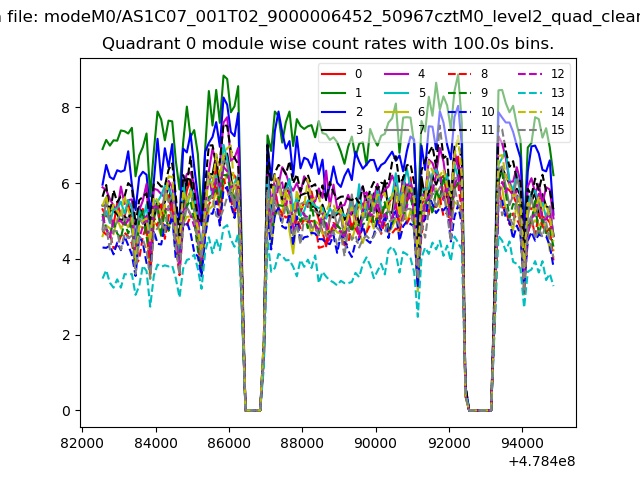 |
 |
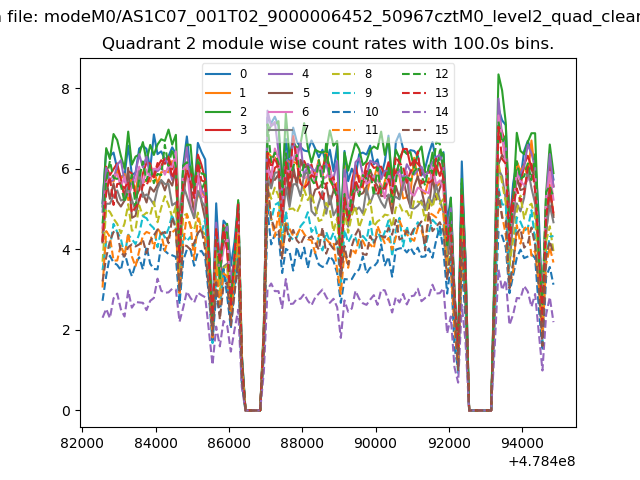
| Module-wise count rates for Quadrant B Data is divided into 100 sec bins |
 |
 |
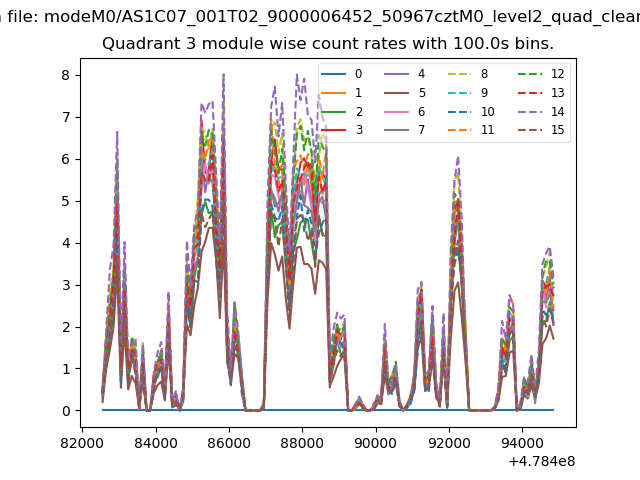
| Module-wise count rates for Quadrant C Data is divided into 100 sec bins |
 |
 |
| Module-wise count rates for Quadrant D Data is divided into 100 sec bins |
 |
 |
| Parameter | Plot |
|---|---|
| CZT HV Monitor | 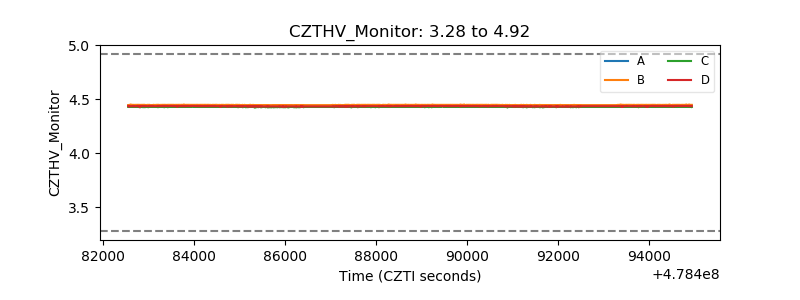 |
| D_VDD | 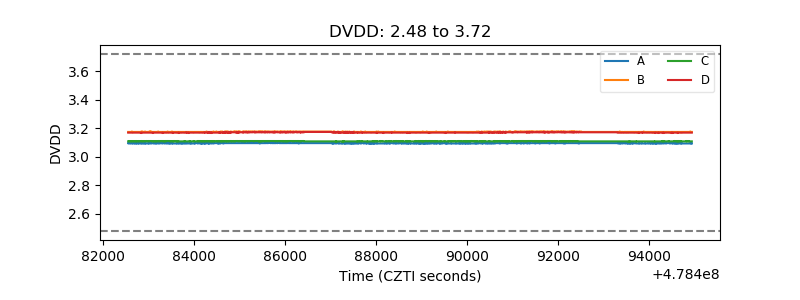 |
| Temperature 1 | 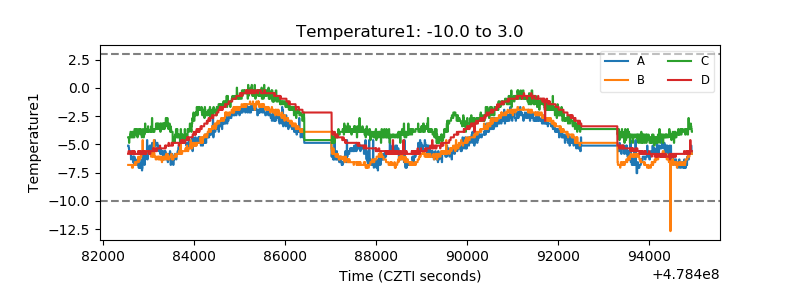 |
| Veto HV Monitor | 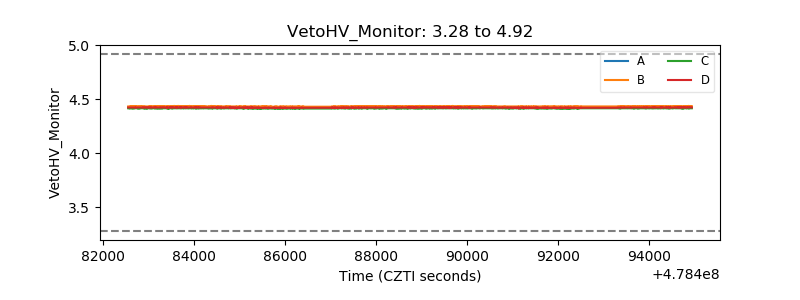 |
| Veto LLD | 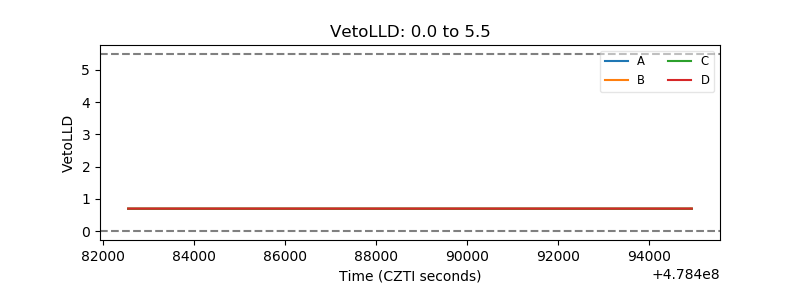 |
| Alpha Counter | 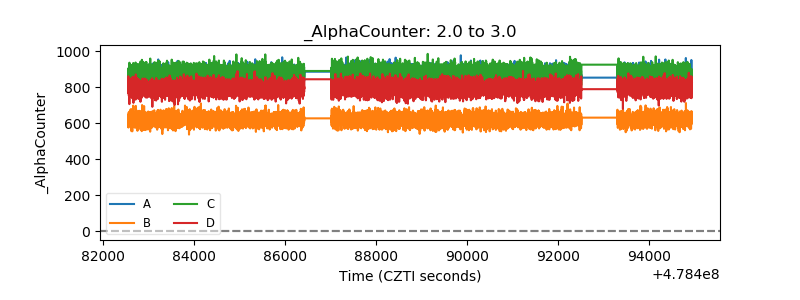 |
| _CPM_Rate | 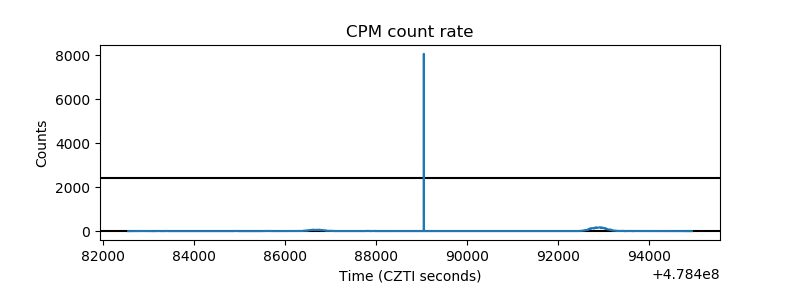 |
| CZT Counter | 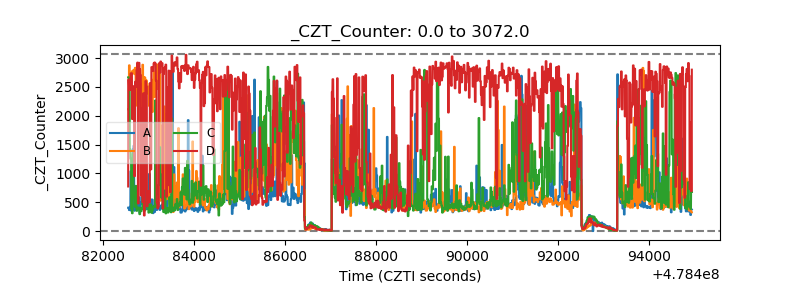 |
| +2.5 Volts monitor | 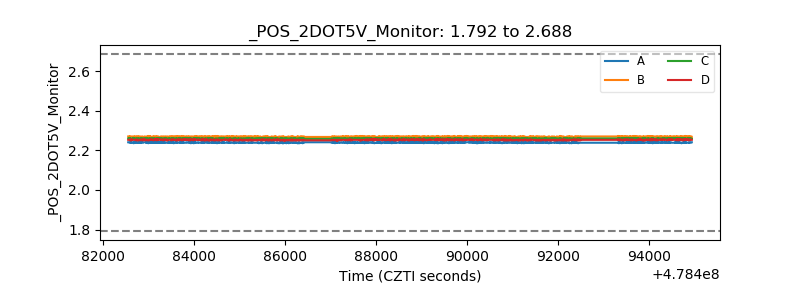 |
| +5 Volts monitor | 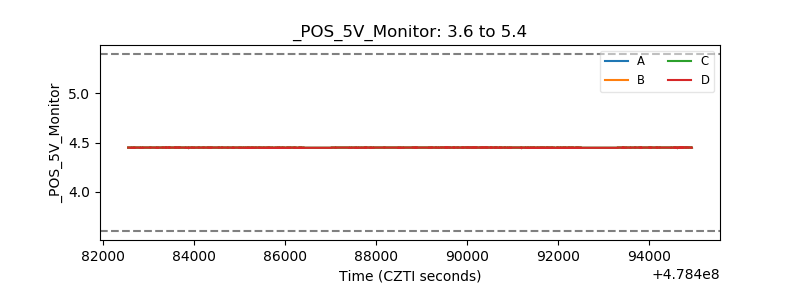 |
| _ROLL_ROT | 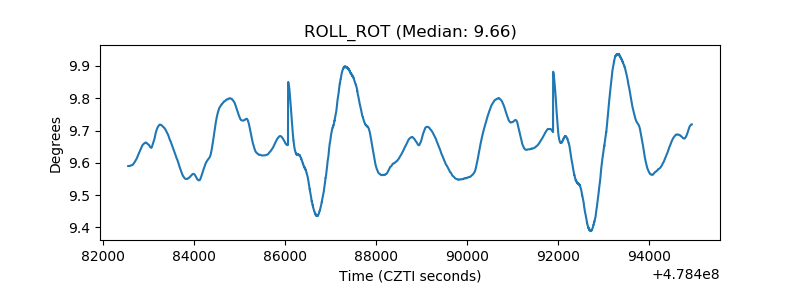 |
| _Roll_DEC | 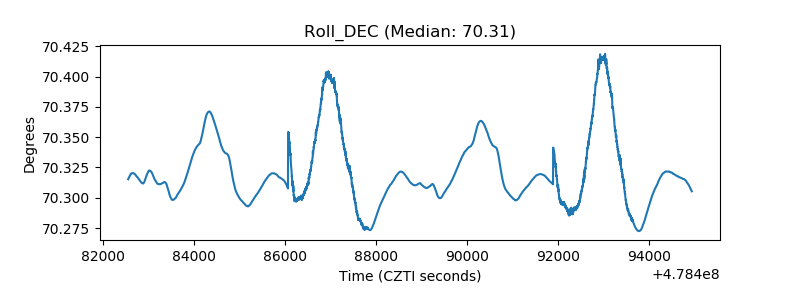 |
| _Roll_RA | 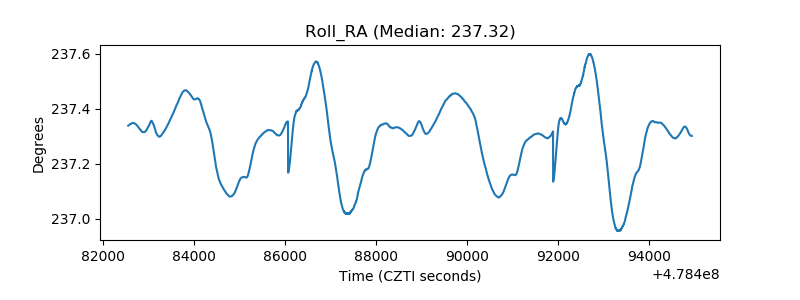 |
| Veto Counter | 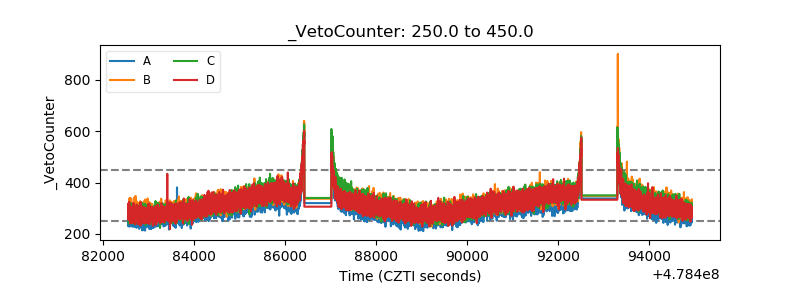 |