| Param | Original file | Final file |
|---|---|---|
| Filename | modeM0/AS1C07_001T02_9000006452_50970cztM0_level2.fits | modeM0/AS1C07_001T02_9000006452_50970cztM0_level2_quad_clean.evt |
| Size (bytes) | 724,645,440 | 78,828,480 |
| Size | 691.1 MB | 75.2 MB |
| Events in quadrant A | 6,890,153 | 484,784 |
| Events in quadrant B | 3,378,349 | 639,462 |
| Events in quadrant C | 4,936,371 | 537,491 |
| Events in quadrant D | 11,131,991 | 285,676 |
| Mode SS | |||
|---|---|---|---|
| Quadrant | BADHDUFLAG | Total packets | Discarded packets |
| A | 0 | 133 | 3 |
| B | 0 | 134 | 2 |
| C | 0 | 133 | 5 |
| D | 0 | 132 | 2 |
| Mode M9 | |||
|---|---|---|---|
| Quadrant | BADHDUFLAG | Total packets | Discarded packets |
| A | 0 | 11 | 0 |
| B | 0 | 11 | 0 |
| C | 0 | 12 | 0 |
| D | 0 | 11 | 0 |
| Mode M0 | |||
|---|---|---|---|
| Quadrant | BADHDUFLAG | Total packets | Discarded packets |
| A | 0 | 25529 | 695 |
| B | 0 | 15130 | 565 |
| C | 0 | 19631 | 546 |
| D | 0 | 40425 | 3106 |
| Quadrant | Total seconds | Saturated seconds | Saturation percentage |
|---|---|---|---|
| A | 6325 | 1312 | 20.743083% |
| B | 6321 | 118 | 1.866793% |
| C | 6329 | 486 | 7.678938% |
| D | 6161 | 3071 | 49.845804% |
Noise dominated data is calculated using 1-second bins in cleaned event files. If a bin has >2000 counts, and if more than 50% of those come from <1% of pixels, then it is considered to be noise-dominated and hence unusable.
| Quadrant | # 1 sec bins | Bins with >0 counts | Bins with >2000 counts | High rate bins dominated by noise | Noise dominated (total time) | Noise dominated (detector-on time) | Marked lightcurve |
|---|---|---|---|---|---|---|---|
| A | 7632 | 6428 | 1185 | 1185 | 15.53% | 18.43% | 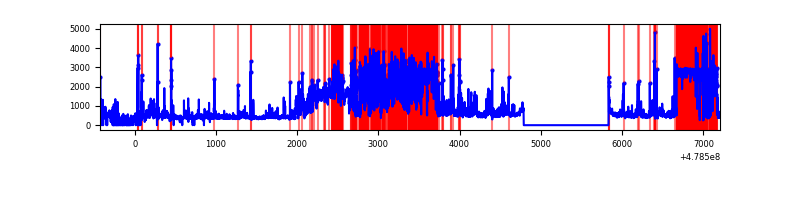 |
| B | 7632 | 6426 | 48 | 48 | 0.63% | 0.75% | 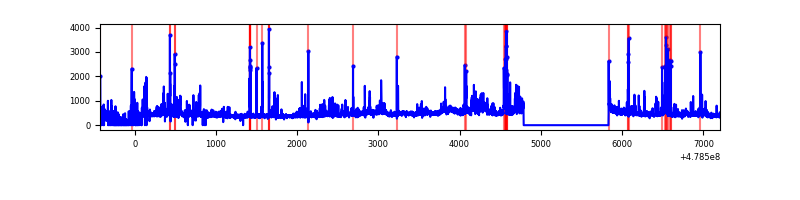 |
| C | 7632 | 6424 | 433 | 433 | 5.67% | 6.74% | 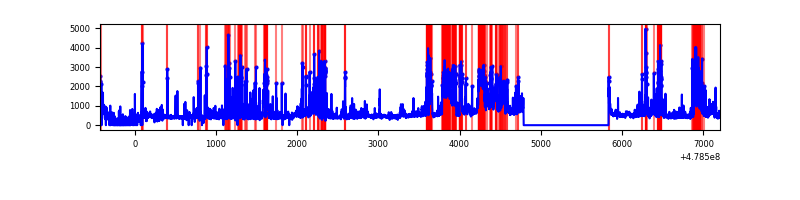 |
| D | 7631 | 6199 | 2844 | 2844 | 37.27% | 45.88% | 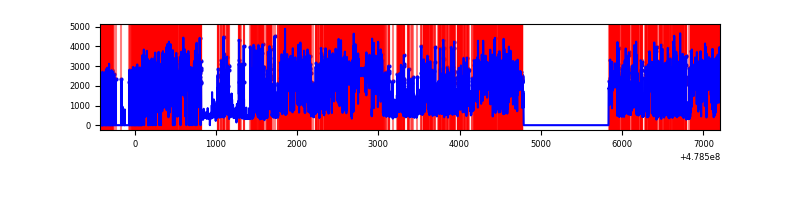 |
Top three noisy pixels from each quadrant. If the there are fewer than three noisy pixels in the level2.evt file, extra rows are filled as -1
| Pixel properties | Quadrant properties | ||||||
|---|---|---|---|---|---|---|---|
| Quadrant | DetID | PixID | Counts | Sigma | Mean | Median | Sigma |
| A | 14 | 254 | 1682015 | 11331.29 | 587 | 573 | 148.4 |
| A | 4 | 249 | 1238957 | 8345.51 | 587 | 573 | 148.4 |
| A | 12 | 80 | 847938 | 5710.42 | 587 | 573 | 148.4 |
| B | 4 | 206 | 172207 | 1240.57 | 650 | 629 | 138.3 |
| B | 8 | 128 | 127813 | 919.58 | 650 | 629 | 138.3 |
| B | 4 | 81 | 113629 | 817.03 | 650 | 629 | 138.3 |
| C | 15 | 147 | 1049822 | 6150.12 | 621 | 617 | 170.6 |
| C | 4 | 12 | 405355 | 2372.45 | 621 | 617 | 170.6 |
| C | 12 | 247 | 140859 | 822.06 | 621 | 617 | 170.6 |
| D | 8 | 176 | 8633899 | 65791.21 | 454 | 437 | 131.2 |
| D | 10 | 181 | 338912 | 2579.35 | 454 | 437 | 131.2 |
| D | 2 | 249 | 123089 | 934.67 | 454 | 437 | 131.2 |
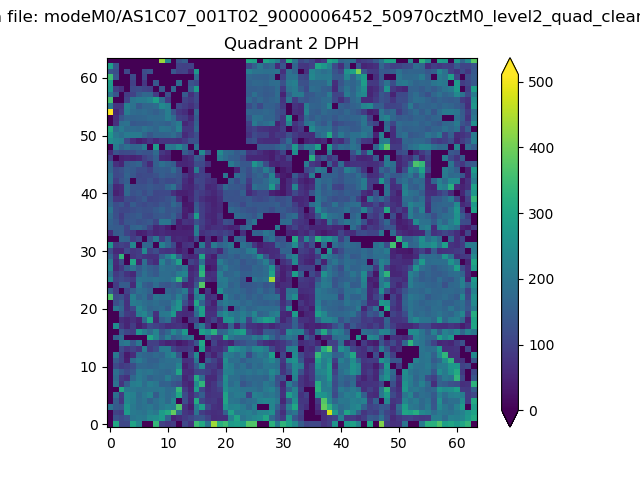
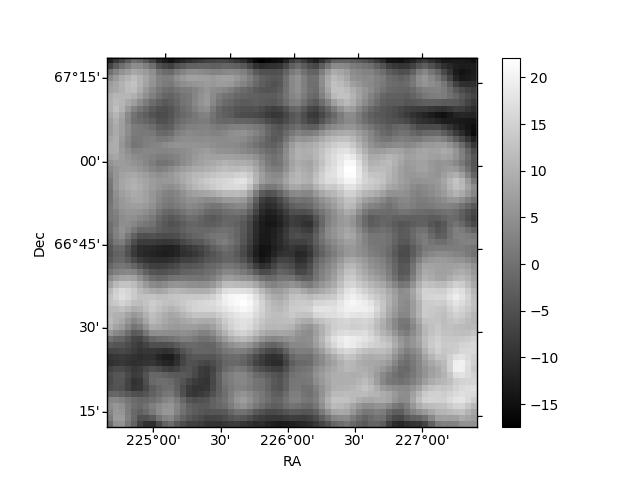
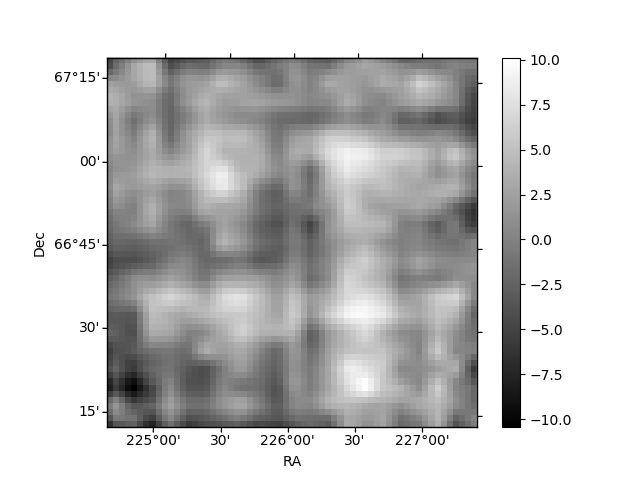
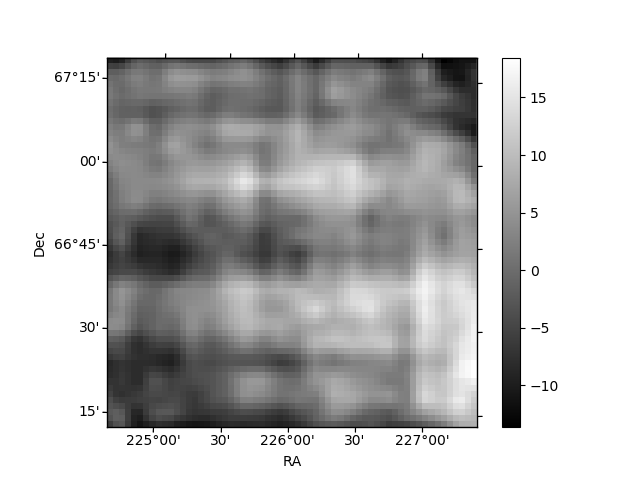
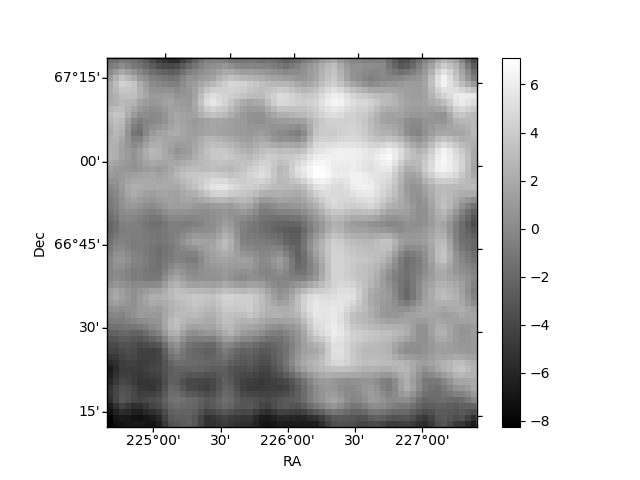
Histogram calculated using DETX and DETY for each event in the final _common_clean file
| Quadrant A | 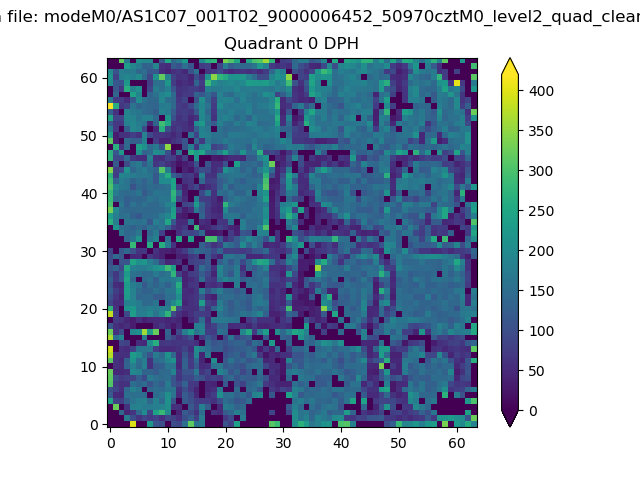 |
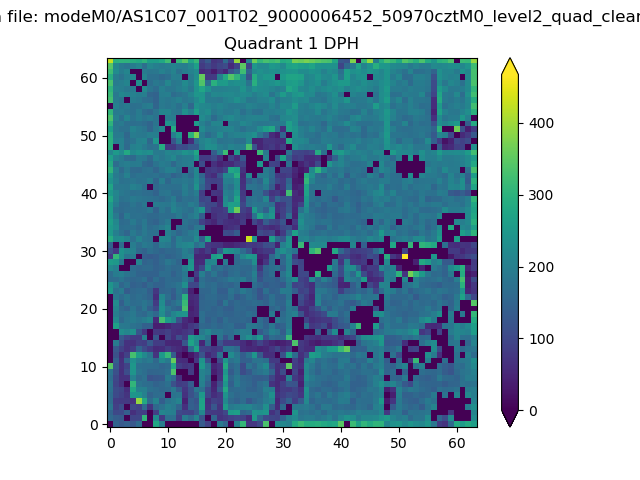 |
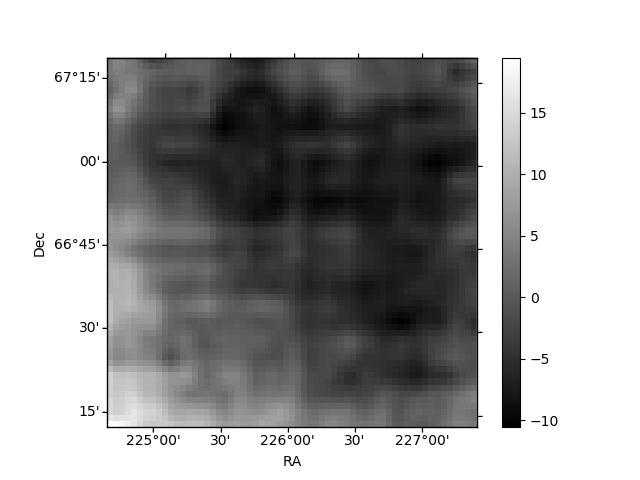
Quadrant B |
|---|---|---|---|
| Quadrant D | 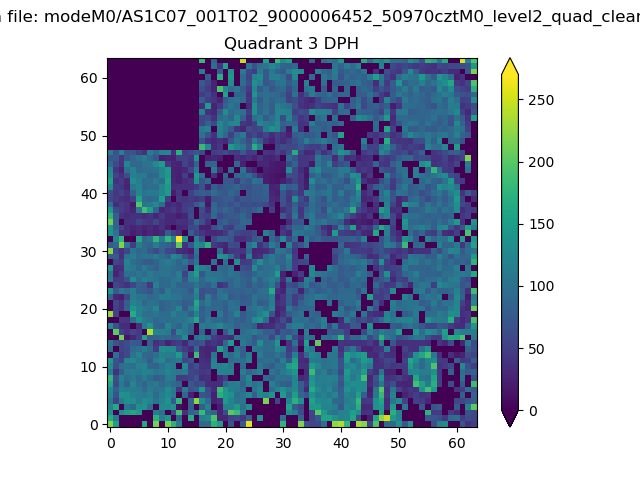 |
 |
Quadrant C |
| Plot type | Count rate plots | Images |
|---|---|---|
| Comparison with Poisson distribution Blue bars denote a histogram of data divided into 1 sec bins. Red curve is a Poisson curve with rate = median count rate of data. |
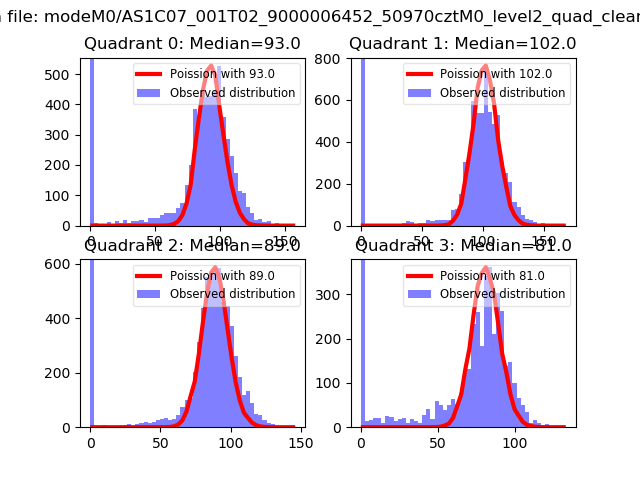 |
 |
| Quadrant-wise count rates Data is divided into 100 sec bins |
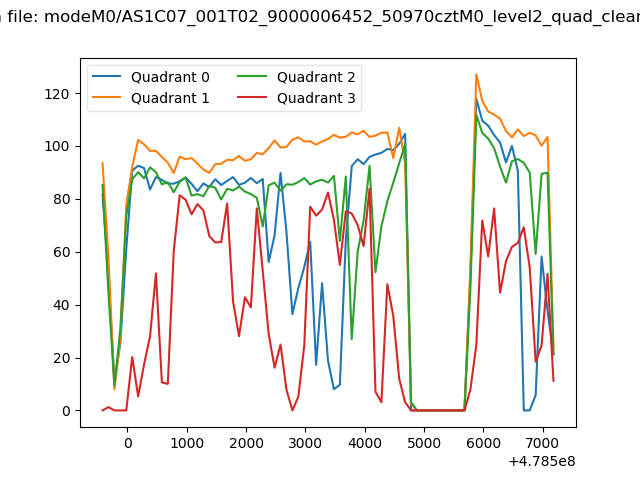 |
|
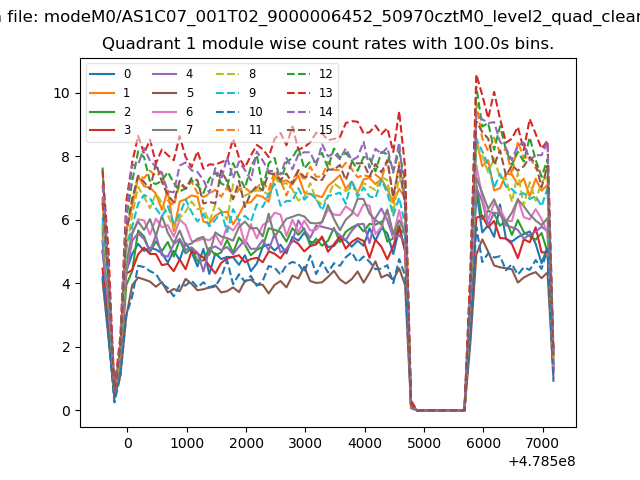
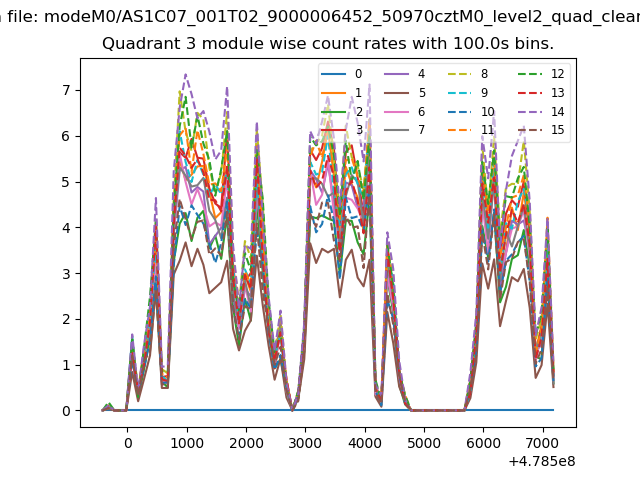
| Module-wise count rates for Quadrant A Data is divided into 100 sec bins |
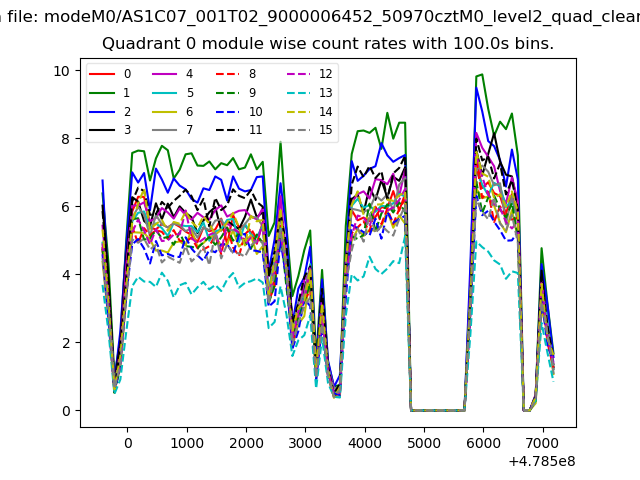 |
 |
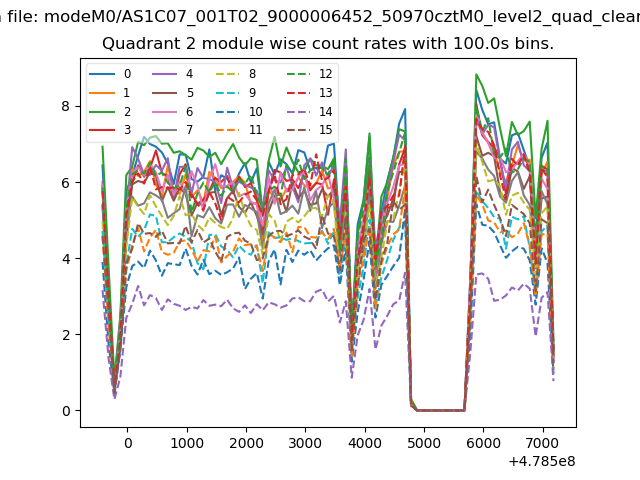
| Module-wise count rates for Quadrant B Data is divided into 100 sec bins |
 |
 |
| Module-wise count rates for Quadrant C Data is divided into 100 sec bins |
 |
 |
| Module-wise count rates for Quadrant D Data is divided into 100 sec bins |
 |
 |
| Parameter | Plot |
|---|---|
| CZT HV Monitor | 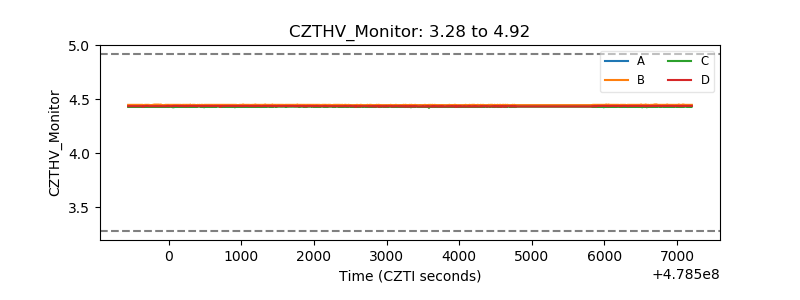 |
| D_VDD | 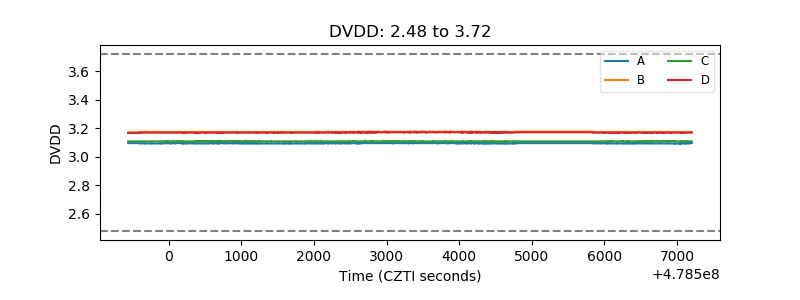 |
| Temperature 1 | 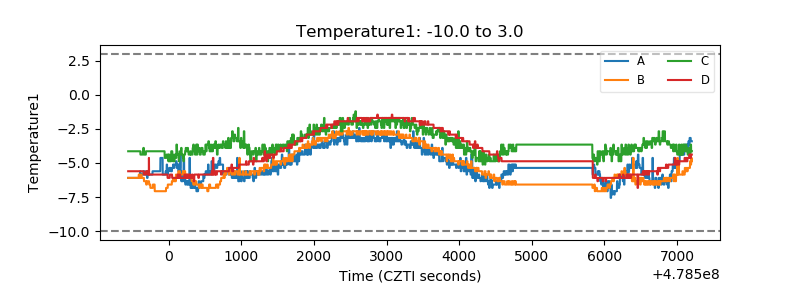 |
| Veto HV Monitor | 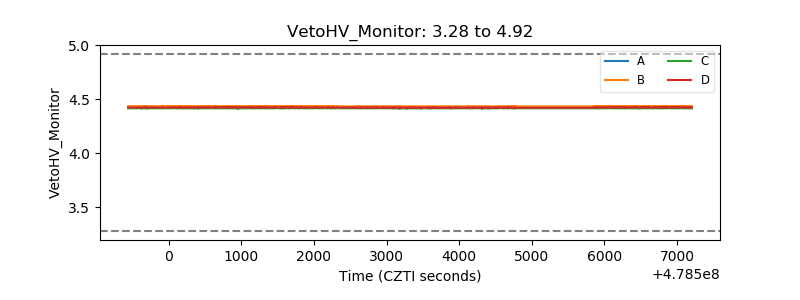 |
| Veto LLD | 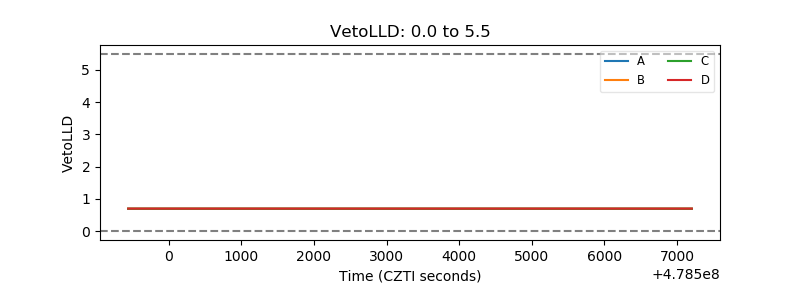 |
| Alpha Counter | 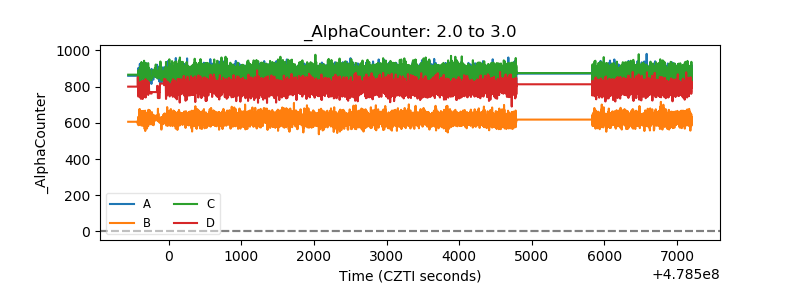 |
| _CPM_Rate | 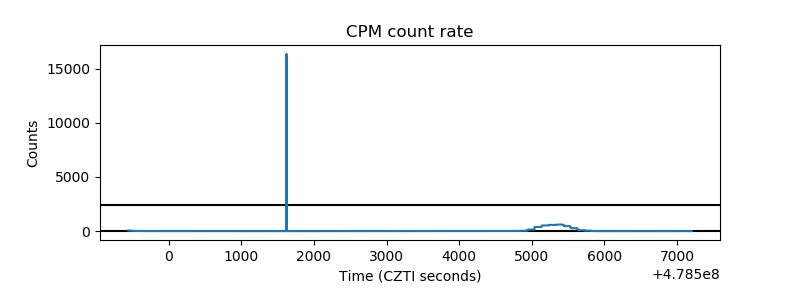 |
| CZT Counter | 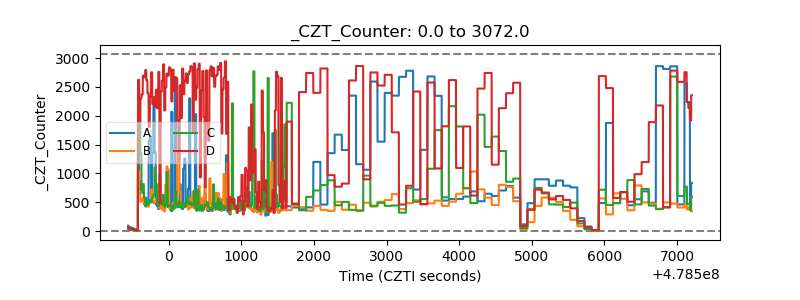 |
| +2.5 Volts monitor | 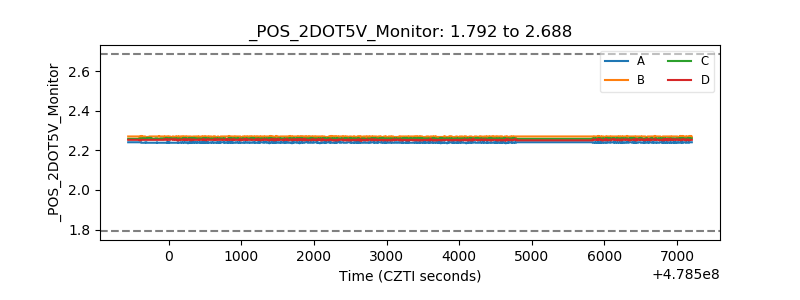 |
| +5 Volts monitor | 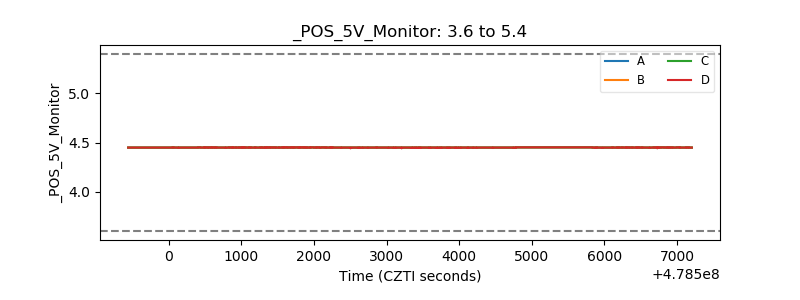 |
| _ROLL_ROT | 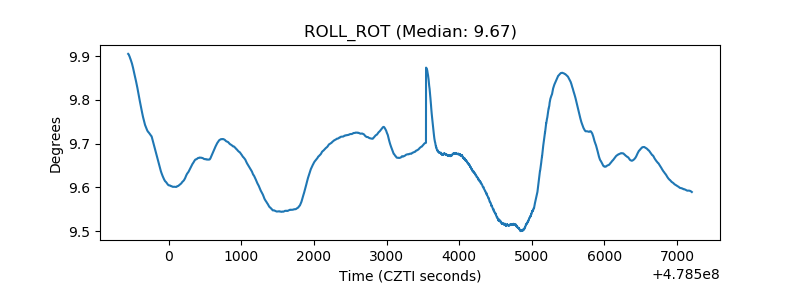 |
| _Roll_DEC | 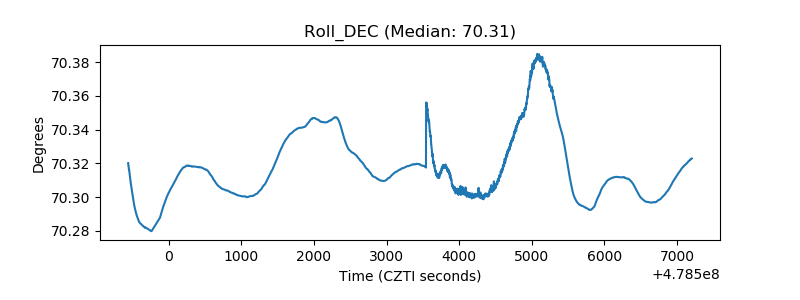 |
| _Roll_RA | 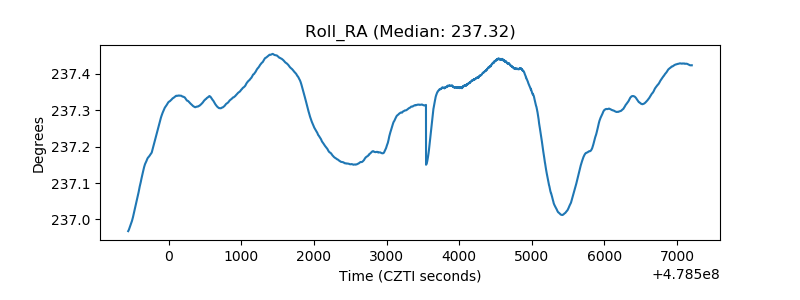 |
| Veto Counter | 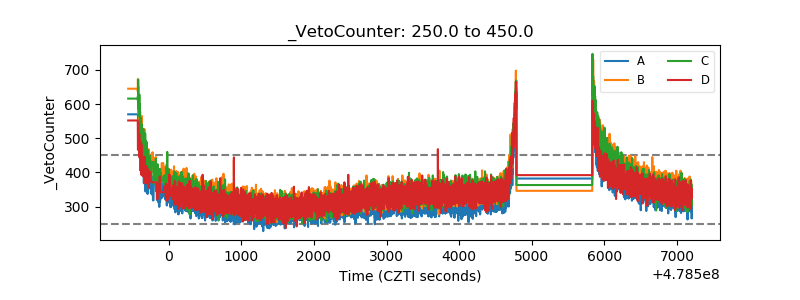 |