| Param | Original file | Final file |
|---|---|---|
| Filename | modeM0/AS1C07_001T02_9000006452_50971cztM0_level2.fits | modeM0/AS1C07_001T02_9000006452_50971cztM0_level2_quad_clean.evt |
| Size (bytes) | 658,848,960 | 87,186,240 |
| Size | 628.3 MB | 83.1 MB |
| Events in quadrant A | 6,935,253 | 518,441 |
| Events in quadrant B | 3,921,135 | 669,552 |
| Events in quadrant C | 5,293,963 | 563,092 |
| Events in quadrant D | 7,743,013 | 443,089 |
| Mode SS | |||
|---|---|---|---|
| Quadrant | BADHDUFLAG | Total packets | Discarded packets |
| A | 0 | 128 | 0 |
| B | 0 | 128 | 0 |
| C | 0 | 128 | 0 |
| D | 0 | 128 | 0 |
| Mode M9 | |||
|---|---|---|---|
| Quadrant | BADHDUFLAG | Total packets | Discarded packets |
| A | 0 | 12 | 0 |
| B | 0 | 12 | 0 |
| C | 0 | 12 | 0 |
| D | 0 | 12 | 0 |
| Mode M0 | |||
|---|---|---|---|
| Quadrant | BADHDUFLAG | Total packets | Discarded packets |
| A | 0 | 24948 | 1 |
| B | 0 | 16244 | 1 |
| C | 0 | 20110 | 1 |
| D | 0 | 27480 | 1 |
| Quadrant | Total seconds | Saturated seconds | Saturation percentage |
|---|---|---|---|
| A | 6392 | 1263 | 19.759074% |
| B | 6392 | 172 | 2.690864% |
| C | 6392 | 512 | 8.010013% |
| D | 6393 | 1515 | 23.697794% |
Noise dominated data is calculated using 1-second bins in cleaned event files. If a bin has >2000 counts, and if more than 50% of those come from <1% of pixels, then it is considered to be noise-dominated and hence unusable.
| Quadrant | # 1 sec bins | Bins with >0 counts | Bins with >2000 counts | High rate bins dominated by noise | Noise dominated (total time) | Noise dominated (detector-on time) | Marked lightcurve |
|---|---|---|---|---|---|---|---|
| A | 7522 | 6393 | 1120 | 1120 | 14.89% | 17.52% | 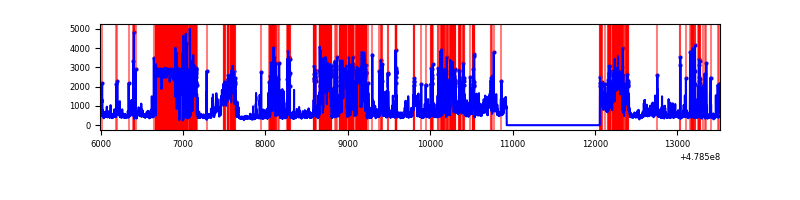 |
| B | 7522 | 6393 | 90 | 90 | 1.20% | 1.41% | 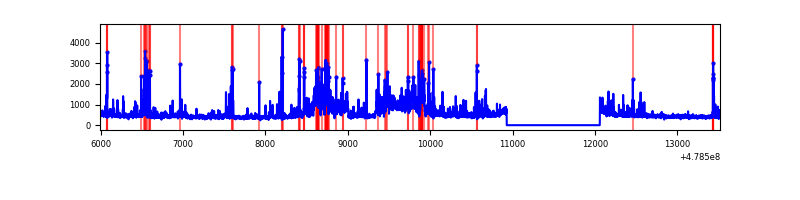 |
| C | 7522 | 6393 | 474 | 474 | 6.30% | 7.41% | 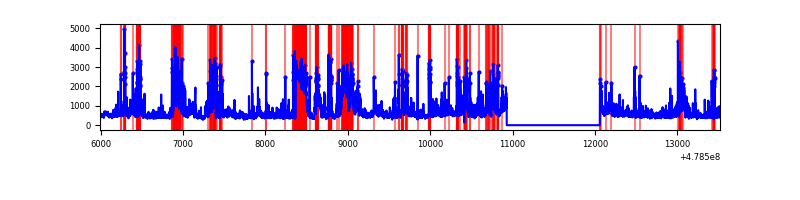 |
| D | 7523 | 6394 | 1448 | 1448 | 19.25% | 22.65% | 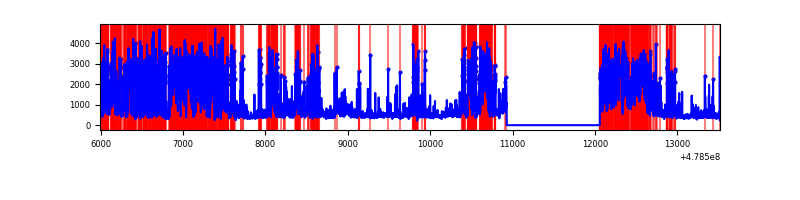 |
Top three noisy pixels from each quadrant. If the there are fewer than three noisy pixels in the level2.evt file, extra rows are filled as -1
| Pixel properties | Quadrant properties | ||||||
|---|---|---|---|---|---|---|---|
| Quadrant | DetID | PixID | Counts | Sigma | Mean | Median | Sigma |
| A | 14 | 254 | 1873302 | 12013.32 | 611 | 594 | 155.9 |
| A | 4 | 249 | 1211204 | 7766.0 | 611 | 594 | 155.9 |
| A | 12 | 80 | 478390 | 3065.04 | 611 | 594 | 155.9 |
| B | 4 | 81 | 612953 | 4318.32 | 666 | 644 | 141.8 |
| B | 4 | 206 | 268733 | 1890.7 | 666 | 644 | 141.8 |
| B | 8 | 128 | 193246 | 1358.33 | 666 | 644 | 141.8 |
| C | 15 | 147 | 1324114 | 7366.45 | 634 | 627 | 179.7 |
| C | 4 | 12 | 247989 | 1376.8 | 634 | 627 | 179.7 |
| C | 0 | 177 | 170168 | 943.66 | 634 | 627 | 179.7 |
| D | 8 | 176 | 4615970 | 28249.4 | 579 | 560 | 163.4 |
| D | 14 | 178 | 246092 | 1502.82 | 579 | 560 | 163.4 |
| D | 2 | 249 | 127500 | 776.96 | 579 | 560 | 163.4 |
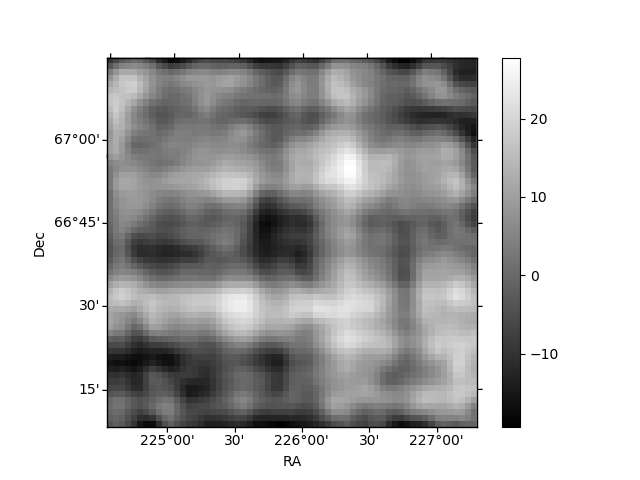
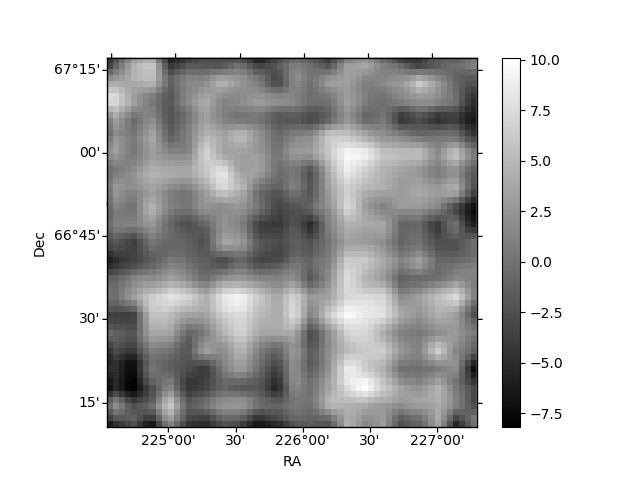
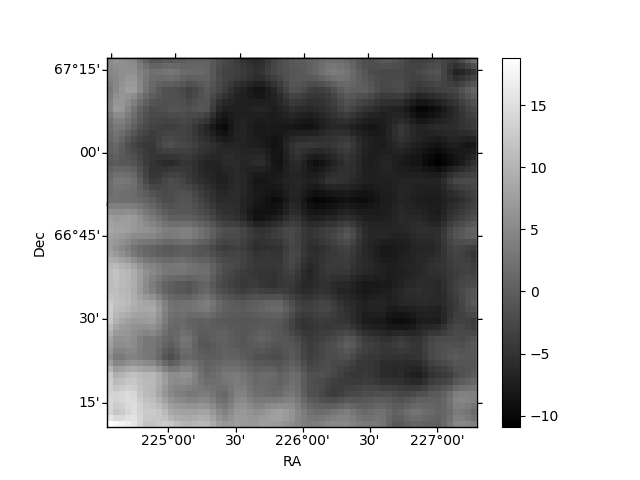
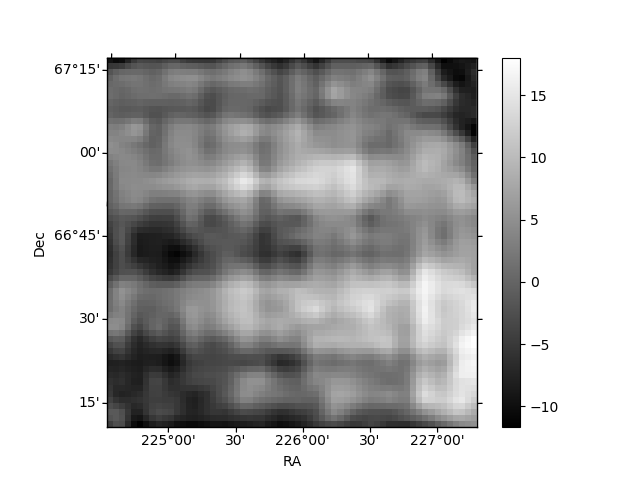
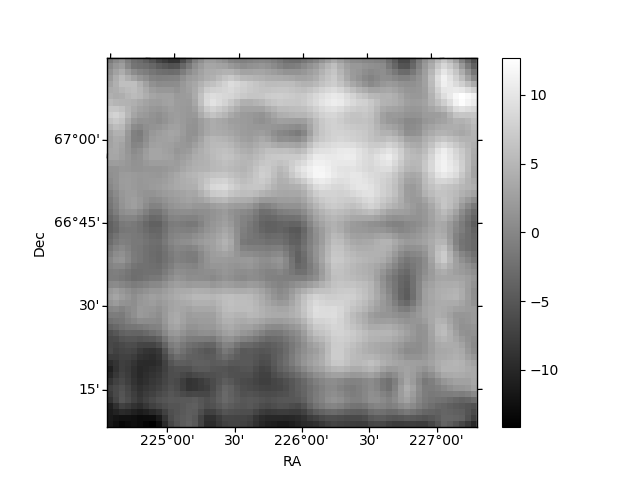
Histogram calculated using DETX and DETY for each event in the final _common_clean file
| Quadrant A | 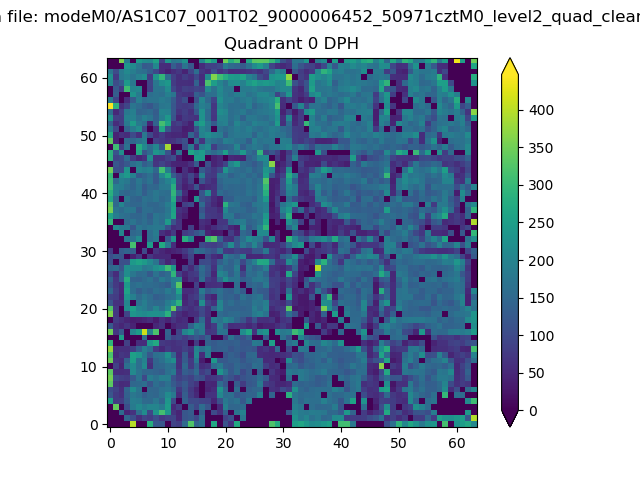 |
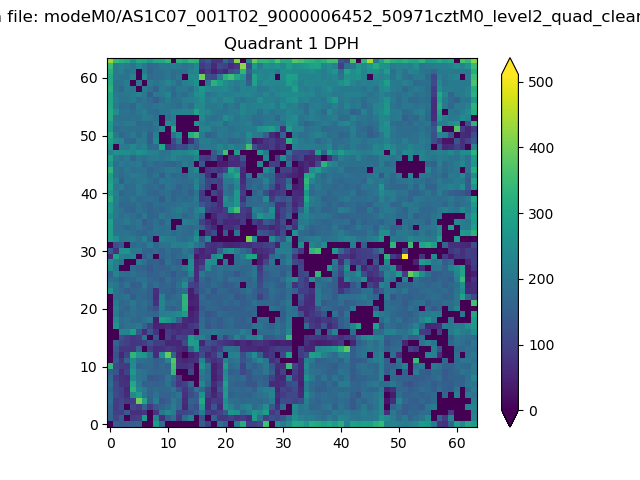 |
Quadrant B |
|---|---|---|---|
| Quadrant D | 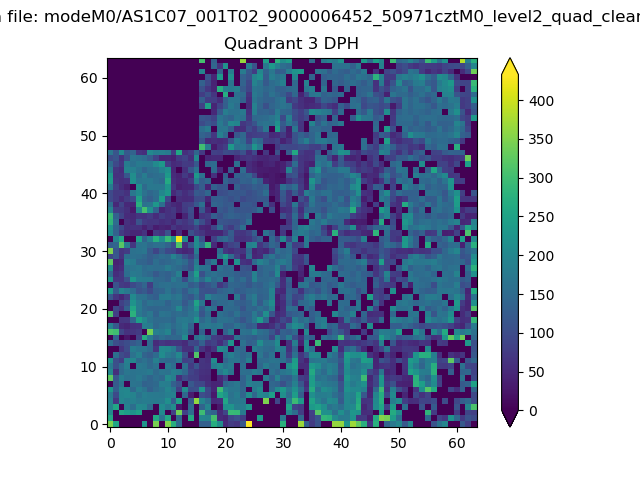 |
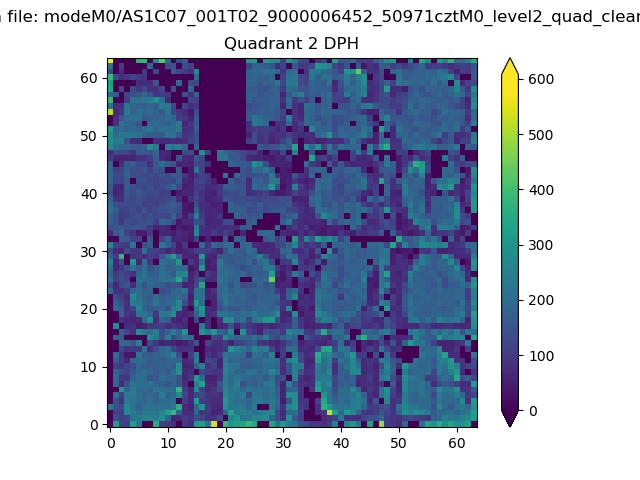 |
Quadrant C |
| Plot type | Count rate plots | Images |
|---|---|---|
| Comparison with Poisson distribution Blue bars denote a histogram of data divided into 1 sec bins. Red curve is a Poisson curve with rate = median count rate of data. |
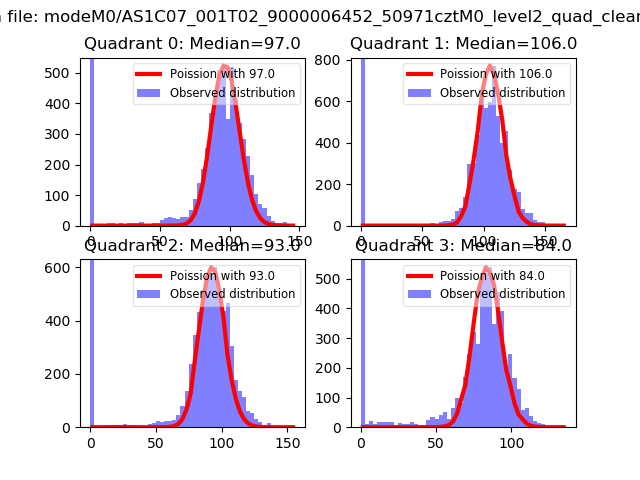 |
 |
| Quadrant-wise count rates Data is divided into 100 sec bins |
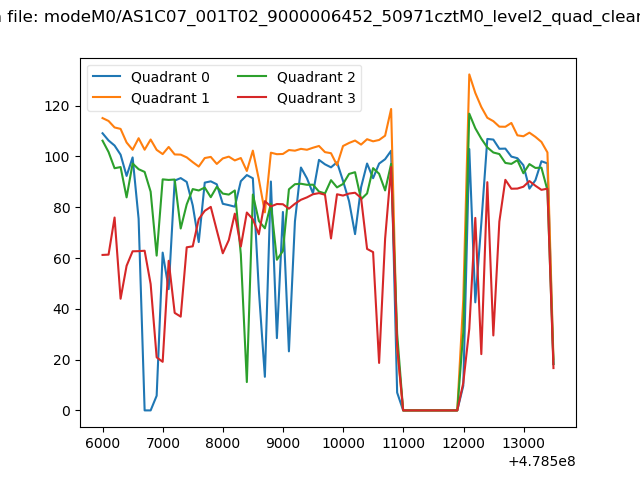 |
|
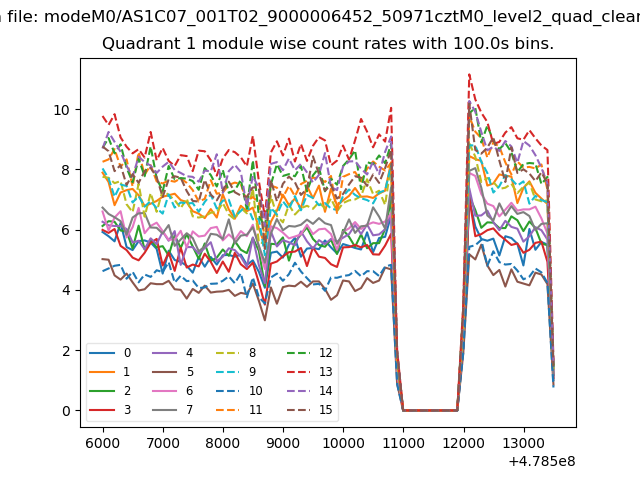
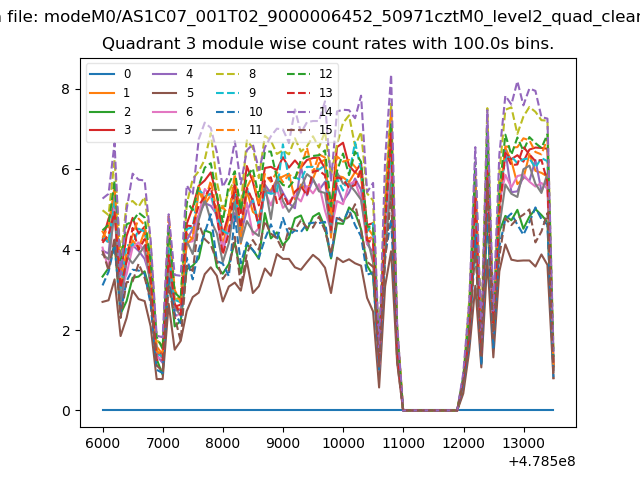
| Module-wise count rates for Quadrant A Data is divided into 100 sec bins |
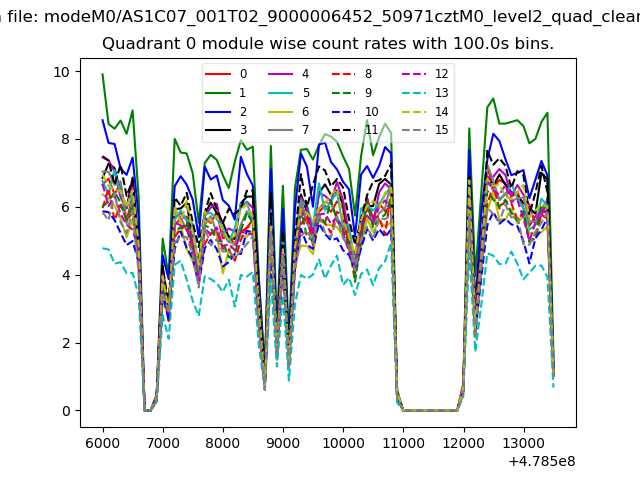 |
 |
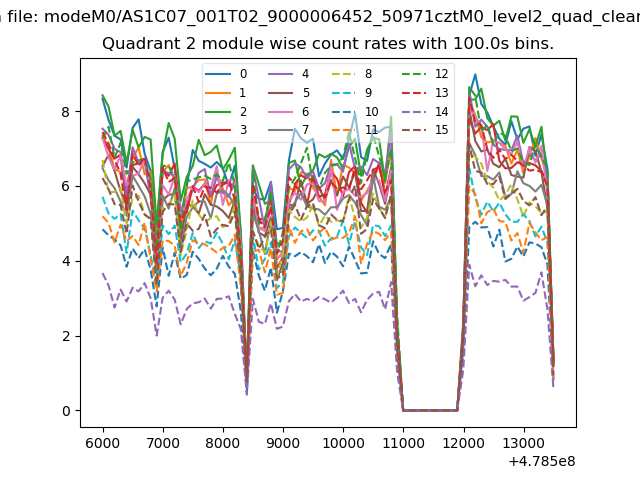
| Module-wise count rates for Quadrant B Data is divided into 100 sec bins |
 |
 |
| Module-wise count rates for Quadrant C Data is divided into 100 sec bins |
 |
 |
| Module-wise count rates for Quadrant D Data is divided into 100 sec bins |
 |
 |
| Parameter | Plot |
|---|---|
| CZT HV Monitor | 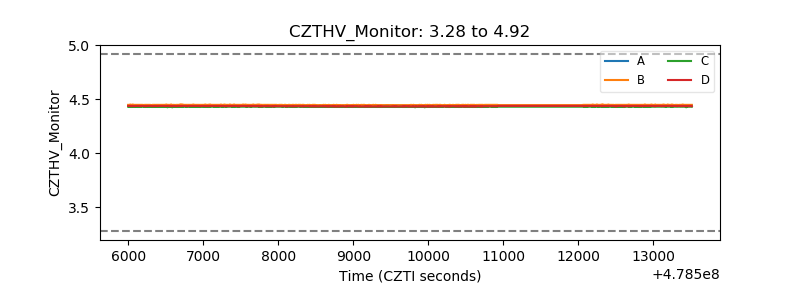 |
| D_VDD | 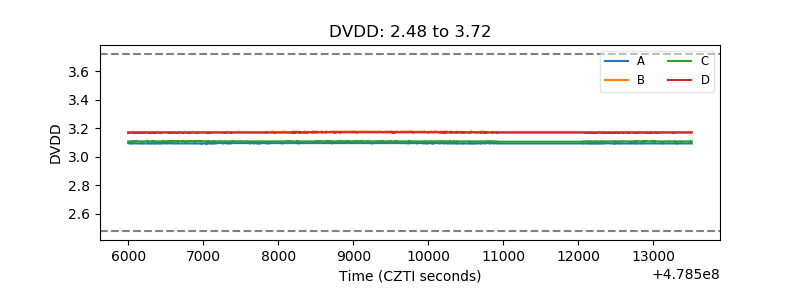 |
| Temperature 1 | 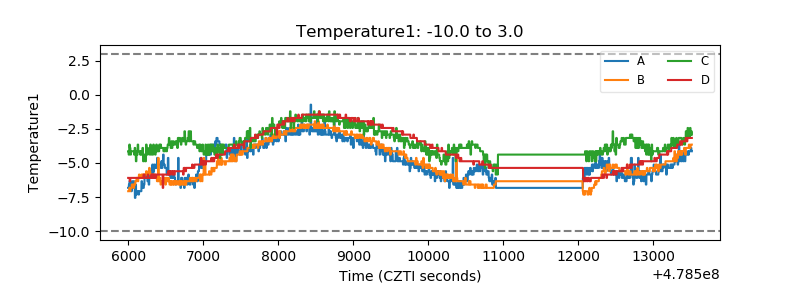 |
| Veto HV Monitor | 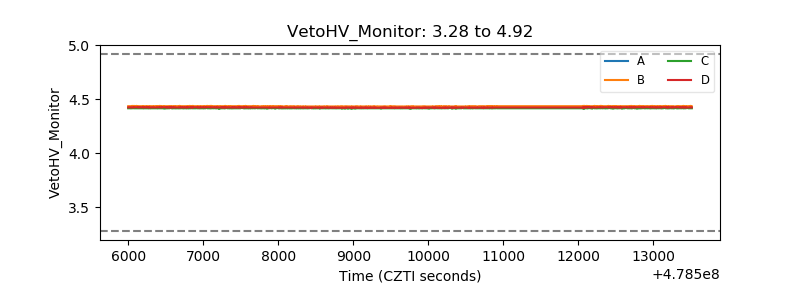 |
| Veto LLD | 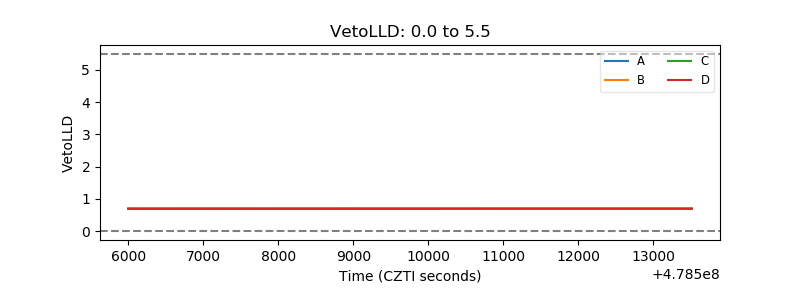 |
| Alpha Counter | 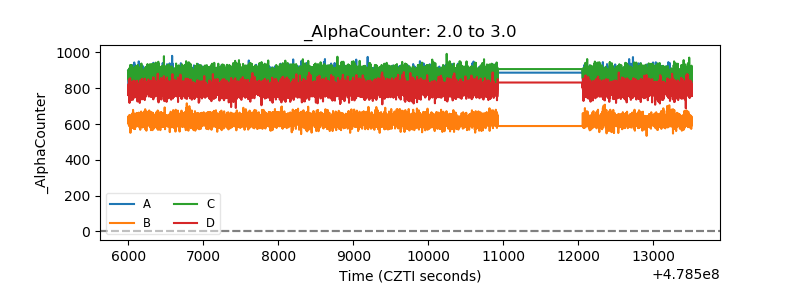 |
| _CPM_Rate | 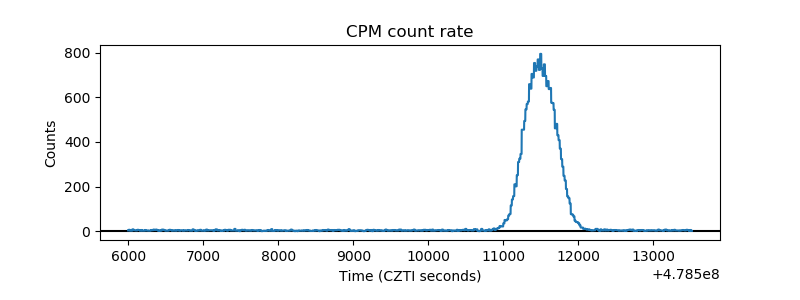 |
| CZT Counter | 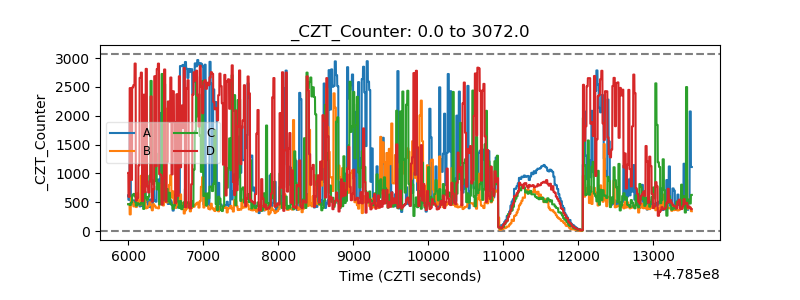 |
| +2.5 Volts monitor | 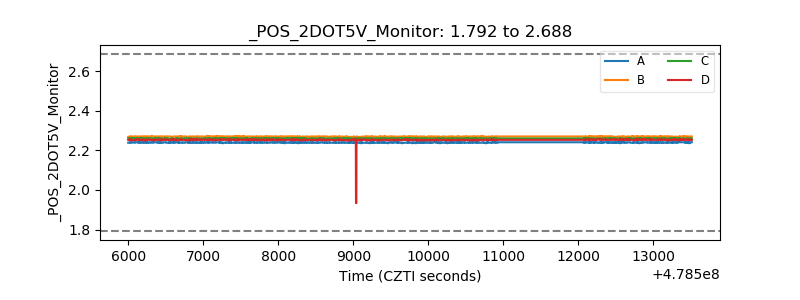 |
| +5 Volts monitor | 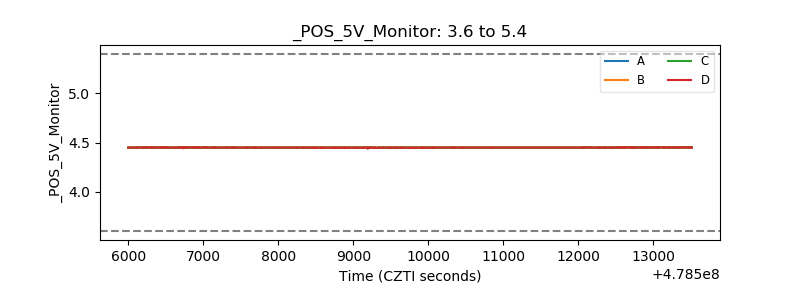 |
| _ROLL_ROT | 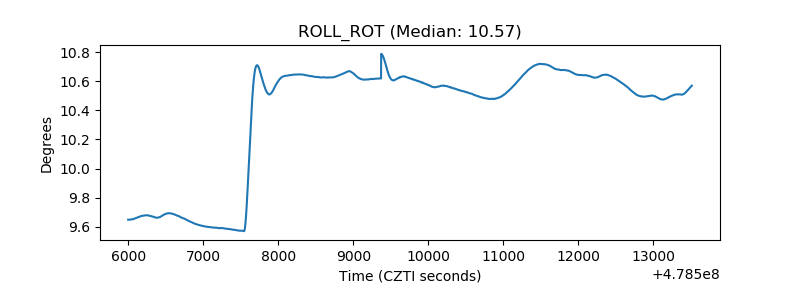 |
| _Roll_DEC | 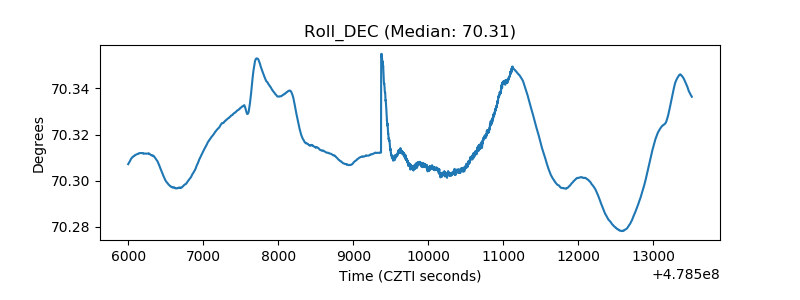 |
| _Roll_RA | 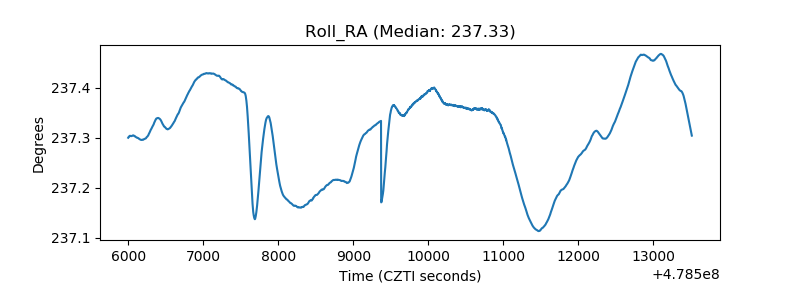 |
| Veto Counter | 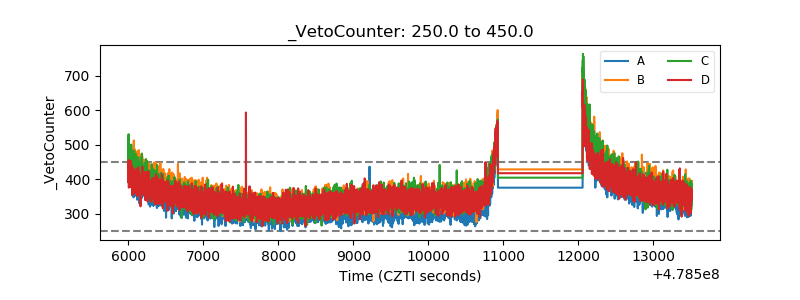 |