| Param | Original file | Final file |
|---|---|---|
| Filename | modeM0/AS1C07_001T02_9000006452_50972cztM0_level2.fits | modeM0/AS1C07_001T02_9000006452_50972cztM0_level2_quad_clean.evt |
| Size (bytes) | 571,913,280 | 86,751,360 |
| Size | 545.4 MB | 82.7 MB |
| Events in quadrant A | 7,316,647 | 484,776 |
| Events in quadrant B | 3,399,529 | 656,435 |
| Events in quadrant C | 4,443,137 | 557,498 |
| Events in quadrant D | 5,530,944 | 496,290 |
| Mode SS | |||
|---|---|---|---|
| Quadrant | BADHDUFLAG | Total packets | Discarded packets |
| A | 0 | 126 | 0 |
| B | 0 | 126 | 0 |
| C | 0 | 126 | 0 |
| D | 0 | 126 | 0 |
| Mode M9 | |||
|---|---|---|---|
| Quadrant | BADHDUFLAG | Total packets | Discarded packets |
| A | 0 | 11 | 0 |
| B | 0 | 11 | 0 |
| C | 0 | 11 | 0 |
| D | 0 | 11 | 0 |
| Mode M0 | |||
|---|---|---|---|
| Quadrant | BADHDUFLAG | Total packets | Discarded packets |
| A | 0 | 25964 | 1 |
| B | 0 | 14507 | 1 |
| C | 0 | 17429 | 1 |
| D | 0 | 20799 | 1 |
| Quadrant | Total seconds | Saturated seconds | Saturation percentage |
|---|---|---|---|
| A | 6186 | 1514 | 24.474620% |
| B | 6185 | 156 | 2.522231% |
| C | 6185 | 377 | 6.095392% |
| D | 6185 | 753 | 12.174616% |
Noise dominated data is calculated using 1-second bins in cleaned event files. If a bin has >2000 counts, and if more than 50% of those come from <1% of pixels, then it is considered to be noise-dominated and hence unusable.
| Quadrant | # 1 sec bins | Bins with >0 counts | Bins with >2000 counts | High rate bins dominated by noise | Noise dominated (total time) | Noise dominated (detector-on time) | Marked lightcurve |
|---|---|---|---|---|---|---|---|
| A | 7321 | 6187 | 1308 | 1308 | 17.87% | 21.14% | 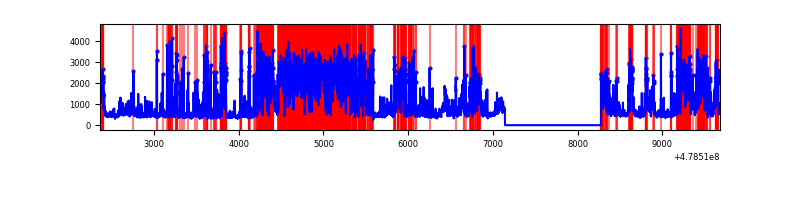 |
| B | 7320 | 6186 | 48 | 48 | 0.66% | 0.78% | 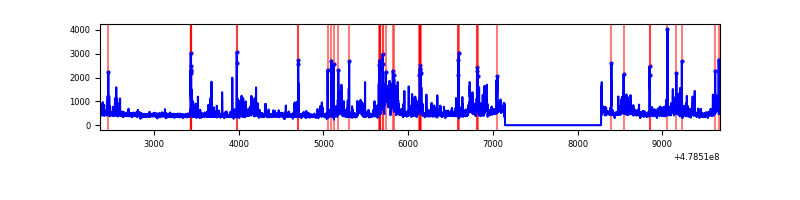 |
| C | 7320 | 6186 | 306 | 306 | 4.18% | 4.95% | 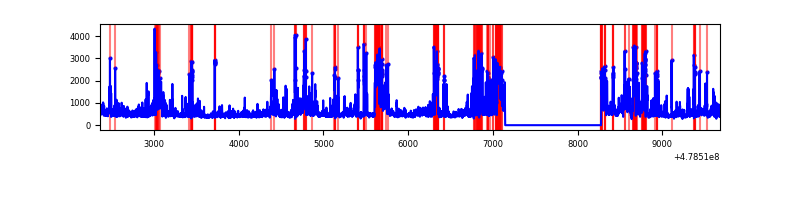 |
| D | 7320 | 6186 | 681 | 681 | 9.30% | 11.01% | 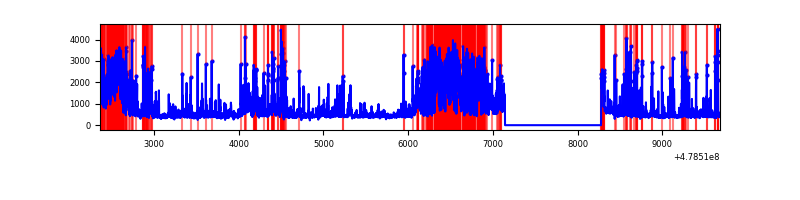 |
Top three noisy pixels from each quadrant. If the there are fewer than three noisy pixels in the level2.evt file, extra rows are filled as -1
| Pixel properties | Quadrant properties | ||||||
|---|---|---|---|---|---|---|---|
| Quadrant | DetID | PixID | Counts | Sigma | Mean | Median | Sigma |
| A | 14 | 254 | 3020835 | 20337.97 | 596 | 582 | 148.5 |
| A | 12 | 80 | 1129169 | 7599.75 | 596 | 582 | 148.5 |
| A | 8 | 43 | 346171 | 2327.15 | 596 | 582 | 148.5 |
| B | 4 | 81 | 241853 | 1759.96 | 653 | 631 | 137.1 |
| B | 12 | 3 | 153872 | 1118.05 | 653 | 631 | 137.1 |
| B | 8 | 128 | 96727 | 701.12 | 653 | 631 | 137.1 |
| C | 15 | 147 | 447243 | 2601.13 | 622 | 615 | 171.7 |
| C | 4 | 12 | 230770 | 1340.41 | 622 | 615 | 171.7 |
| C | 7 | 87 | 211419 | 1227.71 | 622 | 615 | 171.7 |
| D | 8 | 176 | 2019252 | 11655.94 | 610 | 587 | 173.2 |
| D | 2 | 216 | 365824 | 2108.91 | 610 | 587 | 173.2 |
| D | 14 | 178 | 173819 | 1000.25 | 610 | 587 | 173.2 |
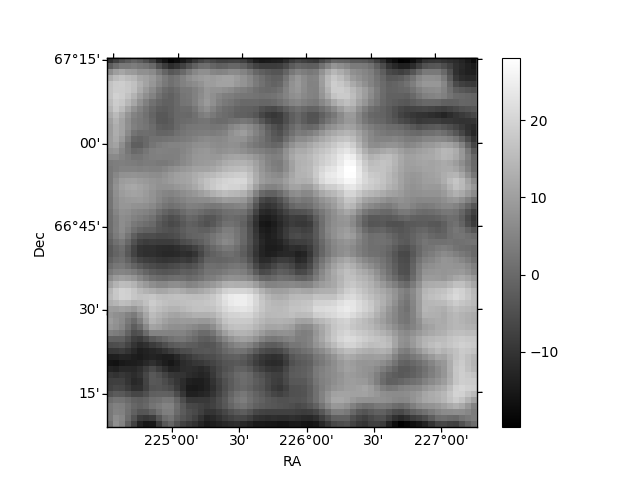
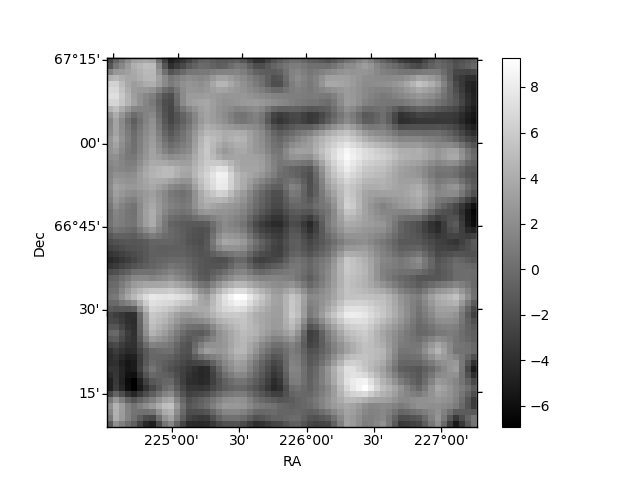
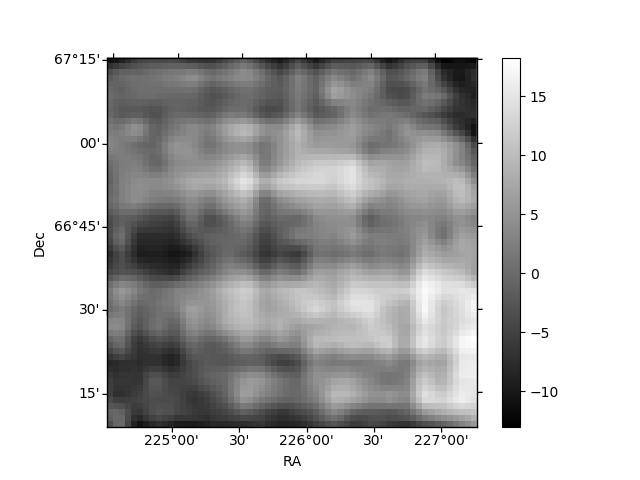
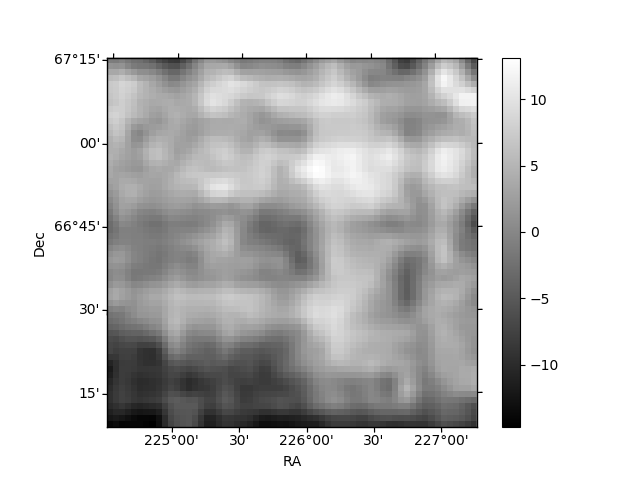
Histogram calculated using DETX and DETY for each event in the final _common_clean file
| Quadrant A | 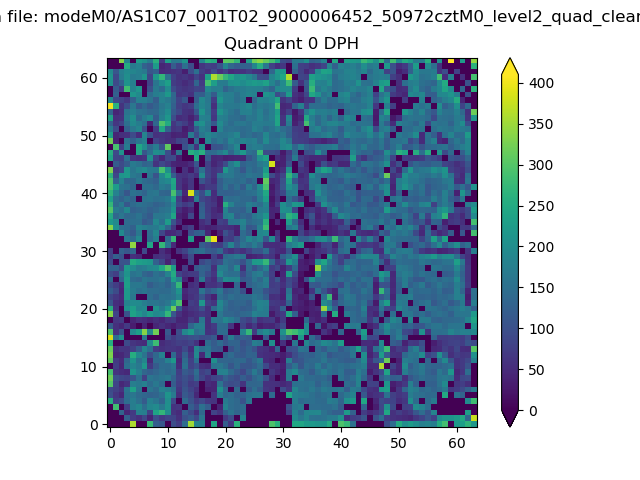 |
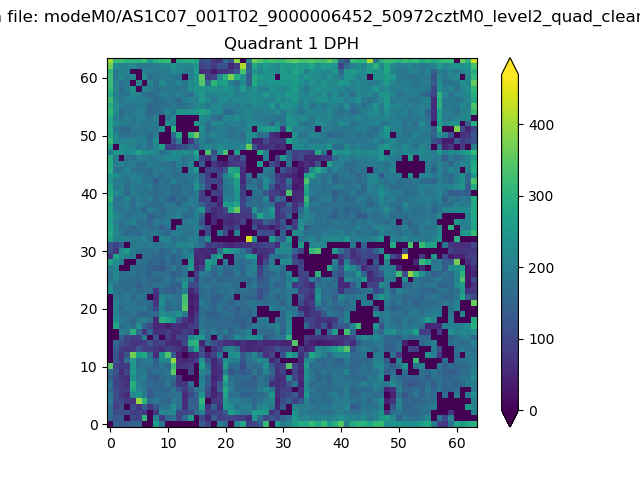 |
Quadrant B |
|---|---|---|---|
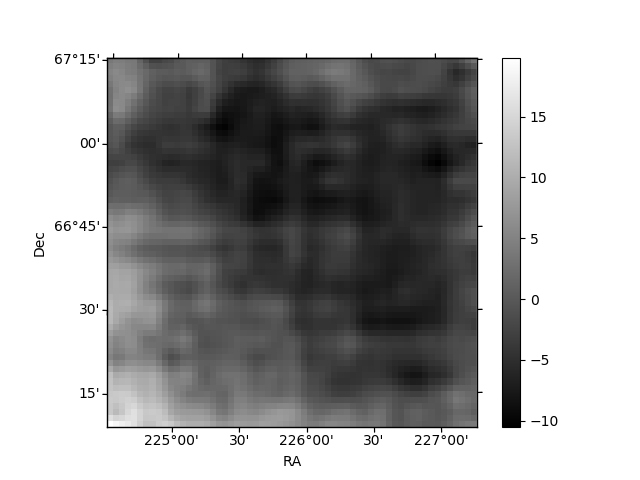
| Quadrant D | 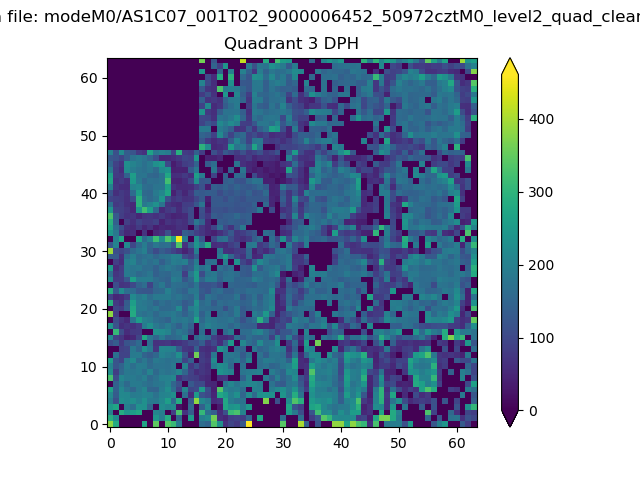 |
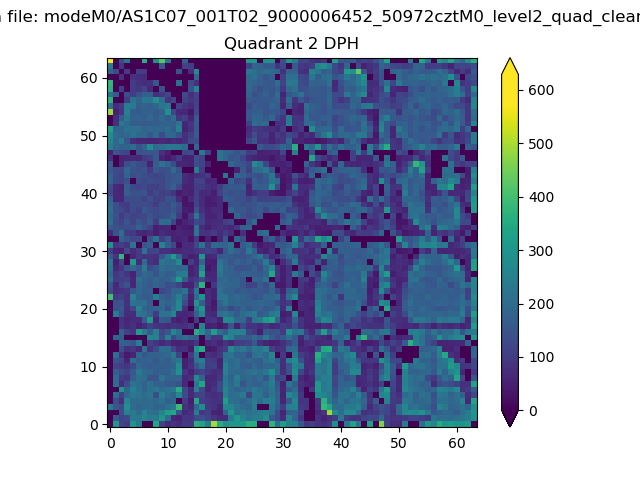 |
Quadrant C |
| Plot type | Count rate plots | Images |
|---|---|---|
| Comparison with Poisson distribution Blue bars denote a histogram of data divided into 1 sec bins. Red curve is a Poisson curve with rate = median count rate of data. |
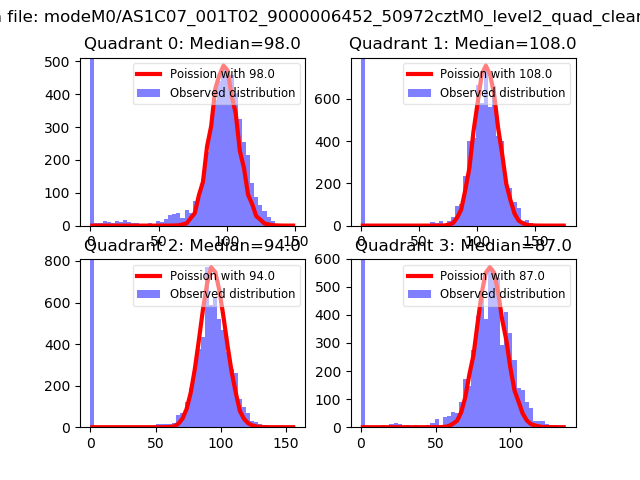 |
 |
| Quadrant-wise count rates Data is divided into 100 sec bins |
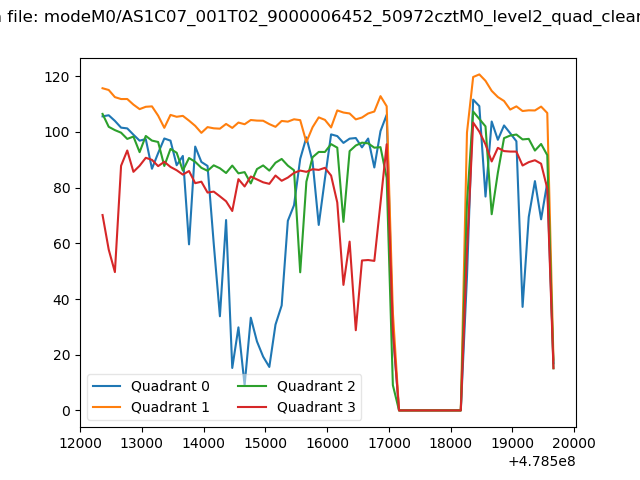 |
|
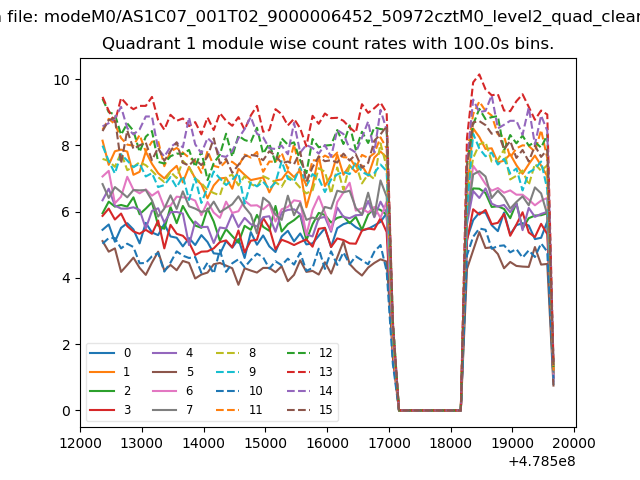
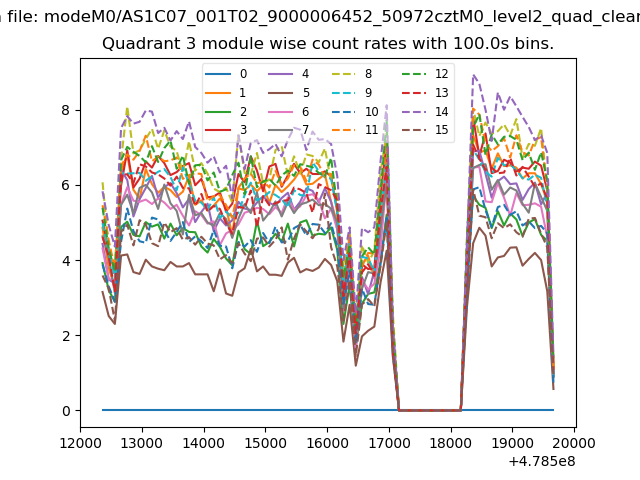
| Module-wise count rates for Quadrant A Data is divided into 100 sec bins |
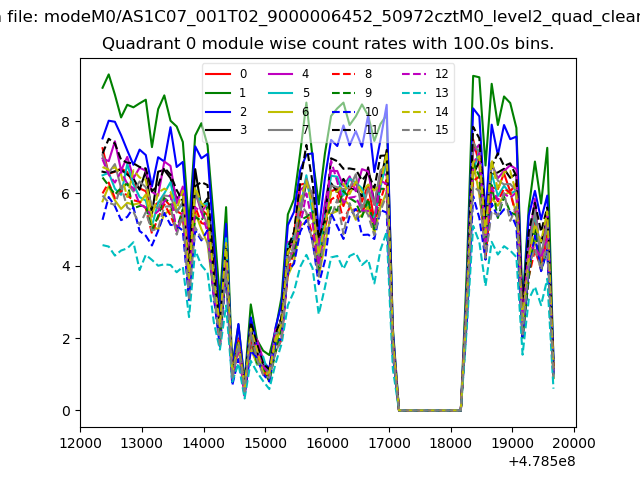 |
 |
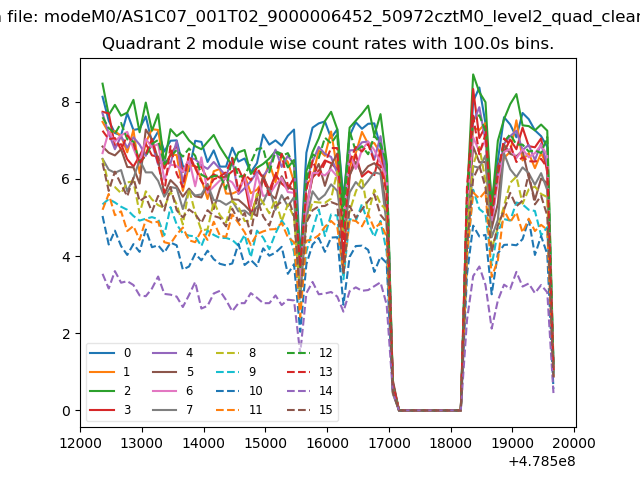
| Module-wise count rates for Quadrant B Data is divided into 100 sec bins |
 |
 |
| Module-wise count rates for Quadrant C Data is divided into 100 sec bins |
 |
 |
| Module-wise count rates for Quadrant D Data is divided into 100 sec bins |
 |
 |
| Parameter | Plot |
|---|---|
| CZT HV Monitor | 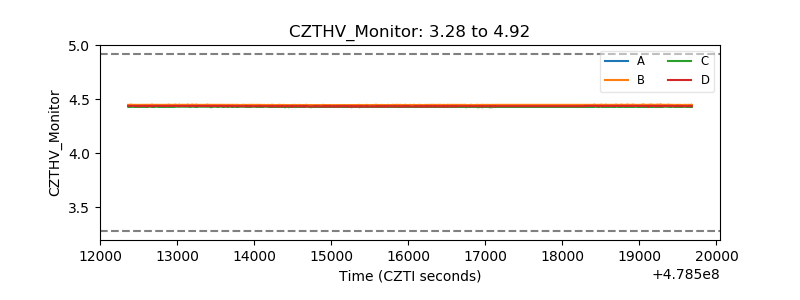 |
| D_VDD | 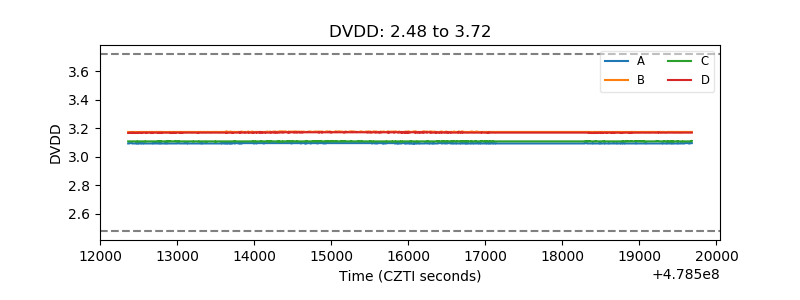 |
| Temperature 1 | 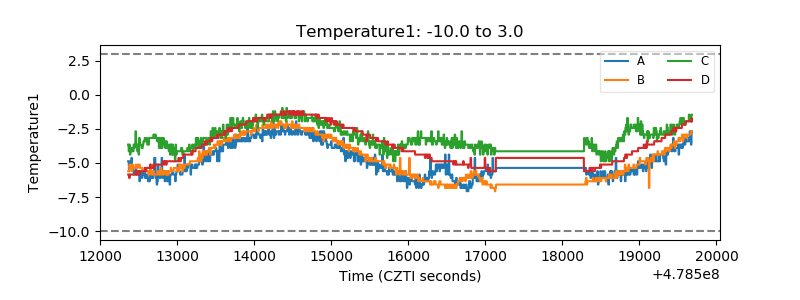 |
| Veto HV Monitor | 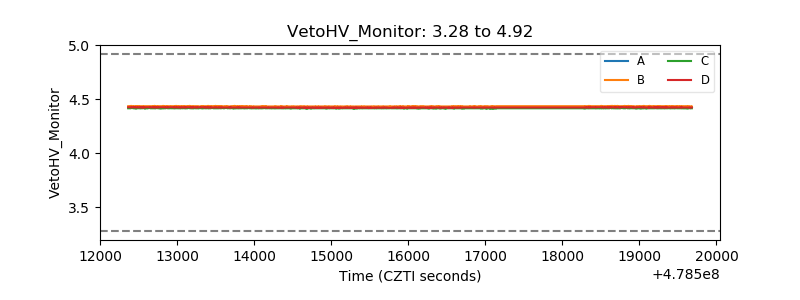 |
| Veto LLD | 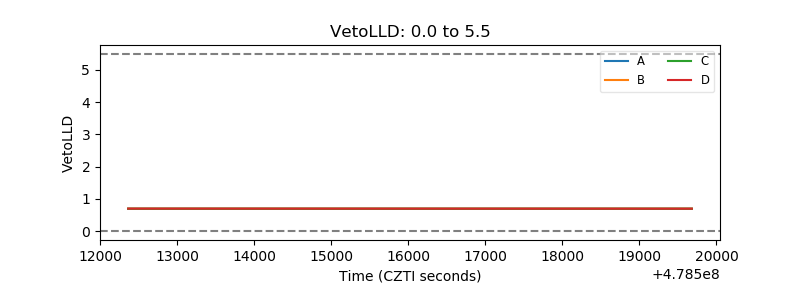 |
| Alpha Counter | 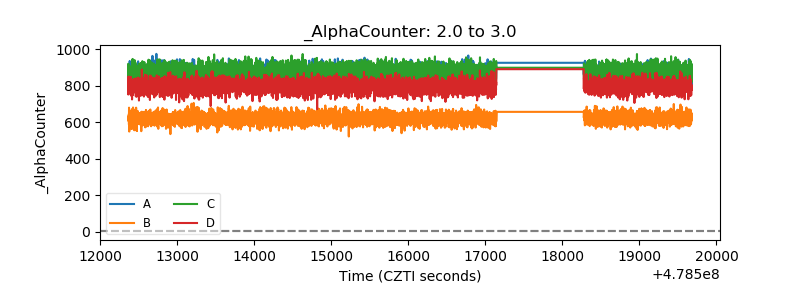 |
| _CPM_Rate | 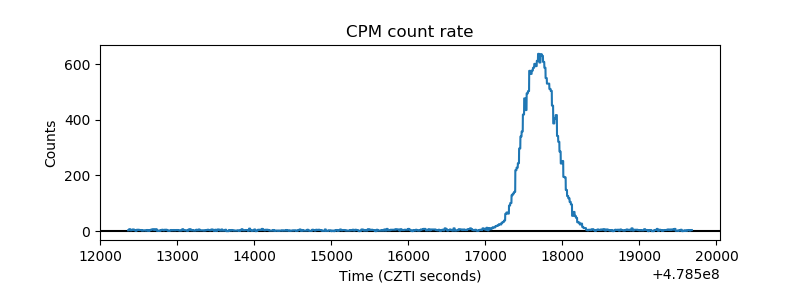 |
| CZT Counter | 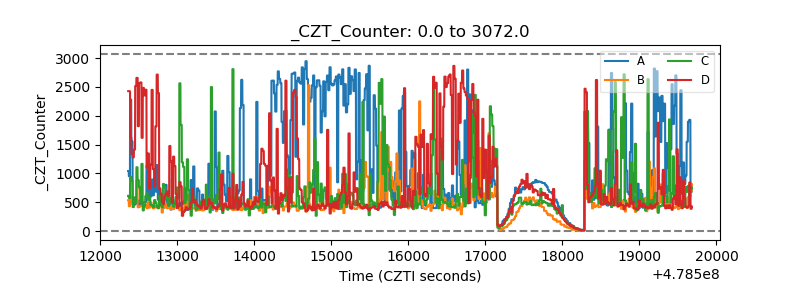 |
| +2.5 Volts monitor | 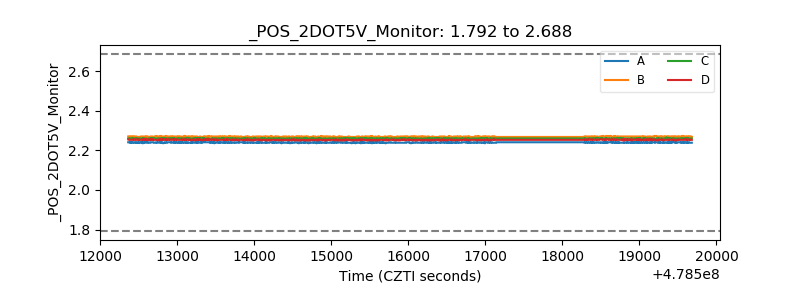 |
| +5 Volts monitor | 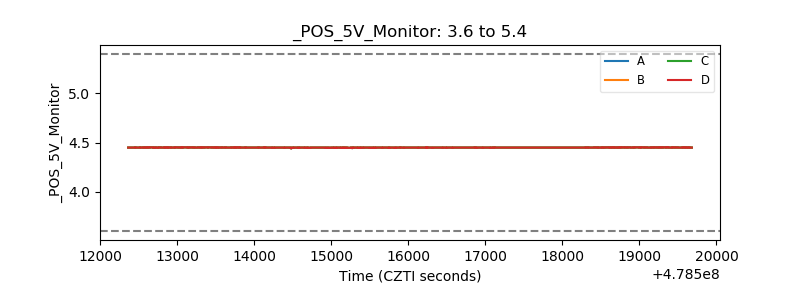 |
| _ROLL_ROT | 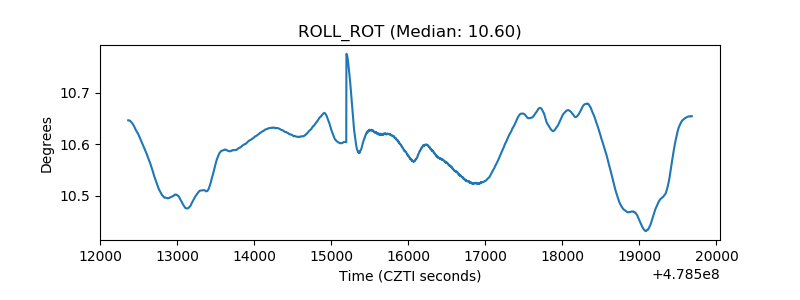 |
| _Roll_DEC | 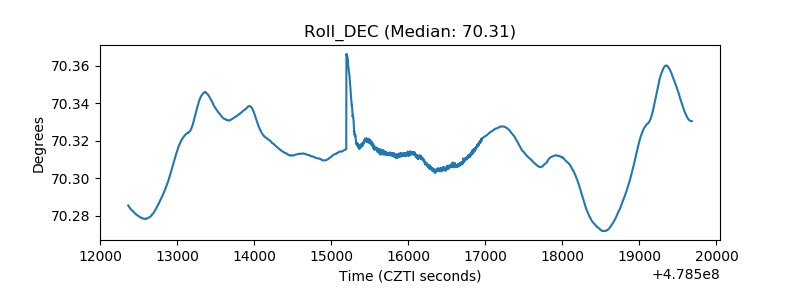 |
| _Roll_RA | 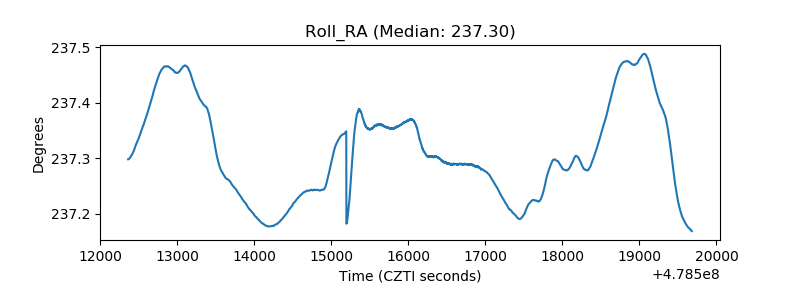 |
| Veto Counter | 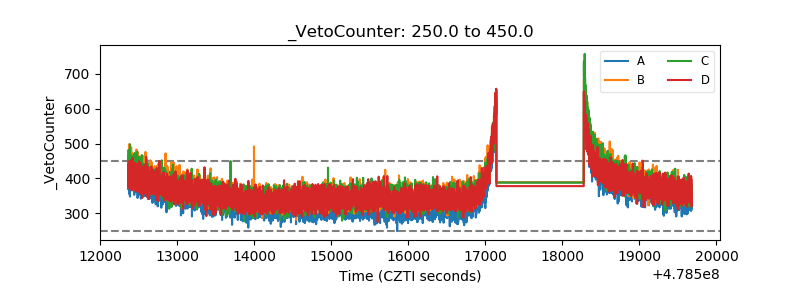 |