| Param | Original file | Final file |
|---|---|---|
| Filename | modeM0/AS1C07_001T02_9000006452_50973cztM0_level2.fits | modeM0/AS1C07_001T02_9000006452_50973cztM0_level2_quad_clean.evt |
| Size (bytes) | 813,689,280 | 79,502,400 |
| Size | 776.0 MB | 75.8 MB |
| Events in quadrant A | 10,569,643 | 385,491 |
| Events in quadrant B | 6,329,121 | 559,143 |
| Events in quadrant C | 4,020,871 | 589,247 |
| Events in quadrant D | 8,701,242 | 423,254 |
| Mode SS | |||
|---|---|---|---|
| Quadrant | BADHDUFLAG | Total packets | Discarded packets |
| A | 0 | 130 | 0 |
| B | 0 | 130 | 0 |
| C | 0 | 130 | 0 |
| D | 0 | 130 | 0 |
| Mode M9 | |||
|---|---|---|---|
| Quadrant | BADHDUFLAG | Total packets | Discarded packets |
| A | 0 | 11 | 0 |
| B | 0 | 11 | 0 |
| C | 0 | 11 | 0 |
| D | 0 | 11 | 0 |
| Mode M0 | |||
|---|---|---|---|
| Quadrant | BADHDUFLAG | Total packets | Discarded packets |
| A | 0 | 35755 | 1 |
| B | 0 | 23242 | 1 |
| C | 0 | 16427 | 1 |
| D | 0 | 30300 | 1 |
| Quadrant | Total seconds | Saturated seconds | Saturation percentage |
|---|---|---|---|
| A | 6452 | 2895 | 44.869808% |
| B | 6453 | 1375 | 21.307919% |
| C | 6453 | 241 | 3.734697% |
| D | 6453 | 1965 | 30.450953% |
Noise dominated data is calculated using 1-second bins in cleaned event files. If a bin has >2000 counts, and if more than 50% of those come from <1% of pixels, then it is considered to be noise-dominated and hence unusable.
| Quadrant | # 1 sec bins | Bins with >0 counts | Bins with >2000 counts | High rate bins dominated by noise | Noise dominated (total time) | Noise dominated (detector-on time) | Marked lightcurve |
|---|---|---|---|---|---|---|---|
| A | 7536 | 6451 | 2533 | 2533 | 33.61% | 39.27% | 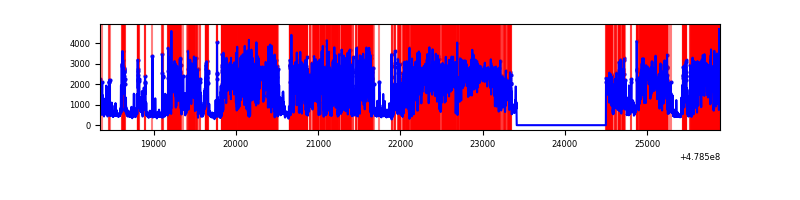 |
| B | 7538 | 6453 | 1050 | 1050 | 13.93% | 16.27% | 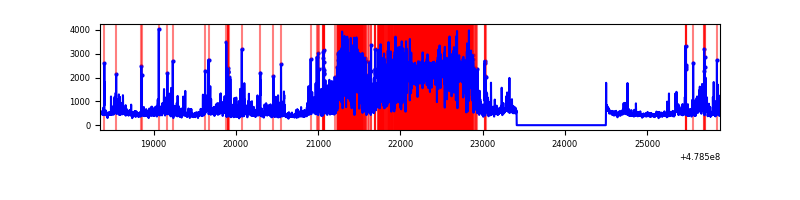 |
| C | 7538 | 6453 | 170 | 170 | 2.26% | 2.63% | 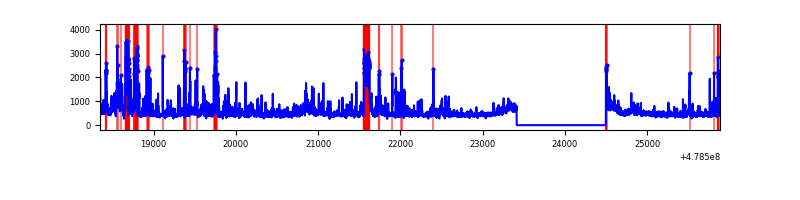 |
| D | 7538 | 6453 | 1784 | 1784 | 23.67% | 27.65% | 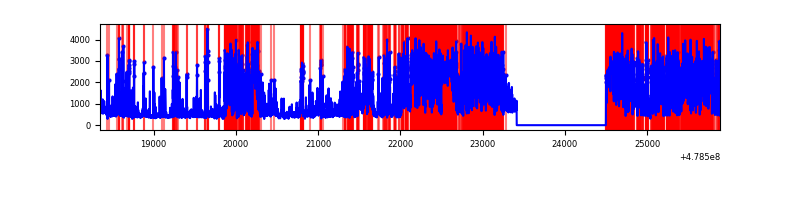 |
Top three noisy pixels from each quadrant. If the there are fewer than three noisy pixels in the level2.evt file, extra rows are filled as -1
| Pixel properties | Quadrant properties | ||||||
|---|---|---|---|---|---|---|---|
| Quadrant | DetID | PixID | Counts | Sigma | Mean | Median | Sigma |
| A | 14 | 254 | 4706762 | 32745.89 | 566 | 551 | 143.7 |
| A | 12 | 80 | 1863264 | 12960.79 | 566 | 551 | 143.7 |
| A | 8 | 43 | 1313109 | 9132.8 | 566 | 551 | 143.7 |
| B | 12 | 3 | 3312900 | 25624.53 | 615 | 597 | 129.3 |
| B | 4 | 81 | 285741 | 2205.92 | 615 | 597 | 129.3 |
| B | 8 | 128 | 58232 | 445.87 | 615 | 597 | 129.3 |
| C | 15 | 147 | 354310 | 1916.92 | 664 | 659 | 184.5 |
| C | 14 | 245 | 245213 | 1325.57 | 664 | 659 | 184.5 |
| C | 4 | 12 | 167990 | 906.99 | 664 | 659 | 184.5 |
| D | 8 | 176 | 5235752 | 31586.21 | 589 | 568 | 165.7 |
| D | 12 | 128 | 281903 | 1697.42 | 589 | 568 | 165.7 |
| D | 2 | 216 | 234350 | 1410.51 | 589 | 568 | 165.7 |
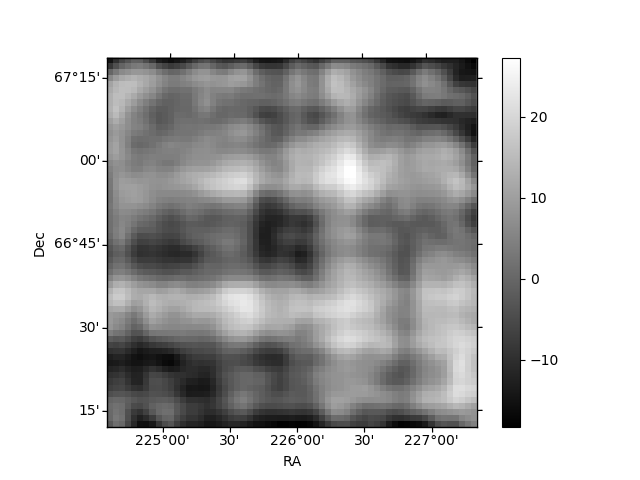
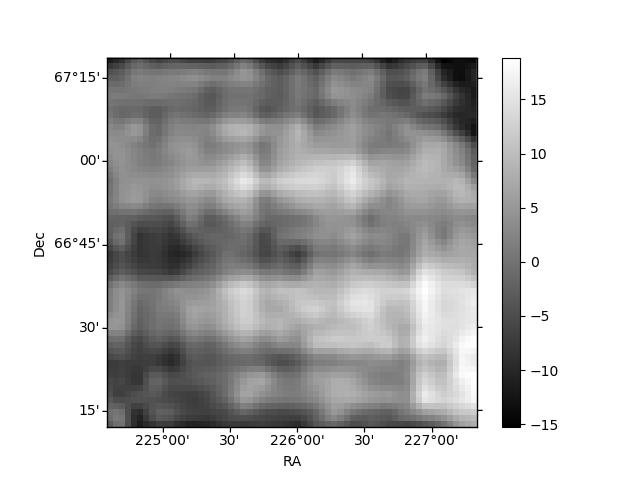
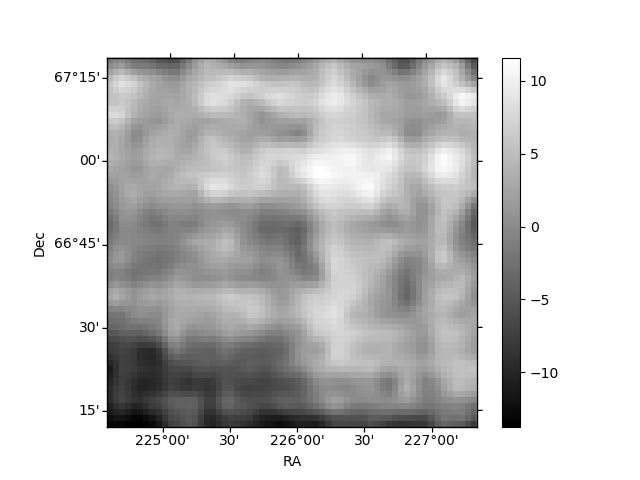
Histogram calculated using DETX and DETY for each event in the final _common_clean file
| Quadrant A | 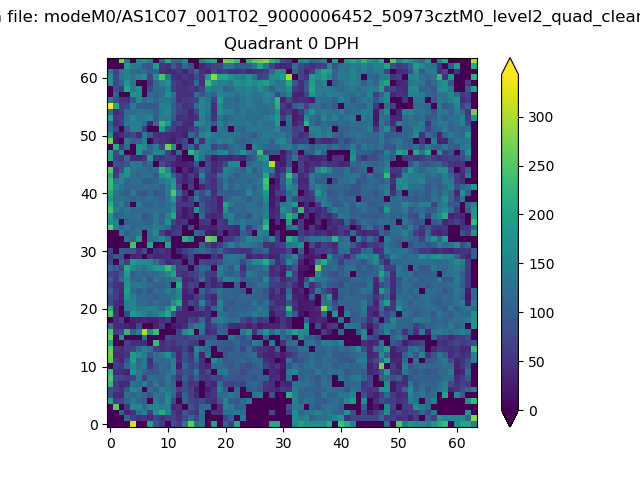 |
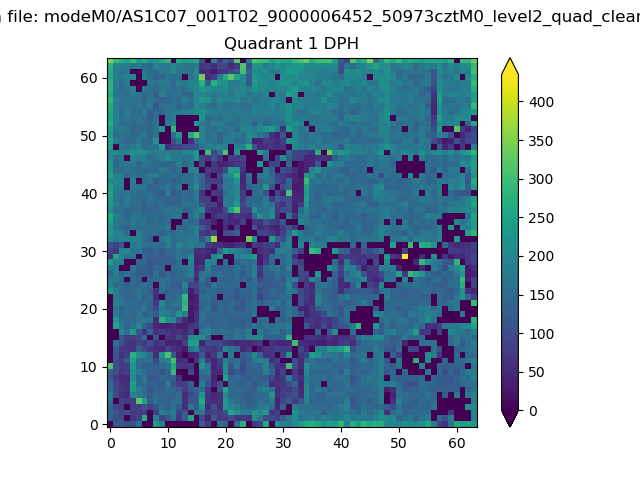 |
Quadrant B |
|---|---|---|---|
| Quadrant D | 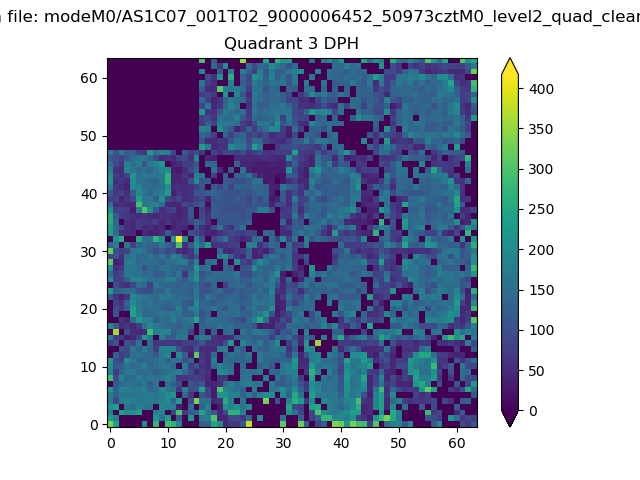 |
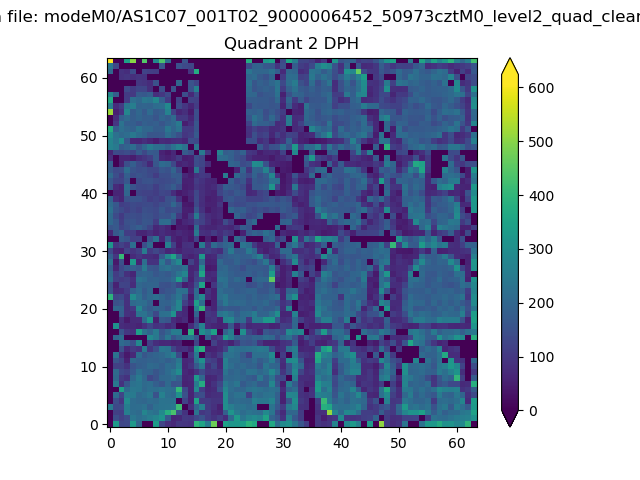 |
Quadrant C |
| Plot type | Count rate plots | Images |
|---|---|---|
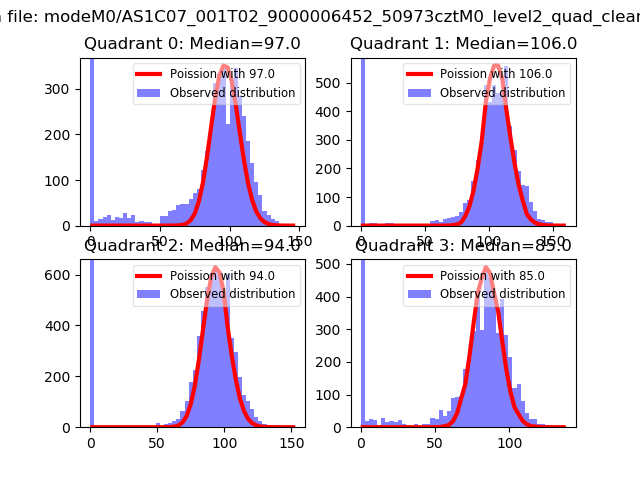
| Comparison with Poisson distribution Blue bars denote a histogram of data divided into 1 sec bins. Red curve is a Poisson curve with rate = median count rate of data. |
 |
 |
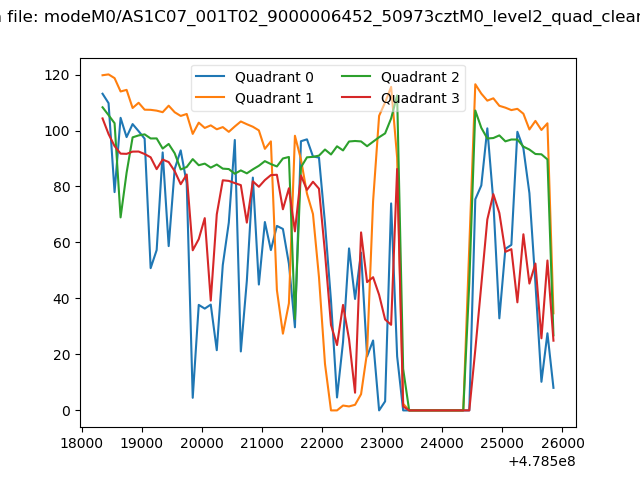
| Quadrant-wise count rates Data is divided into 100 sec bins |
 |
|
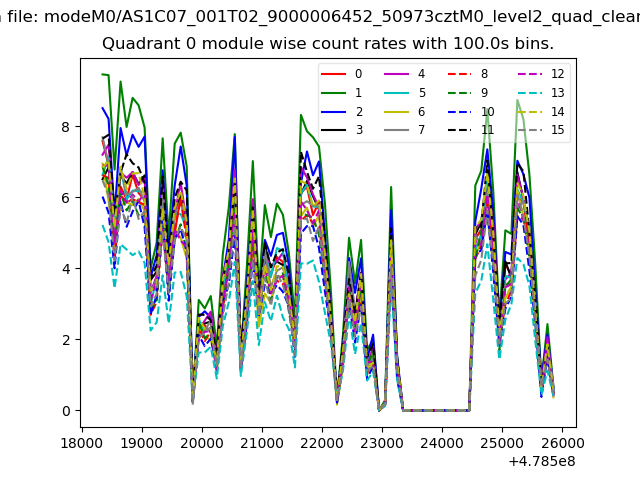
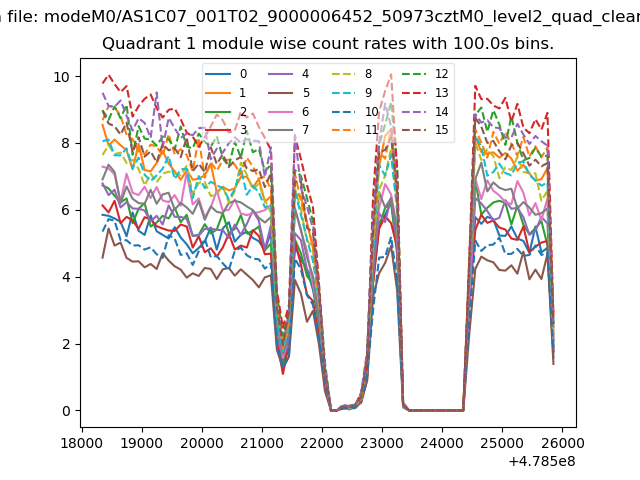
| Module-wise count rates for Quadrant A Data is divided into 100 sec bins |
 |
 |
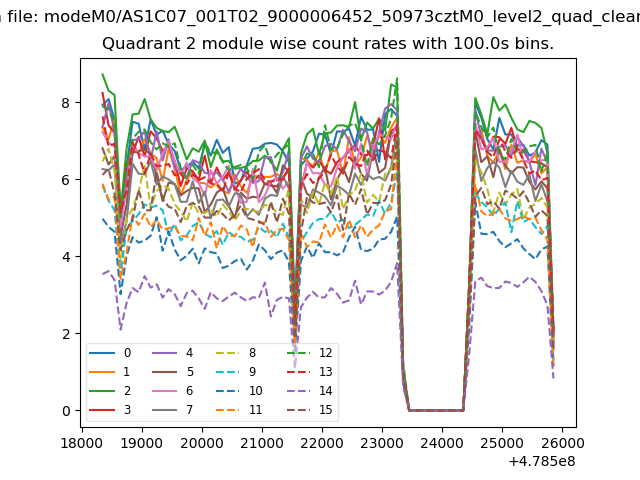
| Module-wise count rates for Quadrant B Data is divided into 100 sec bins |
 |
 |
| Module-wise count rates for Quadrant C Data is divided into 100 sec bins |
 |
 |
| Module-wise count rates for Quadrant D Data is divided into 100 sec bins |
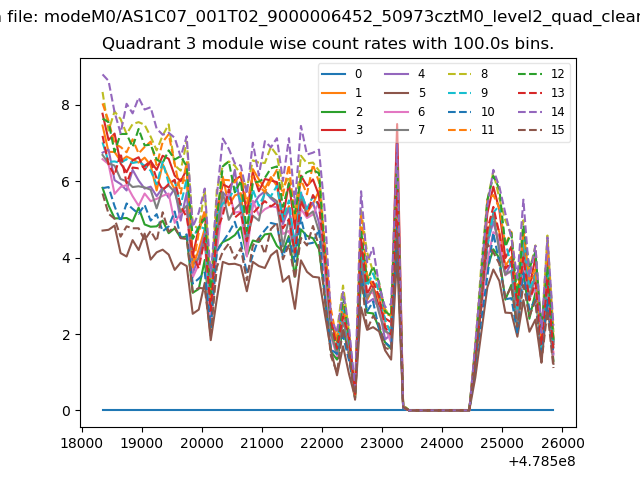 |
 |
| Parameter | Plot |
|---|---|
| CZT HV Monitor | 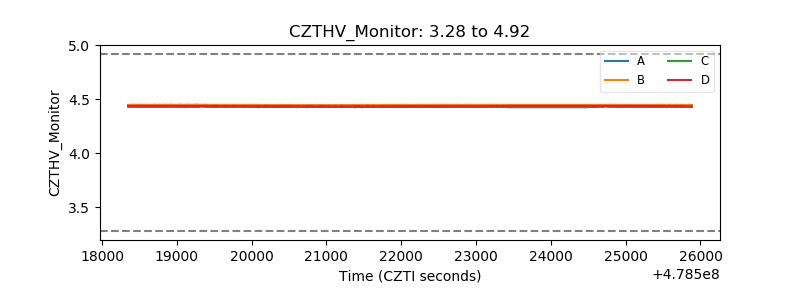 |
| D_VDD | 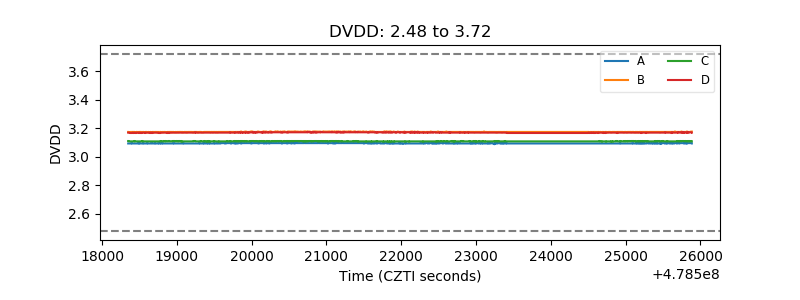 |
| Temperature 1 | 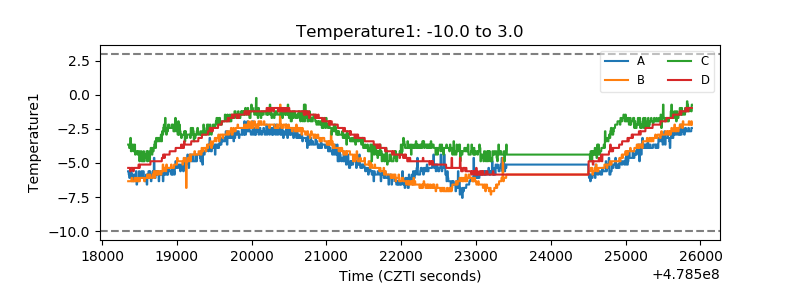 |
| Veto HV Monitor | 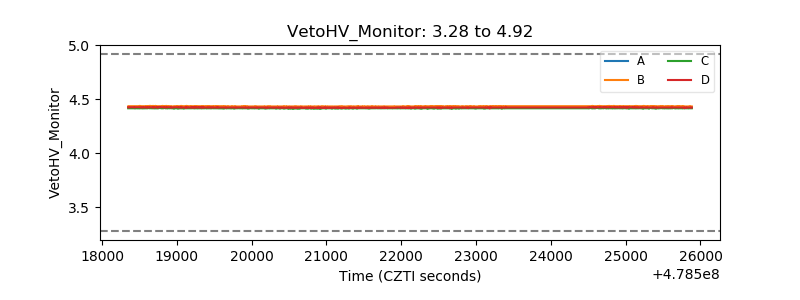 |
| Veto LLD | 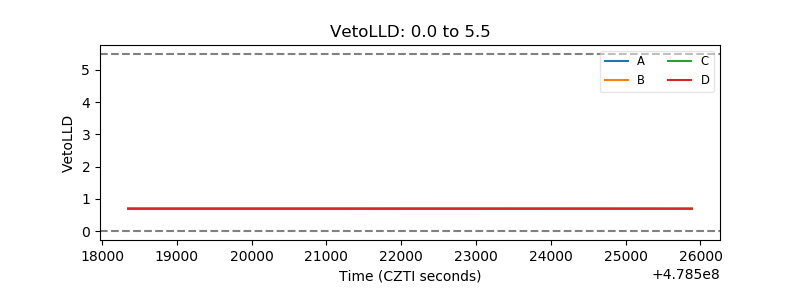 |
| Alpha Counter | 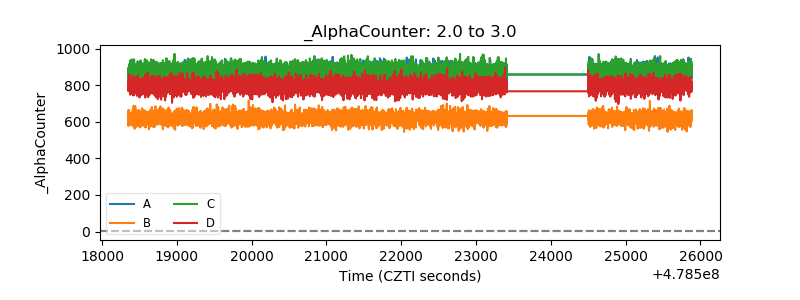 |
| _CPM_Rate | 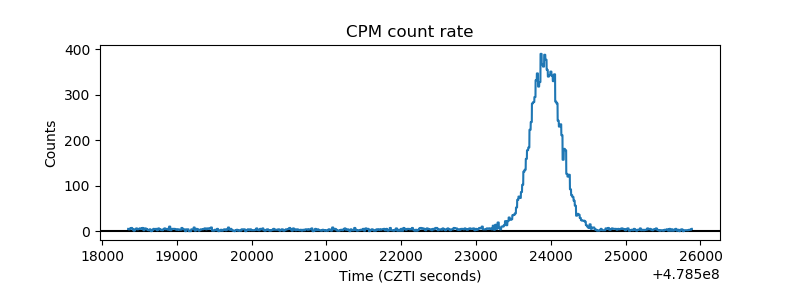 |
| CZT Counter | 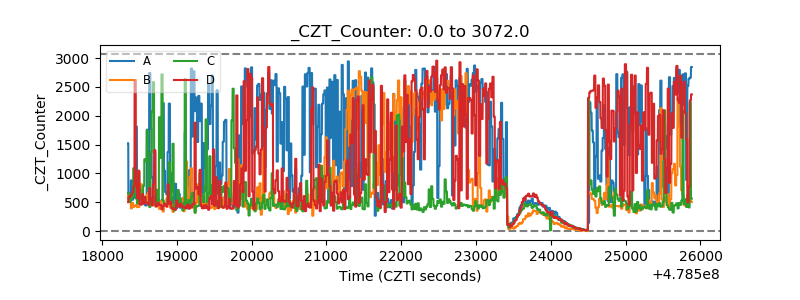 |
| +2.5 Volts monitor | 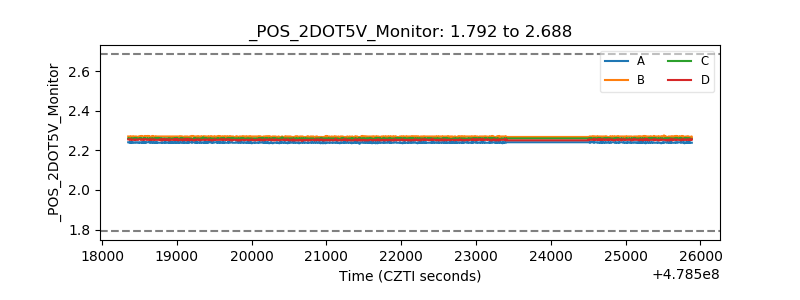 |
| +5 Volts monitor | 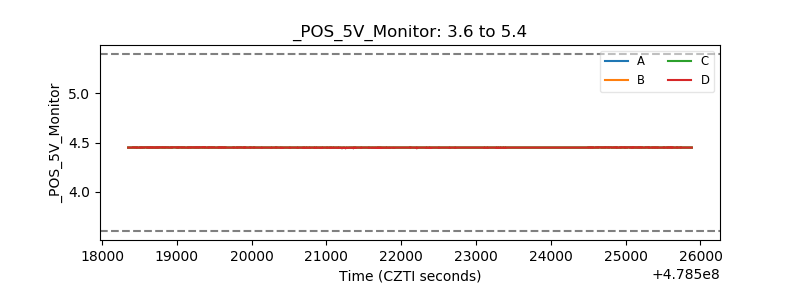 |
| _ROLL_ROT | 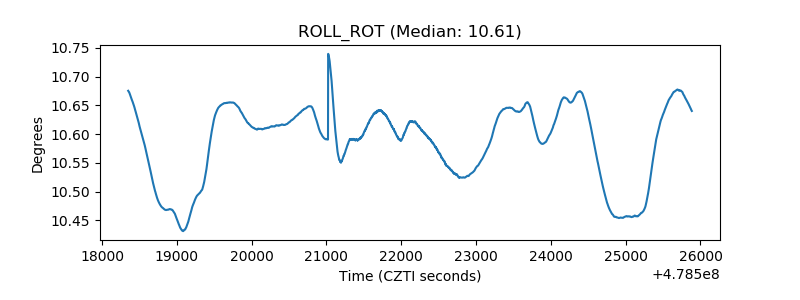 |
| _Roll_DEC | 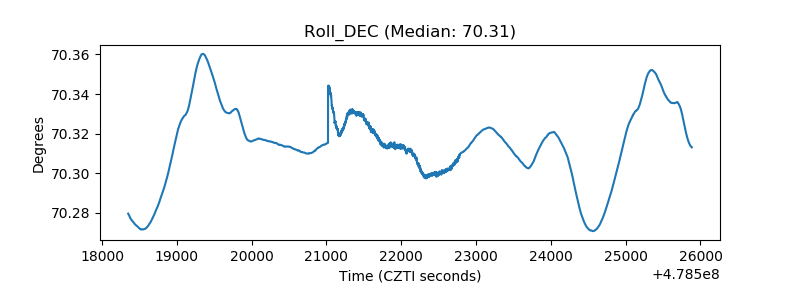 |
| _Roll_RA | 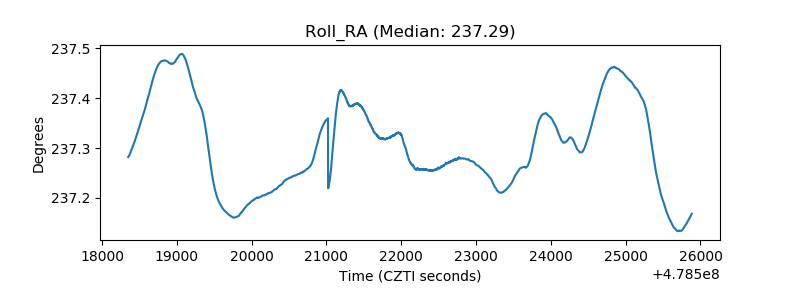 |
| Veto Counter | 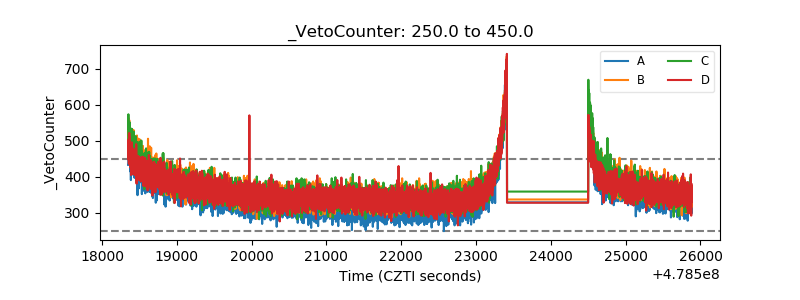 |