| Param | Original file | Final file |
|---|---|---|
| Filename | modeM0/AS1C07_001T02_9000006452_50974cztM0_level2.fits | modeM0/AS1C07_001T02_9000006452_50974cztM0_level2_quad_clean.evt |
| Size (bytes) | 789,356,160 | 84,133,440 |
| Size | 752.8 MB | 80.2 MB |
| Events in quadrant A | 12,800,396 | 297,970 |
| Events in quadrant B | 4,082,300 | 688,016 |
| Events in quadrant C | 4,494,268 | 593,899 |
| Events in quadrant D | 7,315,952 | 493,732 |
| Mode SS | |||
|---|---|---|---|
| Quadrant | BADHDUFLAG | Total packets | Discarded packets |
| A | 0 | 138 | 0 |
| B | 0 | 138 | 0 |
| C | 0 | 138 | 0 |
| D | 0 | 138 | 0 |
| Mode M9 | |||
|---|---|---|---|
| Quadrant | BADHDUFLAG | Total packets | Discarded packets |
| A | 0 | 9 | 0 |
| B | 0 | 9 | 0 |
| C | 0 | 9 | 0 |
| D | 0 | 9 | 0 |
| Mode M0 | |||
|---|---|---|---|
| Quadrant | BADHDUFLAG | Total packets | Discarded packets |
| A | 0 | 42637 | 1 |
| B | 0 | 17005 | 1 |
| C | 0 | 18037 | 1 |
| D | 0 | 26418 | 1 |
| Quadrant | Total seconds | Saturated seconds | Saturation percentage |
|---|---|---|---|
| A | 6793 | 4053 | 59.664360% |
| B | 6794 | 271 | 3.988814% |
| C | 6794 | 384 | 5.652046% |
| D | 6794 | 1217 | 17.912864% |
Noise dominated data is calculated using 1-second bins in cleaned event files. If a bin has >2000 counts, and if more than 50% of those come from <1% of pixels, then it is considered to be noise-dominated and hence unusable.
| Quadrant | # 1 sec bins | Bins with >0 counts | Bins with >2000 counts | High rate bins dominated by noise | Noise dominated (total time) | Noise dominated (detector-on time) | Marked lightcurve |
|---|---|---|---|---|---|---|---|
| A | 7717 | 6792 | 3531 | 3531 | 45.76% | 51.99% | 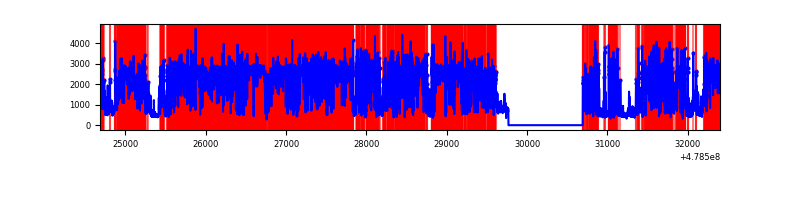 |
| B | 7719 | 6794 | 86 | 86 | 1.11% | 1.27% | 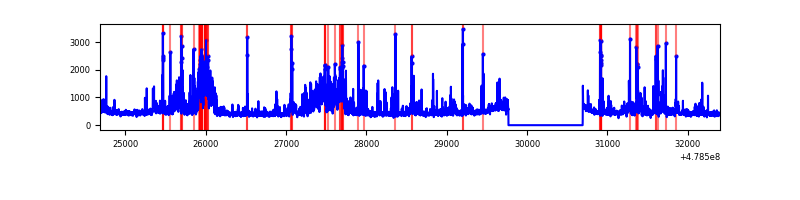 |
| C | 7719 | 6794 | 253 | 253 | 3.28% | 3.72% | 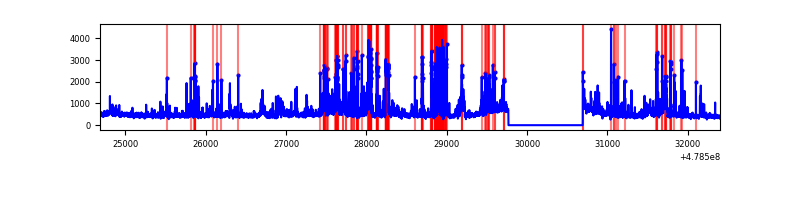 |
| D | 7719 | 6794 | 1015 | 1015 | 13.15% | 14.94% | 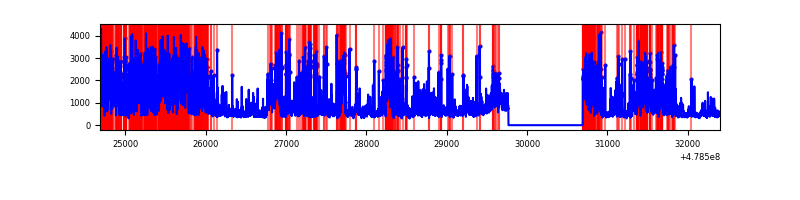 |
Top three noisy pixels from each quadrant. If the there are fewer than three noisy pixels in the level2.evt file, extra rows are filled as -1
| Pixel properties | Quadrant properties | ||||||
|---|---|---|---|---|---|---|---|
| Quadrant | DetID | PixID | Counts | Sigma | Mean | Median | Sigma |
| A | 14 | 254 | 8585361 | 68916.2 | 489 | 475 | 124.6 |
| A | 8 | 43 | 1168807 | 9378.92 | 489 | 475 | 124.6 |
| A | 12 | 80 | 505440 | 4053.67 | 489 | 475 | 124.6 |
| B | 4 | 81 | 833011 | 5521.71 | 711 | 685 | 150.7 |
| B | 7 | 252 | 64118 | 420.82 | 711 | 685 | 150.7 |
| B | 8 | 128 | 57956 | 379.94 | 711 | 685 | 150.7 |
| C | 15 | 147 | 486557 | 2523.64 | 691 | 684 | 192.5 |
| C | 13 | 3 | 355444 | 1842.63 | 691 | 684 | 192.5 |
| C | 14 | 245 | 167465 | 866.26 | 691 | 684 | 192.5 |
| D | 8 | 176 | 3072774 | 16664.34 | 657 | 634 | 184.4 |
| D | 8 | 208 | 389248 | 2107.98 | 657 | 634 | 184.4 |
| D | 10 | 181 | 319353 | 1728.84 | 657 | 634 | 184.4 |
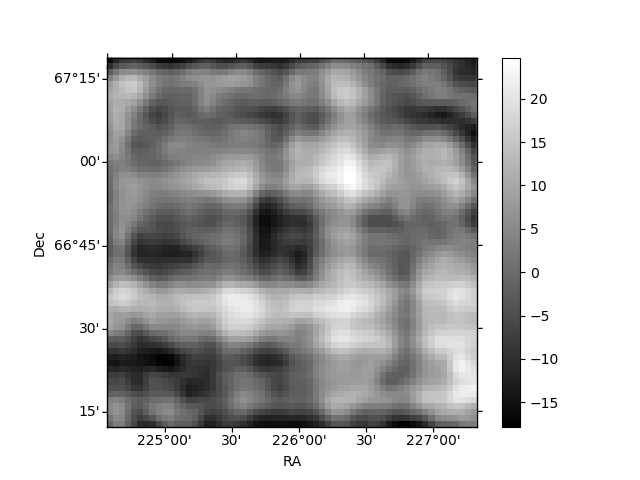
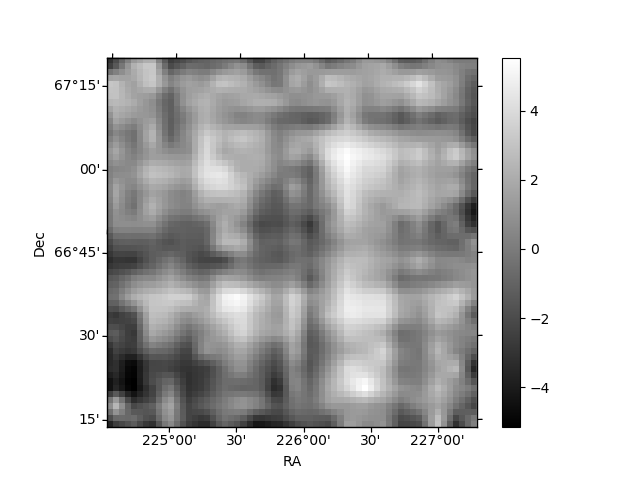
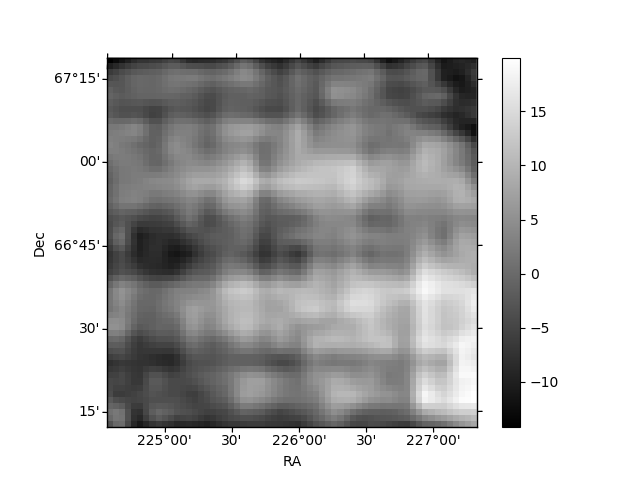
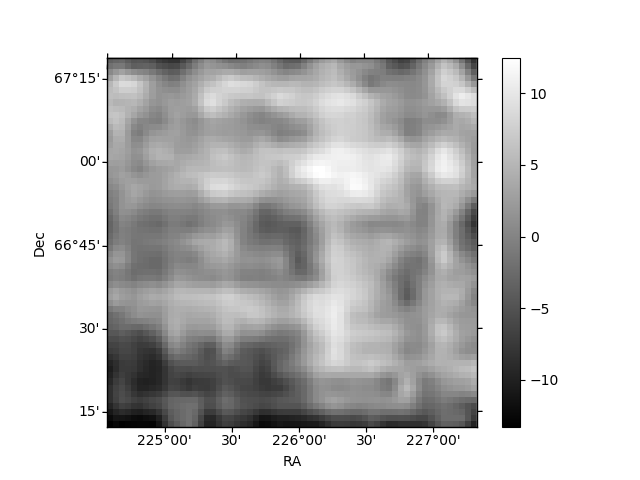
Histogram calculated using DETX and DETY for each event in the final _common_clean file
| Quadrant A | 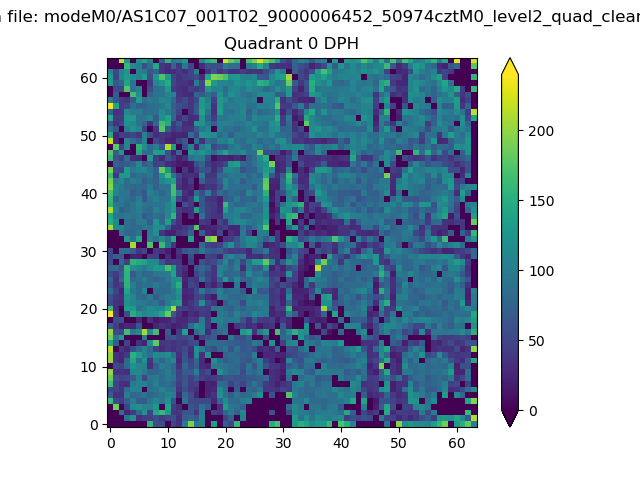 |
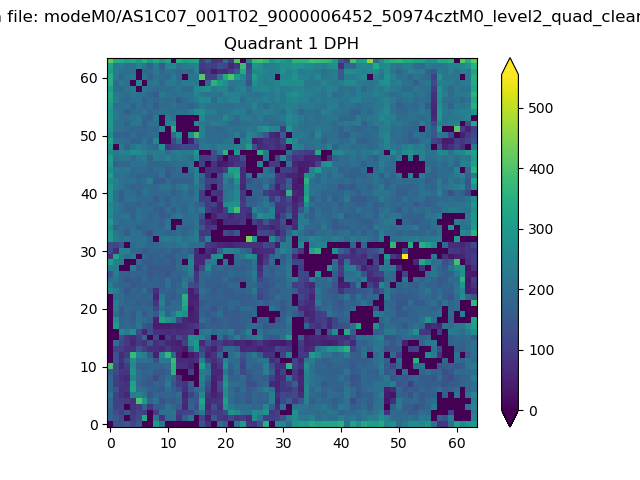 |
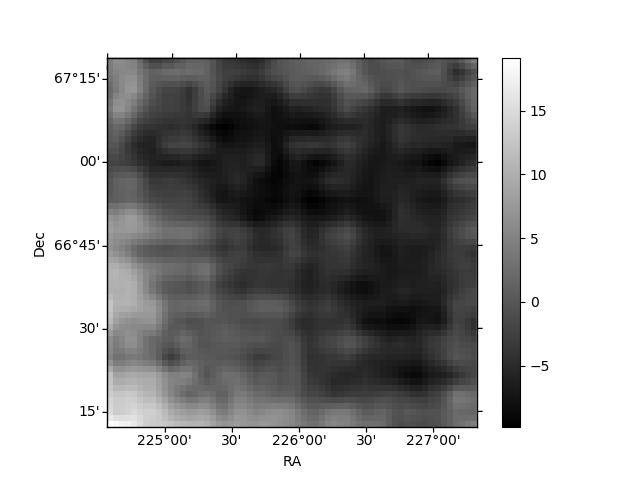
Quadrant B |
|---|---|---|---|
| Quadrant D | 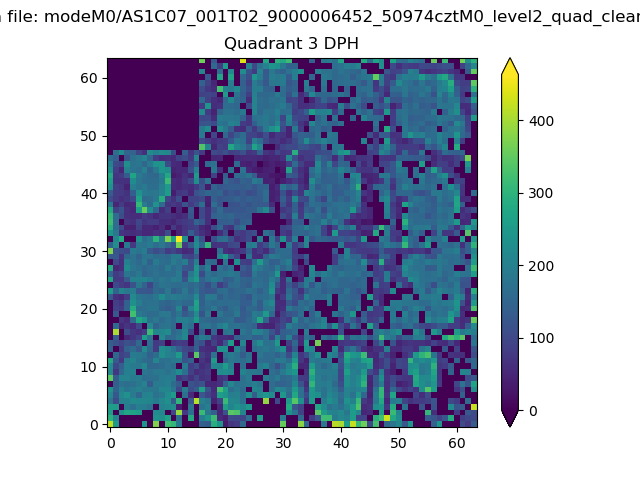 |
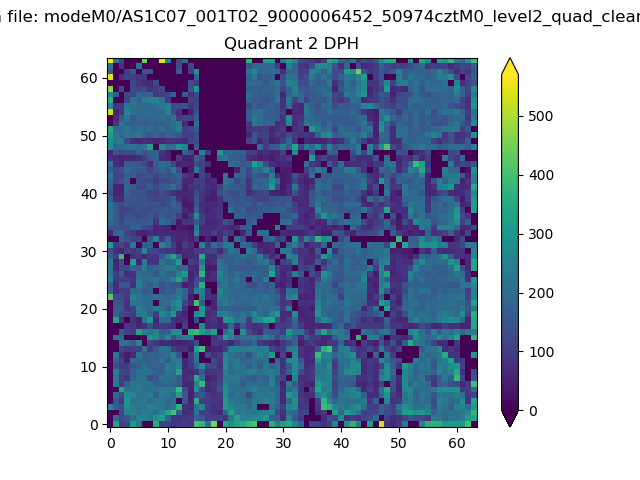 |
Quadrant C |
| Plot type | Count rate plots | Images |
|---|---|---|
| Comparison with Poisson distribution Blue bars denote a histogram of data divided into 1 sec bins. Red curve is a Poisson curve with rate = median count rate of data. |
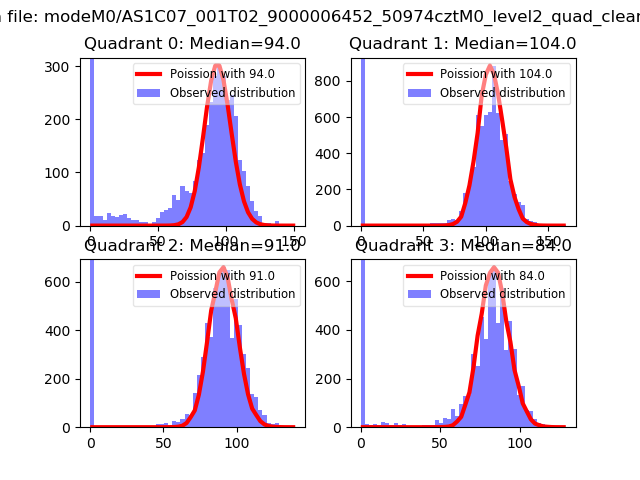 |
 |
| Quadrant-wise count rates Data is divided into 100 sec bins |
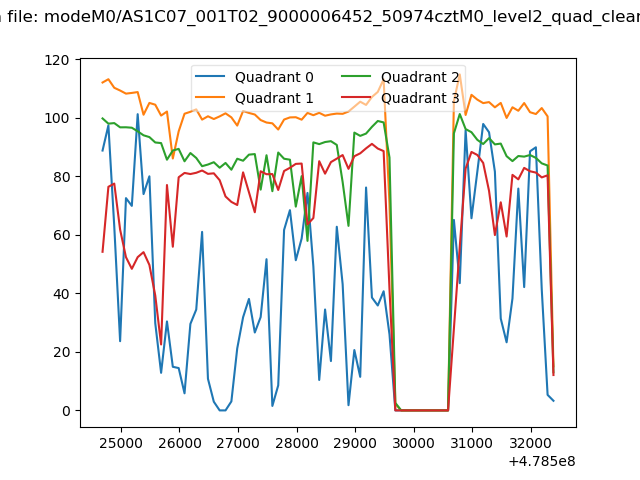 |
|
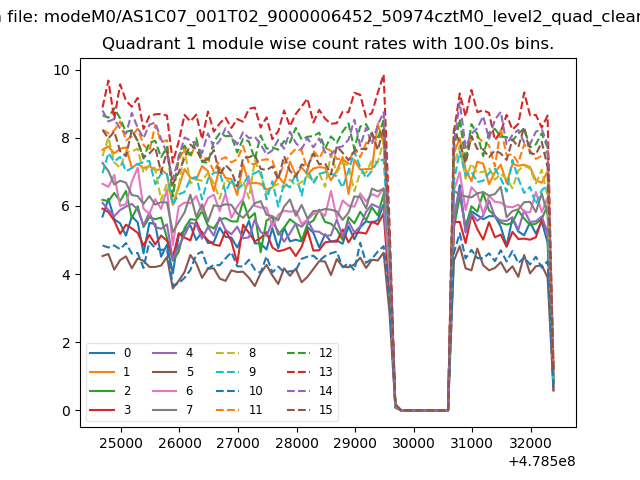
| Module-wise count rates for Quadrant A Data is divided into 100 sec bins |
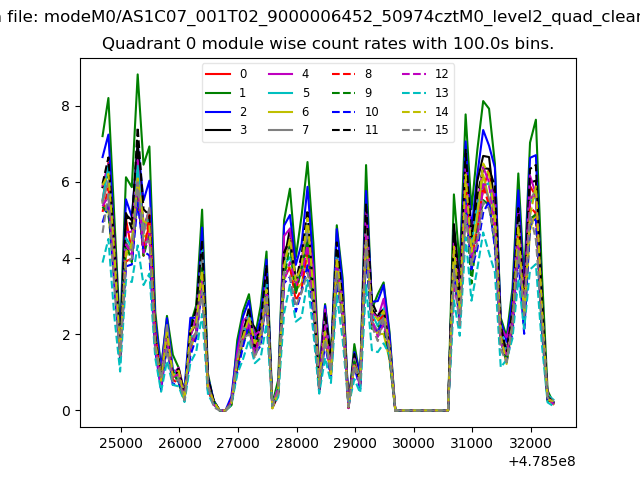 |
 |
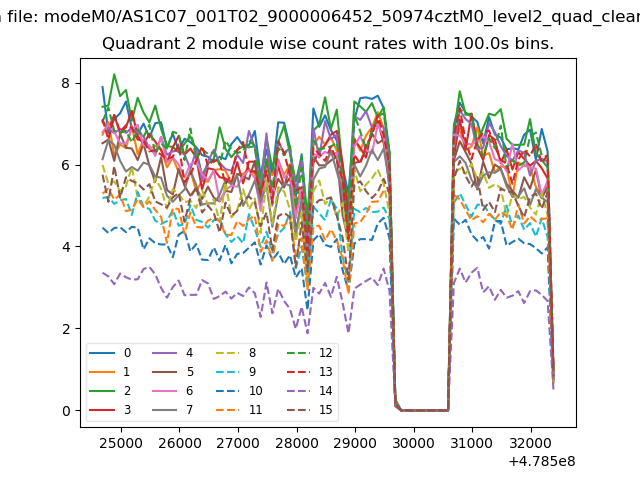
| Module-wise count rates for Quadrant B Data is divided into 100 sec bins |
 |
 |
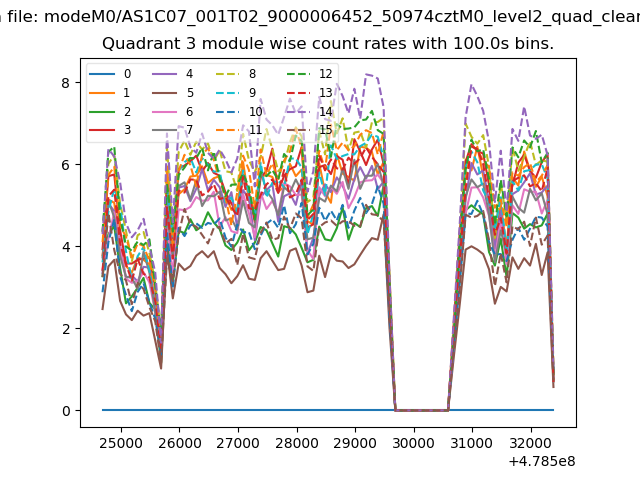
| Module-wise count rates for Quadrant C Data is divided into 100 sec bins |
 |
 |
| Module-wise count rates for Quadrant D Data is divided into 100 sec bins |
 |
 |
| Parameter | Plot |
|---|---|
| CZT HV Monitor | 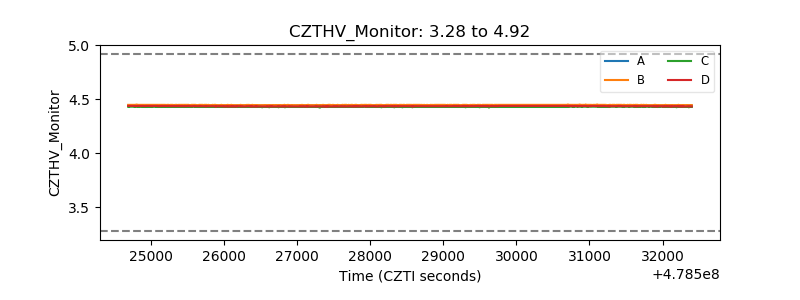 |
| D_VDD | 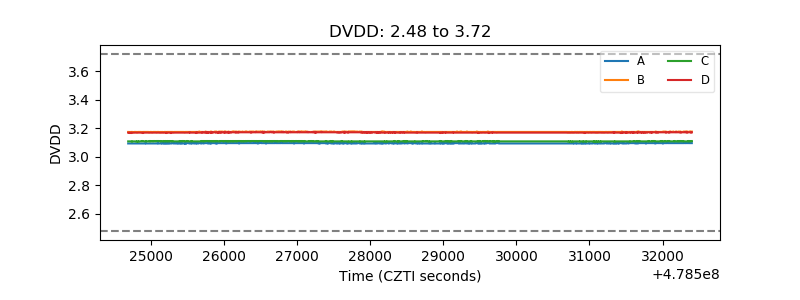 |
| Temperature 1 | 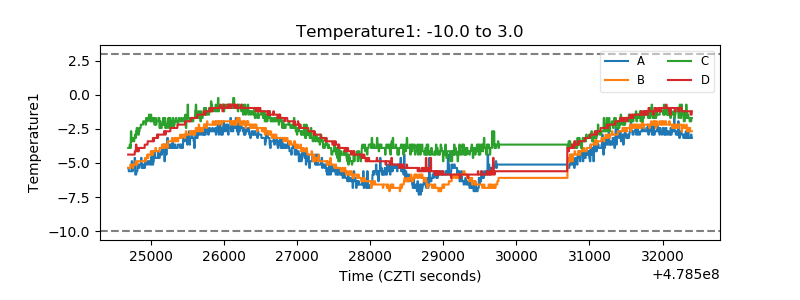 |
| Veto HV Monitor | 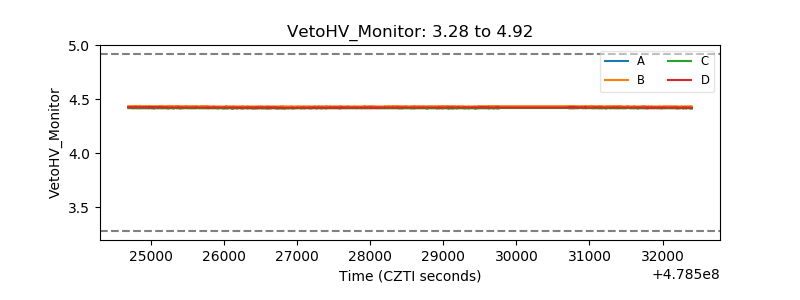 |
| Veto LLD | 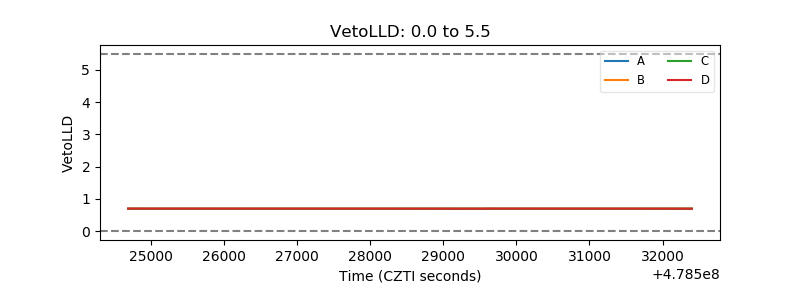 |
| Alpha Counter | 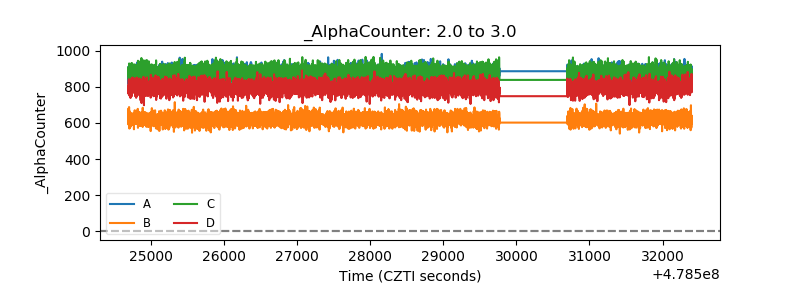 |
| _CPM_Rate | 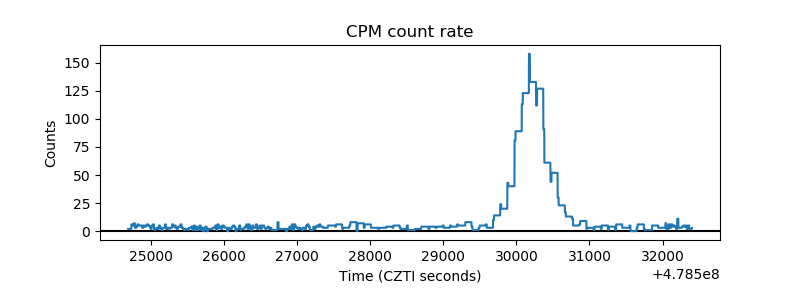 |
| CZT Counter | 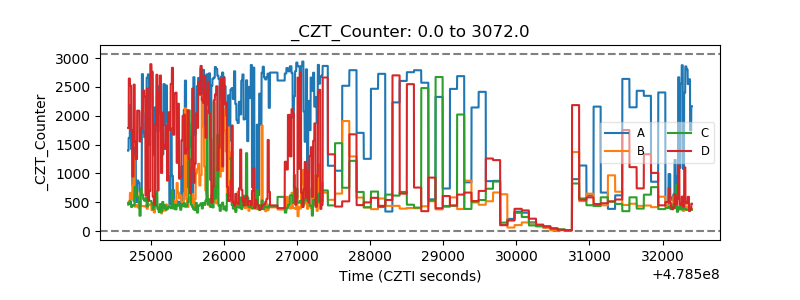 |
| +2.5 Volts monitor | 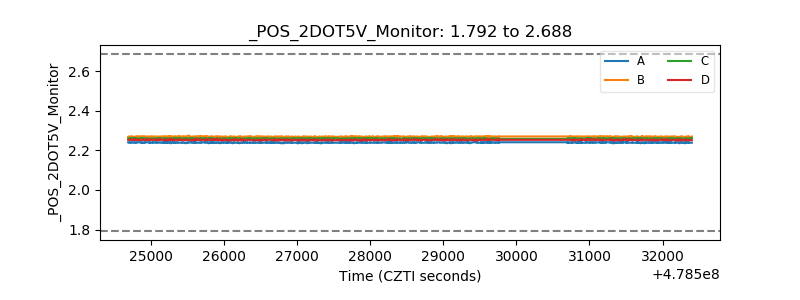 |
| +5 Volts monitor | 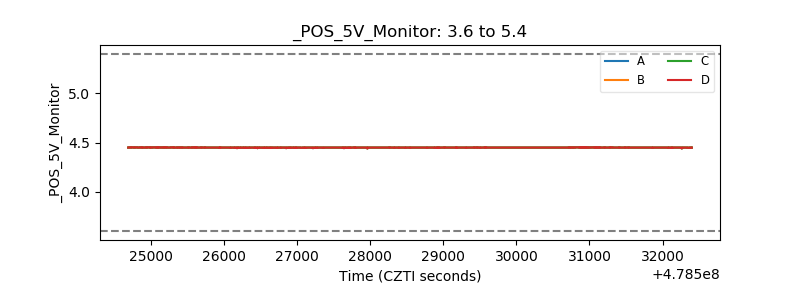 |
| _ROLL_ROT | 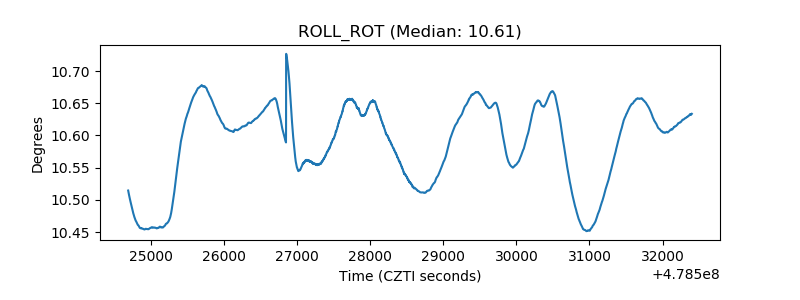 |
| _Roll_DEC | 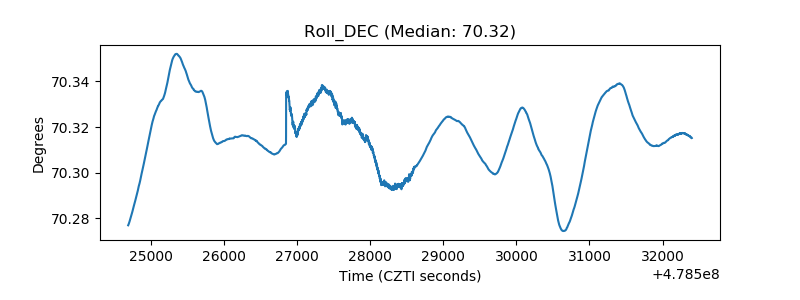 |
| _Roll_RA | 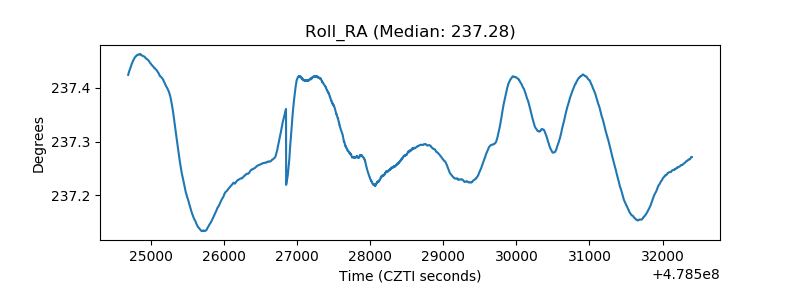 |
| Veto Counter | 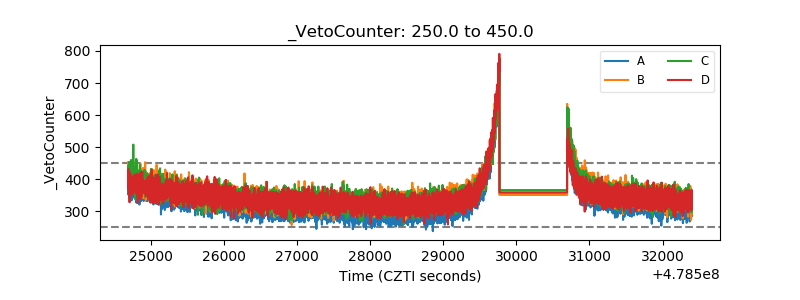 |