| Param | Original file | Final file |
|---|---|---|
| Filename | modeM0/AS1C07_001T02_9000006452_50976cztM0_level2.fits | modeM0/AS1C07_001T02_9000006452_50976cztM0_level2_quad_clean.evt |
| Size (bytes) | 760,245,120 | 93,764,160 |
| Size | 725.0 MB | 89.4 MB |
| Events in quadrant A | 11,040,657 | 445,931 |
| Events in quadrant B | 4,333,242 | 709,785 |
| Events in quadrant C | 6,034,925 | 598,336 |
| Events in quadrant D | 6,166,500 | 575,900 |
| Mode SS | |||
|---|---|---|---|
| Quadrant | BADHDUFLAG | Total packets | Discarded packets |
| A | 0 | 146 | 0 |
| B | 0 | 146 | 0 |
| C | 0 | 146 | 0 |
| D | 0 | 146 | 0 |
| Mode M0 | |||
|---|---|---|---|
| Quadrant | BADHDUFLAG | Total packets | Discarded packets |
| A | 0 | 37767 | 0 |
| B | 0 | 18197 | 0 |
| C | 0 | 23055 | 0 |
| D | 0 | 23531 | 0 |
| Quadrant | Total seconds | Saturated seconds | Saturation percentage |
|---|---|---|---|
| A | 7311 | 2806 | 38.380523% |
| B | 7311 | 376 | 5.142935% |
| C | 7311 | 746 | 10.203802% |
| D | 7311 | 664 | 9.082205% |
Noise dominated data is calculated using 1-second bins in cleaned event files. If a bin has >2000 counts, and if more than 50% of those come from <1% of pixels, then it is considered to be noise-dominated and hence unusable.
| Quadrant | # 1 sec bins | Bins with >0 counts | Bins with >2000 counts | High rate bins dominated by noise | Noise dominated (total time) | Noise dominated (detector-on time) | Marked lightcurve |
|---|---|---|---|---|---|---|---|
| A | 7311 | 7311 | 2505 | 2505 | 34.26% | 34.26% | 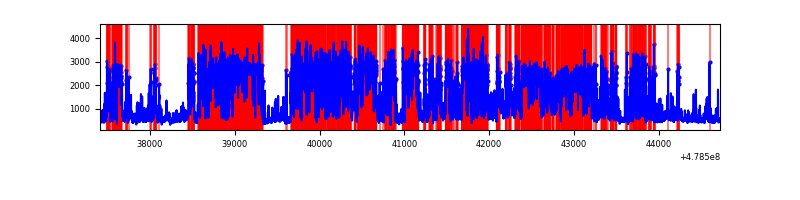 |
| B | 7311 | 7311 | 245 | 245 | 3.35% | 3.35% | 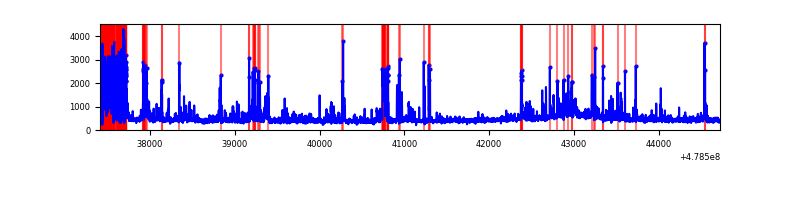 |
| C | 7311 | 7311 | 656 | 656 | 8.97% | 8.97% | 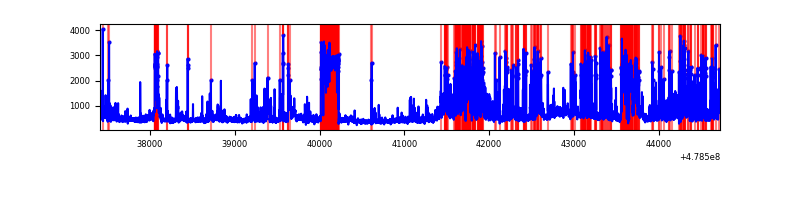 |
| D | 7311 | 7311 | 601 | 601 | 8.22% | 8.22% | 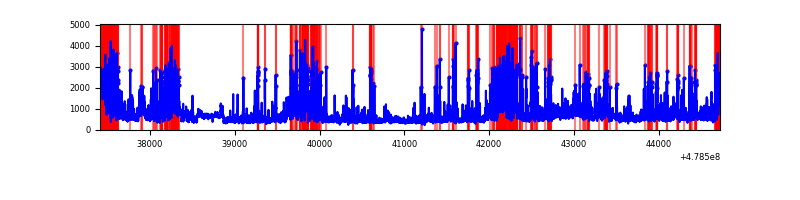 |
Top three noisy pixels from each quadrant. If the there are fewer than three noisy pixels in the level2.evt file, extra rows are filled as -1
| Pixel properties | Quadrant properties | ||||||
|---|---|---|---|---|---|---|---|
| Quadrant | DetID | PixID | Counts | Sigma | Mean | Median | Sigma |
| A | 14 | 254 | 7165047 | 45260.69 | 624 | 606 | 158.3 |
| A | 4 | 3 | 319708 | 2015.9 | 624 | 606 | 158.3 |
| A | 8 | 43 | 226143 | 1424.81 | 624 | 606 | 158.3 |
| B | 4 | 206 | 593122 | 3717.84 | 749 | 721 | 159.3 |
| B | 4 | 81 | 303890 | 1902.65 | 749 | 721 | 159.3 |
| B | 8 | 128 | 99574 | 620.39 | 749 | 721 | 159.3 |
| C | 15 | 147 | 693864 | 3544.9 | 716 | 710 | 195.5 |
| C | 13 | 49 | 592824 | 3028.17 | 716 | 710 | 195.5 |
| C | 0 | 177 | 571071 | 2916.92 | 716 | 710 | 195.5 |
| D | 8 | 176 | 1346207 | 6740.91 | 716 | 688 | 199.6 |
| D | 10 | 181 | 932655 | 4669.05 | 716 | 688 | 199.6 |
| D | 2 | 216 | 155285 | 774.51 | 716 | 688 | 199.6 |
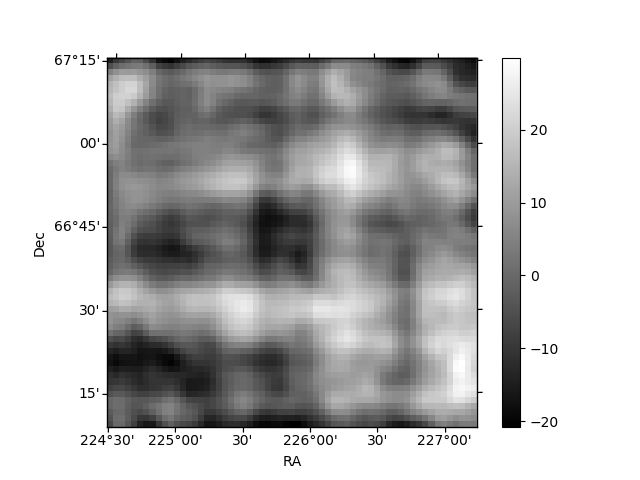
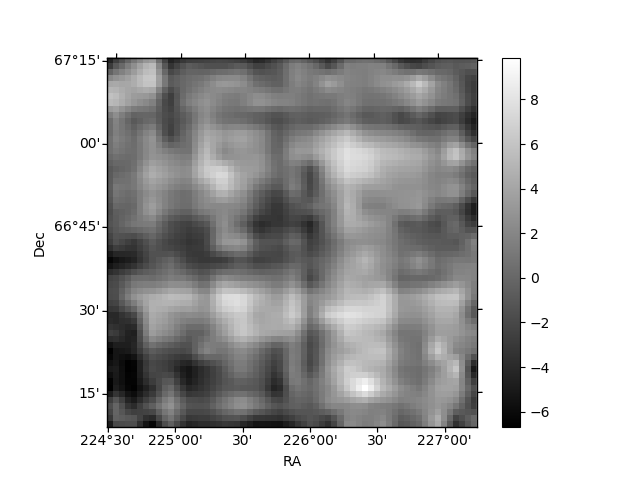
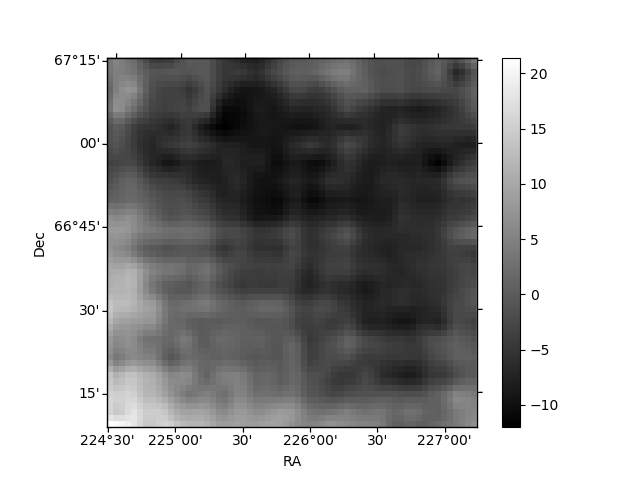
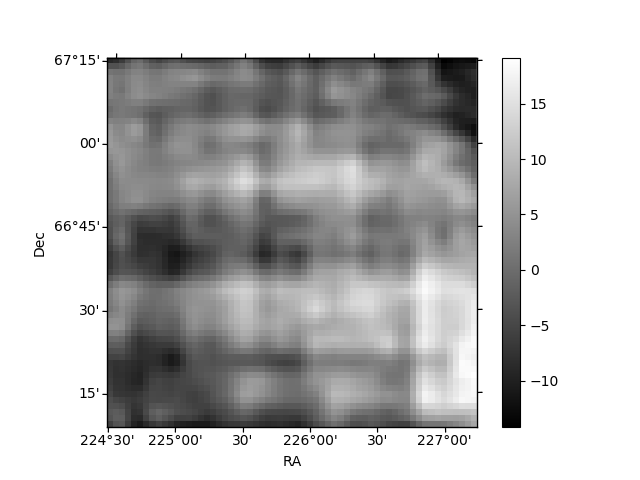
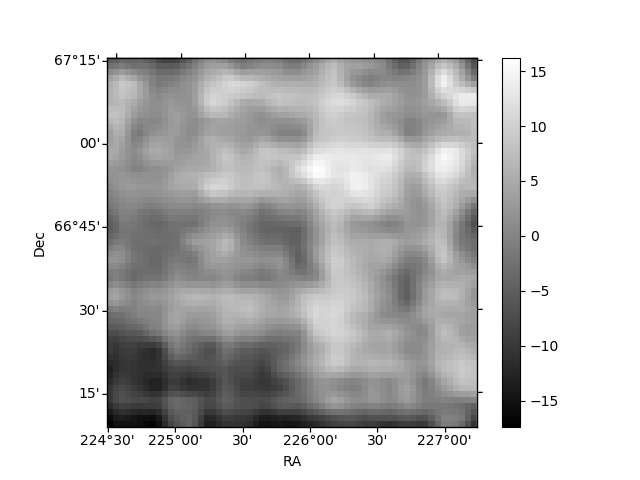
Histogram calculated using DETX and DETY for each event in the final _common_clean file
| Quadrant A | 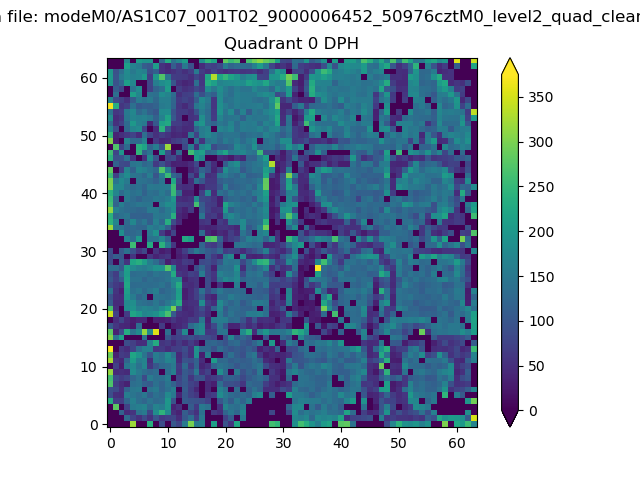 |
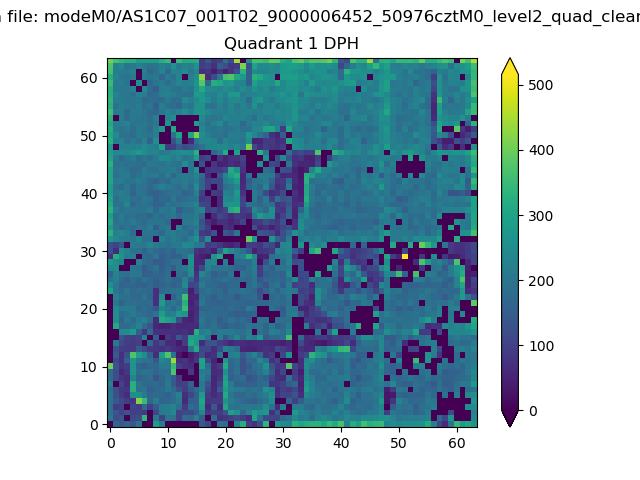 |
Quadrant B |
|---|---|---|---|
| Quadrant D | 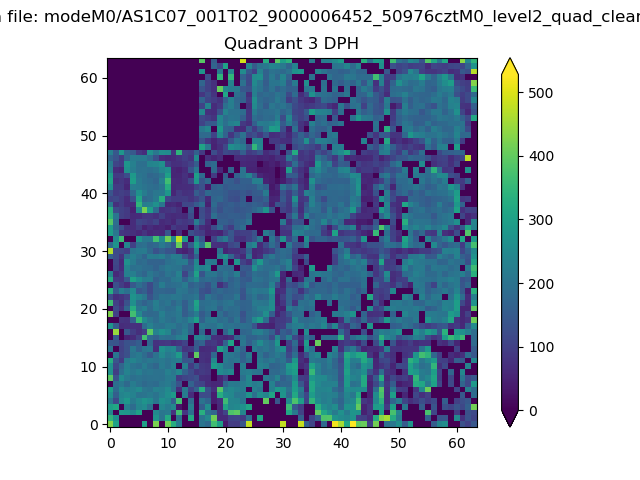 |
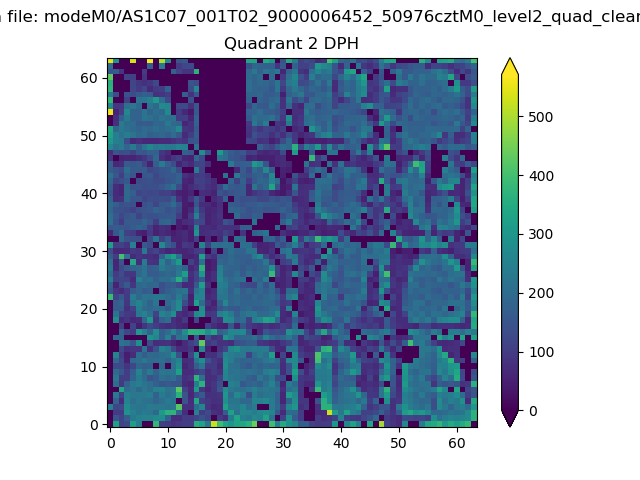 |
Quadrant C |
| Plot type | Count rate plots | Images |
|---|---|---|
| Comparison with Poisson distribution Blue bars denote a histogram of data divided into 1 sec bins. Red curve is a Poisson curve with rate = median count rate of data. |
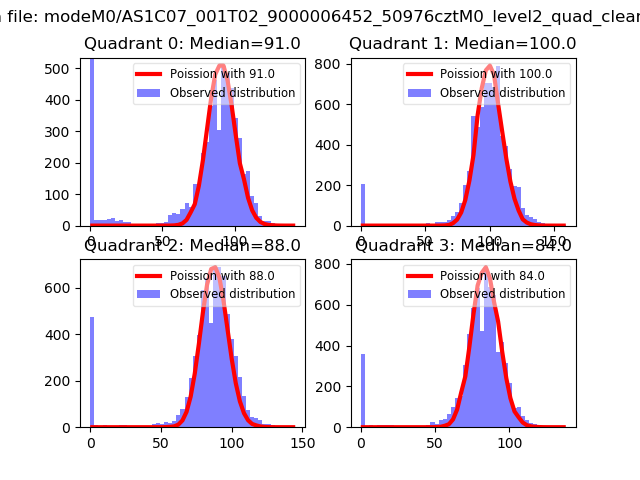 |
 |
| Quadrant-wise count rates Data is divided into 100 sec bins |
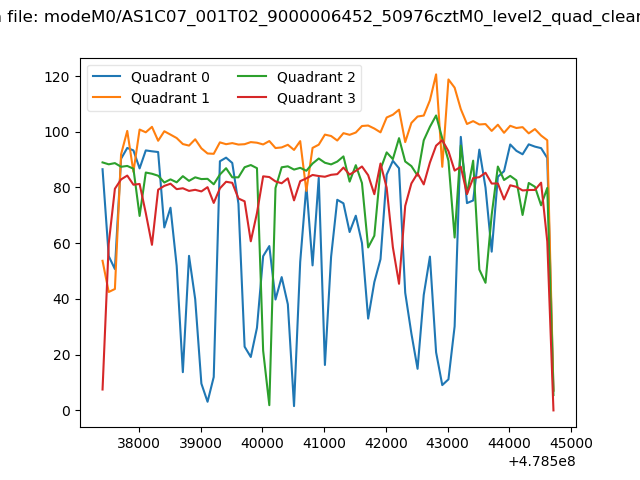 |
|
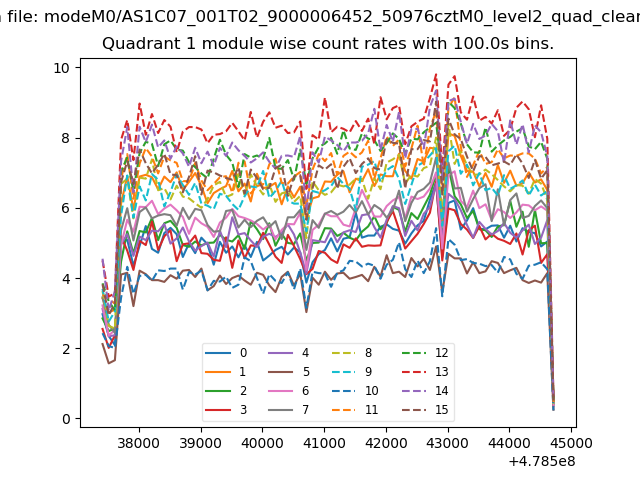
| Module-wise count rates for Quadrant A Data is divided into 100 sec bins |
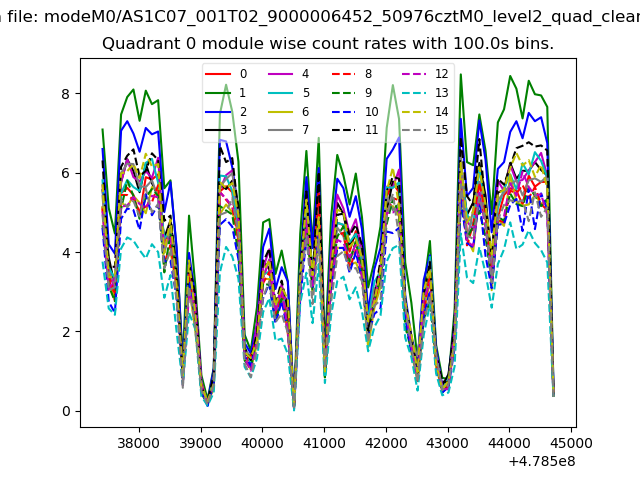 |
 |
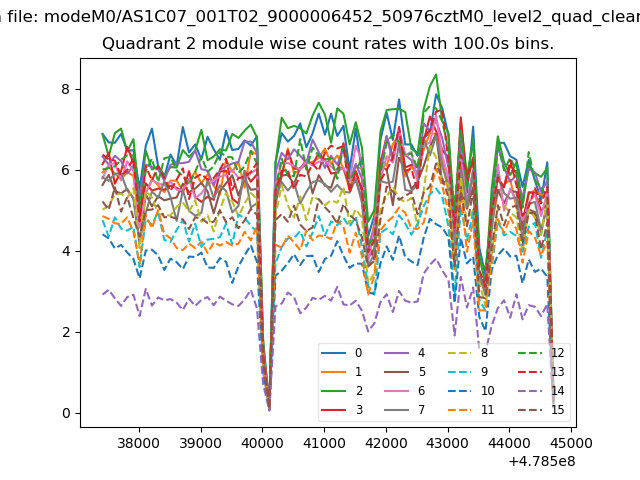
| Module-wise count rates for Quadrant B Data is divided into 100 sec bins |
 |
 |
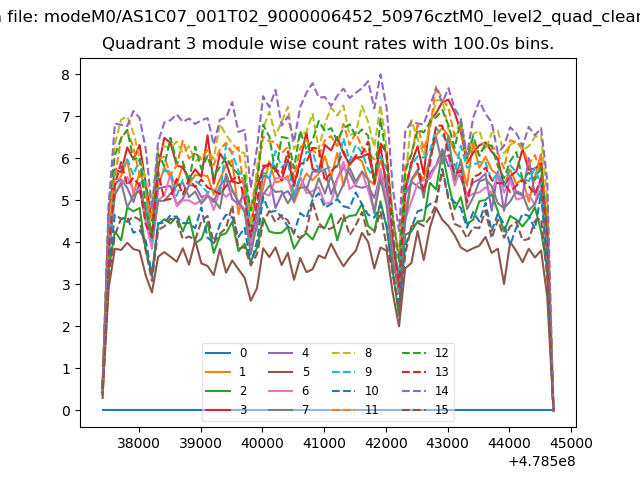
| Module-wise count rates for Quadrant C Data is divided into 100 sec bins |
 |
 |
| Module-wise count rates for Quadrant D Data is divided into 100 sec bins |
 |
 |
| Parameter | Plot |
|---|---|
| CZT HV Monitor |  |
| D_VDD | 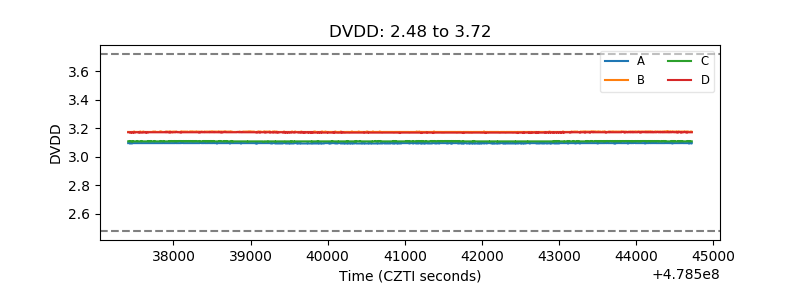 |
| Temperature 1 | 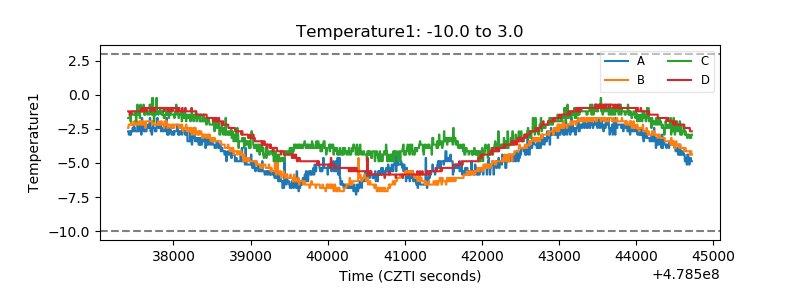 |
| Veto HV Monitor | 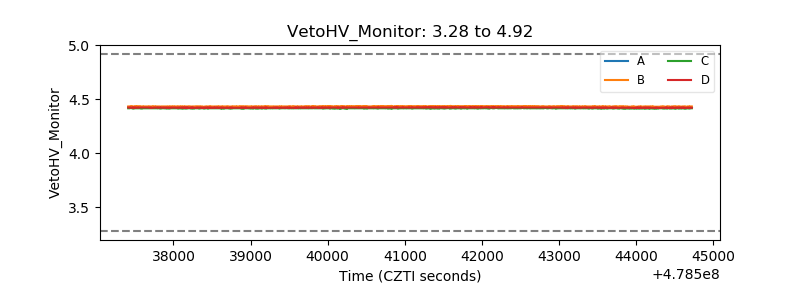 |
| Veto LLD | 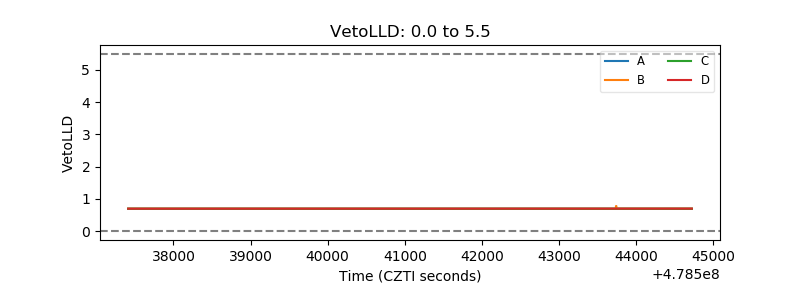 |
| Alpha Counter | 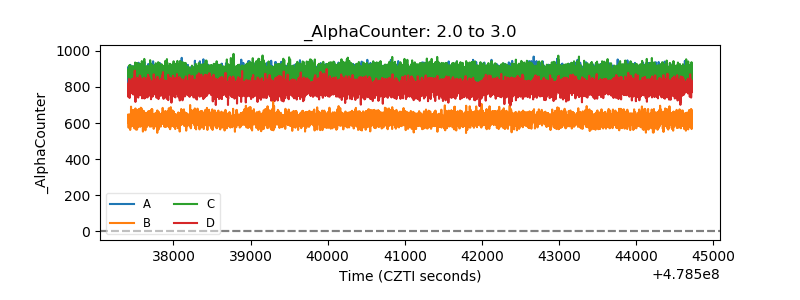 |
| _CPM_Rate | 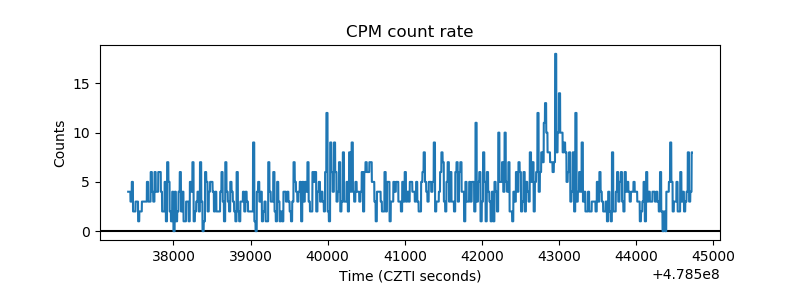 |
| CZT Counter | 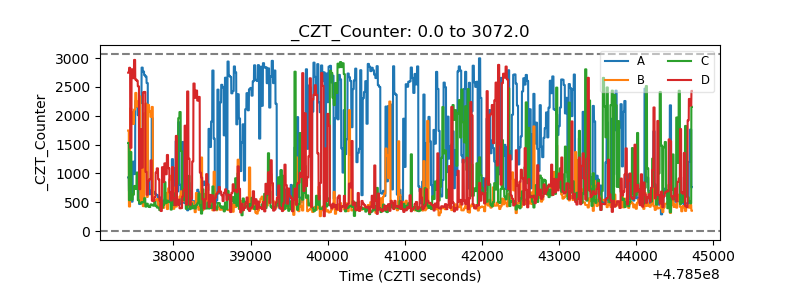 |
| +2.5 Volts monitor | 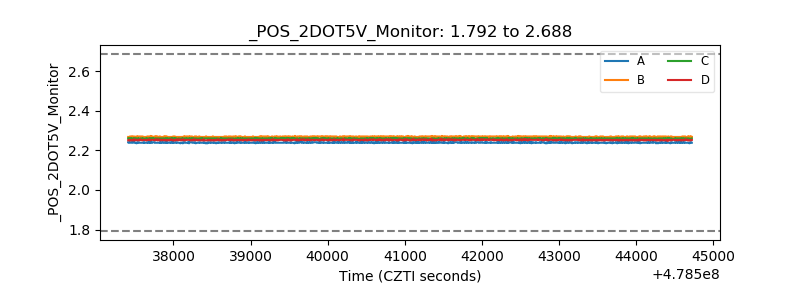 |
| +5 Volts monitor | 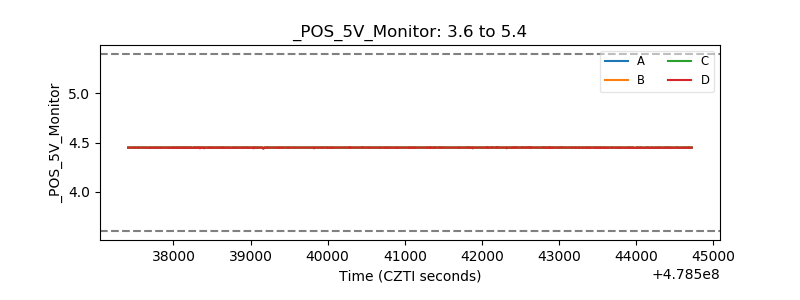 |
| _ROLL_ROT | 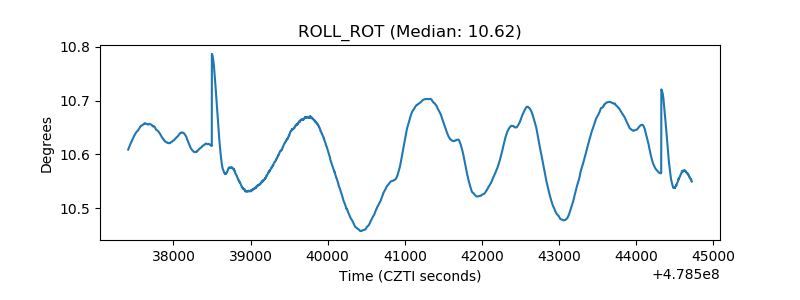 |
| _Roll_DEC | 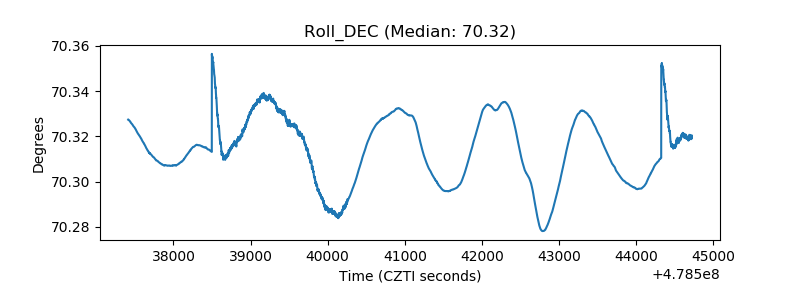 |
| _Roll_RA | 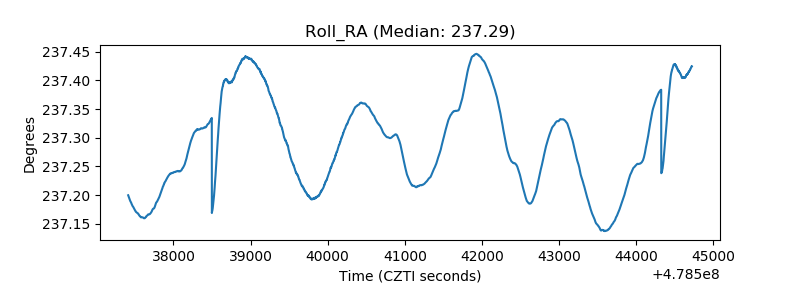 |
| Veto Counter | 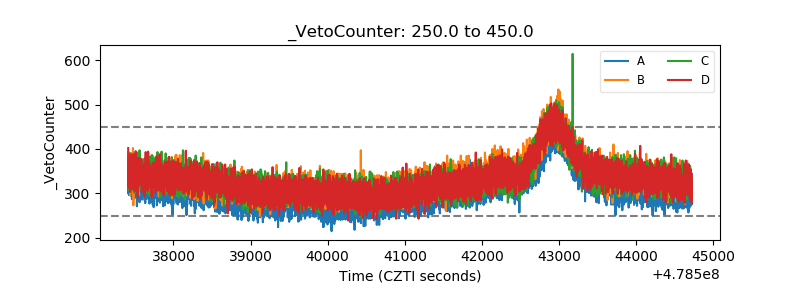 |