| Param | Original file | Final file |
|---|---|---|
| Filename | modeM0/AS1C07_001T02_9000006452_50977cztM0_level2.fits | modeM0/AS1C07_001T02_9000006452_50977cztM0_level2_quad_clean.evt |
| Size (bytes) | 616,305,600 | 100,938,240 |
| Size | 587.8 MB | 96.3 MB |
| Events in quadrant A | 4,822,267 | 664,524 |
| Events in quadrant B | 4,655,339 | 708,798 |
| Events in quadrant C | 5,408,644 | 611,573 |
| Events in quadrant D | 7,360,896 | 562,373 |
| Mode SS | |||
|---|---|---|---|
| Quadrant | BADHDUFLAG | Total packets | Discarded packets |
| A | 0 | 146 | 0 |
| B | 0 | 146 | 0 |
| C | 0 | 146 | 0 |
| D | 0 | 146 | 0 |
| Mode M0 | |||
|---|---|---|---|
| Quadrant | BADHDUFLAG | Total packets | Discarded packets |
| A | 0 | 19249 | 0 |
| B | 0 | 19018 | 0 |
| C | 0 | 21131 | 0 |
| D | 0 | 27114 | 0 |
| Quadrant | Total seconds | Saturated seconds | Saturation percentage |
|---|---|---|---|
| A | 7310 | 250 | 3.419973% |
| B | 7311 | 312 | 4.267542% |
| C | 7311 | 530 | 7.249350% |
| D | 7311 | 717 | 9.807140% |
Noise dominated data is calculated using 1-second bins in cleaned event files. If a bin has >2000 counts, and if more than 50% of those come from <1% of pixels, then it is considered to be noise-dominated and hence unusable.
| Quadrant | # 1 sec bins | Bins with >0 counts | Bins with >2000 counts | High rate bins dominated by noise | Noise dominated (total time) | Noise dominated (detector-on time) | Marked lightcurve |
|---|---|---|---|---|---|---|---|
| A | 7310 | 7310 | 197 | 197 | 2.69% | 2.69% | 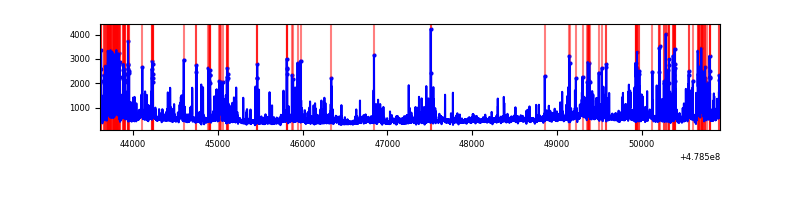 |
| B | 7311 | 7311 | 239 | 239 | 3.27% | 3.27% | 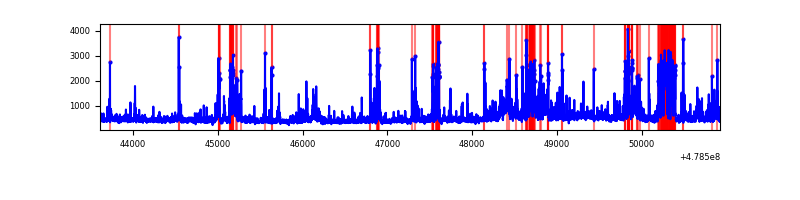 |
| C | 7311 | 7311 | 455 | 455 | 6.22% | 6.22% | 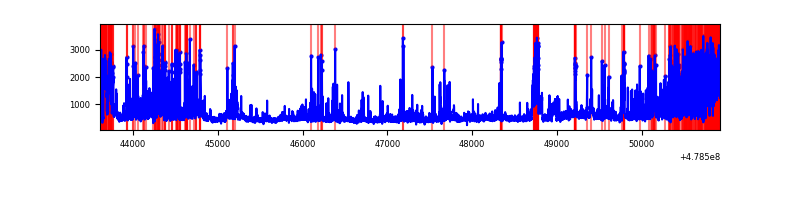 |
| D | 7311 | 7311 | 623 | 623 | 8.52% | 8.52% | 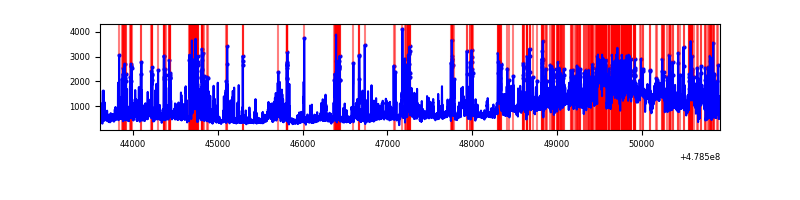 |
Top three noisy pixels from each quadrant. If the there are fewer than three noisy pixels in the level2.evt file, extra rows are filled as -1
| Pixel properties | Quadrant properties | ||||||
|---|---|---|---|---|---|---|---|
| Quadrant | DetID | PixID | Counts | Sigma | Mean | Median | Sigma |
| A | 14 | 254 | 533861 | 2853.62 | 750 | 731 | 186.8 |
| A | 8 | 43 | 299355 | 1598.41 | 750 | 731 | 186.8 |
| A | 4 | 3 | 262671 | 1402.06 | 750 | 731 | 186.8 |
| B | 4 | 81 | 542977 | 3454.64 | 742 | 718 | 157.0 |
| B | 0 | 172 | 455418 | 2896.82 | 742 | 718 | 157.0 |
| B | 8 | 234 | 197478 | 1253.53 | 742 | 718 | 157.0 |
| C | 0 | 177 | 838553 | 4233.11 | 717 | 711 | 197.9 |
| C | 4 | 5 | 354080 | 1785.36 | 717 | 711 | 197.9 |
| C | 15 | 147 | 353821 | 1784.05 | 717 | 711 | 197.9 |
| D | 7 | 39 | 1830778 | 9300.78 | 707 | 683 | 196.8 |
| D | 3 | 12 | 536139 | 2721.26 | 707 | 683 | 196.8 |
| D | 8 | 176 | 428871 | 2176.11 | 707 | 683 | 196.8 |
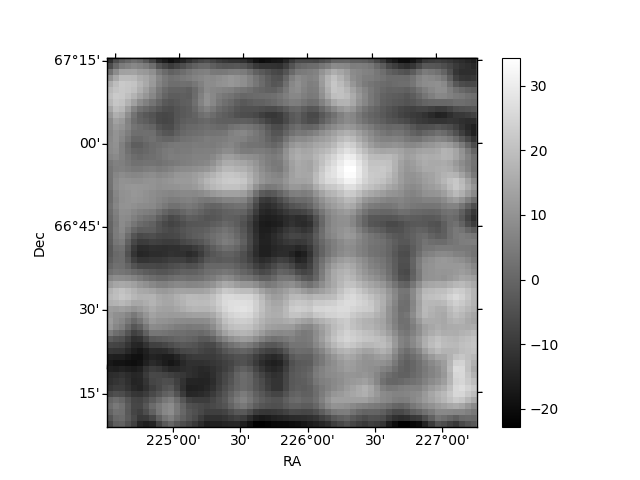
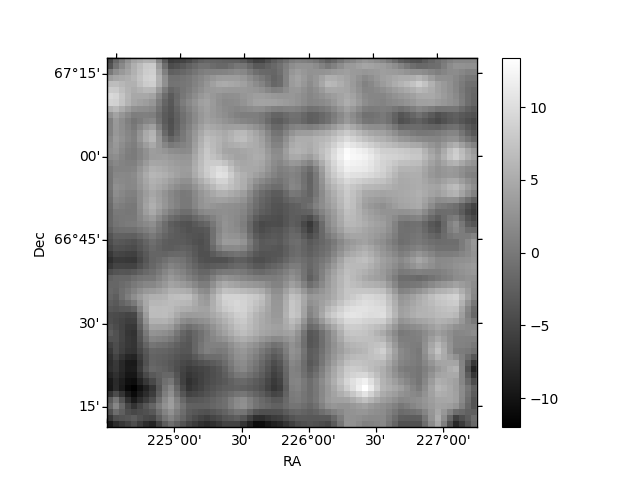
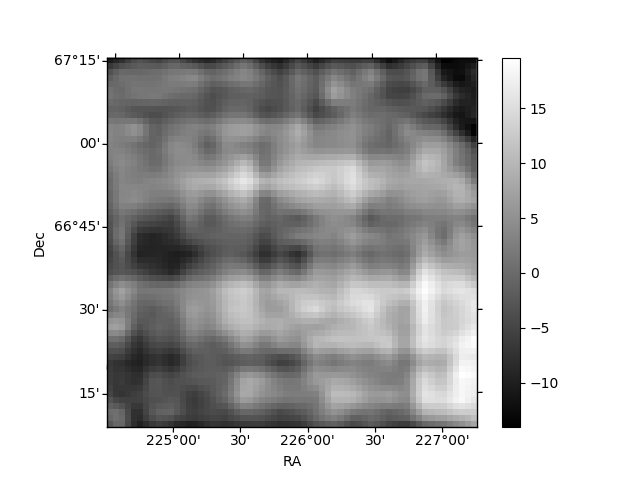
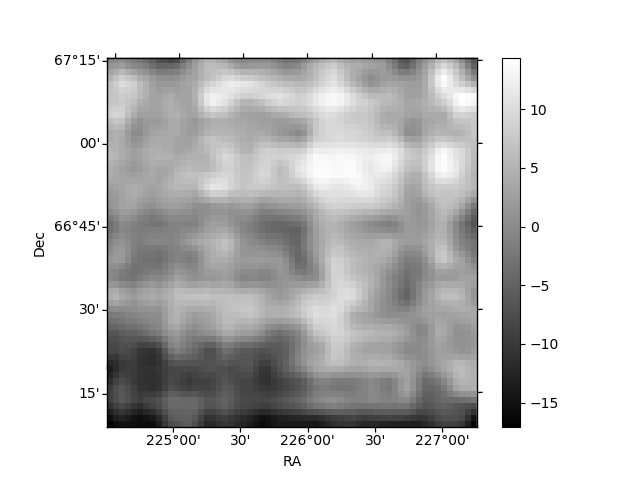
Histogram calculated using DETX and DETY for each event in the final _common_clean file
| Quadrant A | 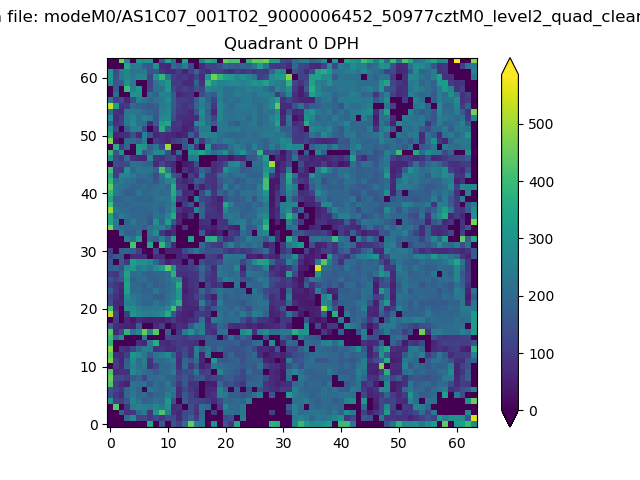 |
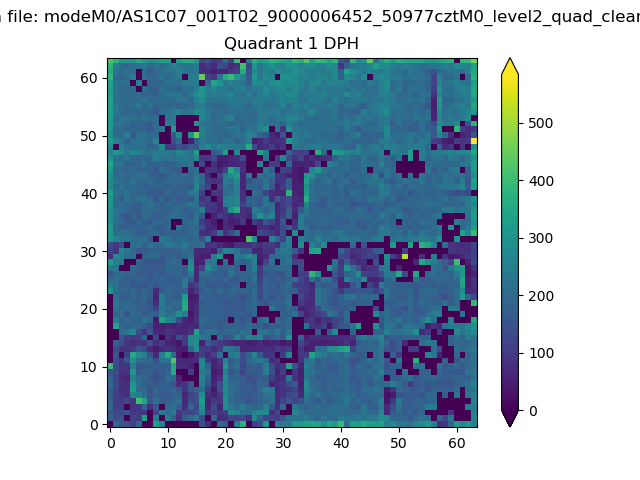 |
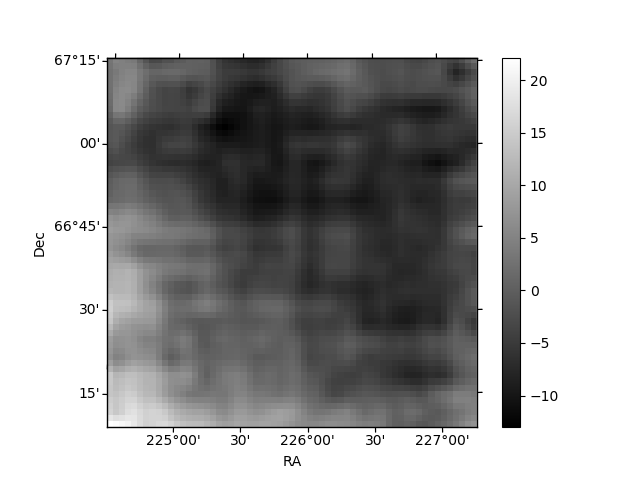
Quadrant B |
|---|---|---|---|
| Quadrant D | 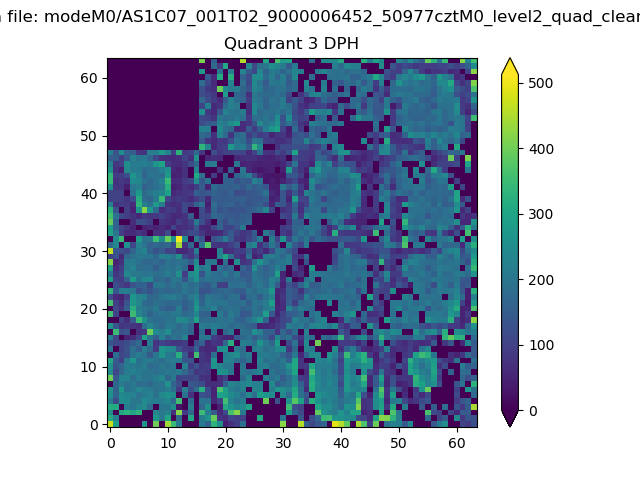 |
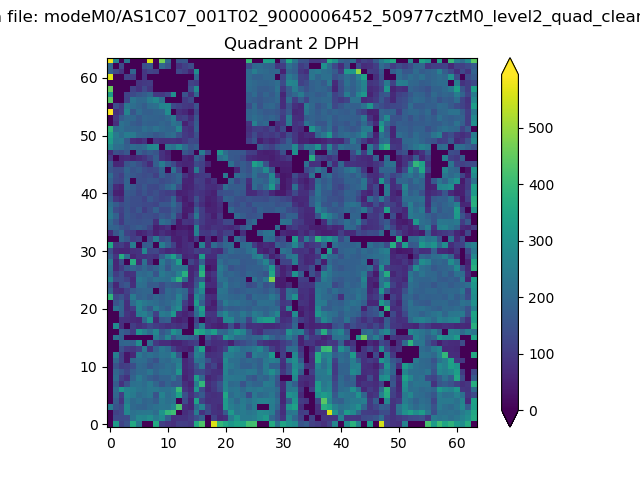 |
Quadrant C |
| Plot type | Count rate plots | Images |
|---|---|---|
| Comparison with Poisson distribution Blue bars denote a histogram of data divided into 1 sec bins. Red curve is a Poisson curve with rate = median count rate of data. |
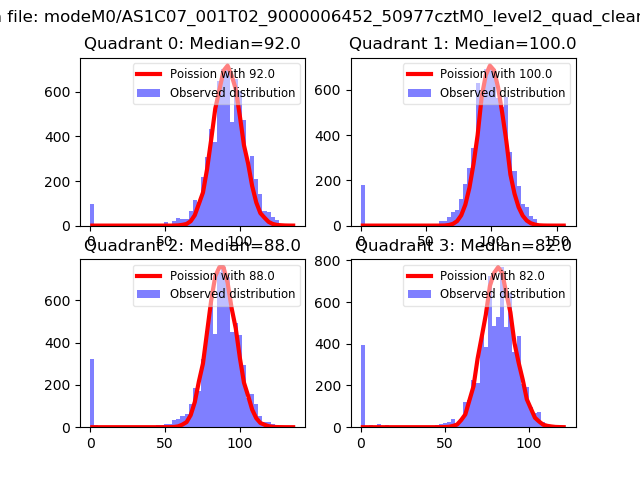 |
 |
| Quadrant-wise count rates Data is divided into 100 sec bins |
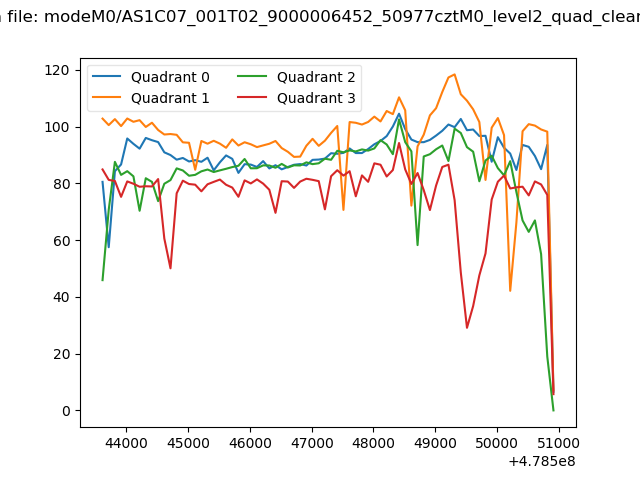 |
|
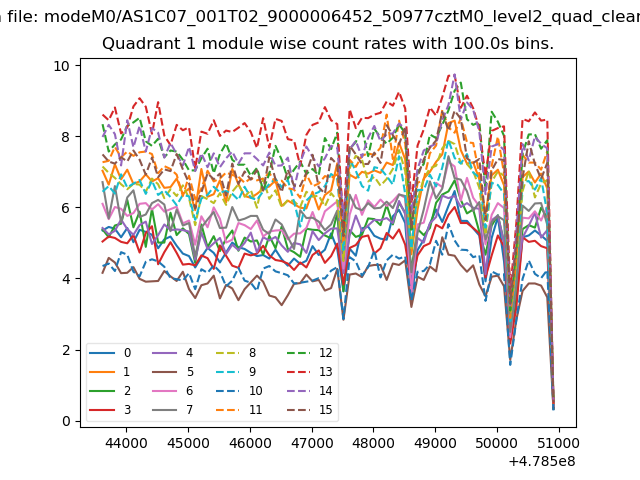
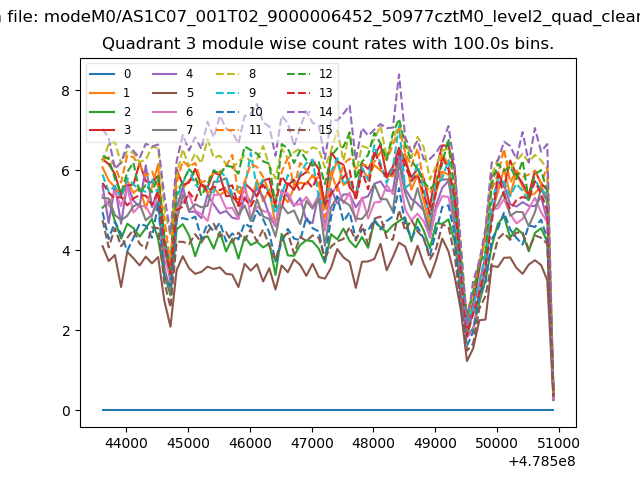
| Module-wise count rates for Quadrant A Data is divided into 100 sec bins |
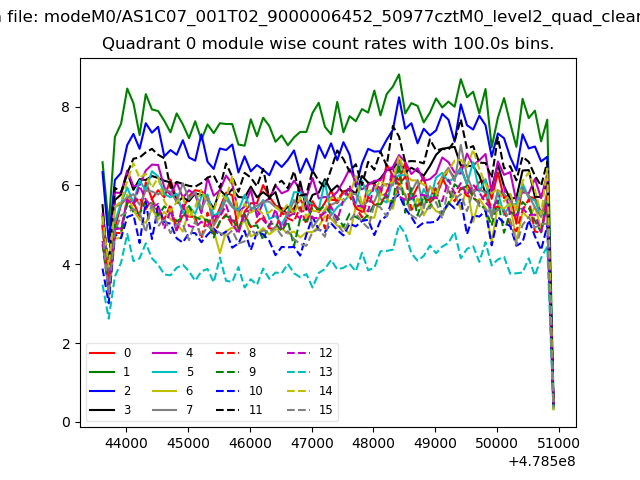 |
 |
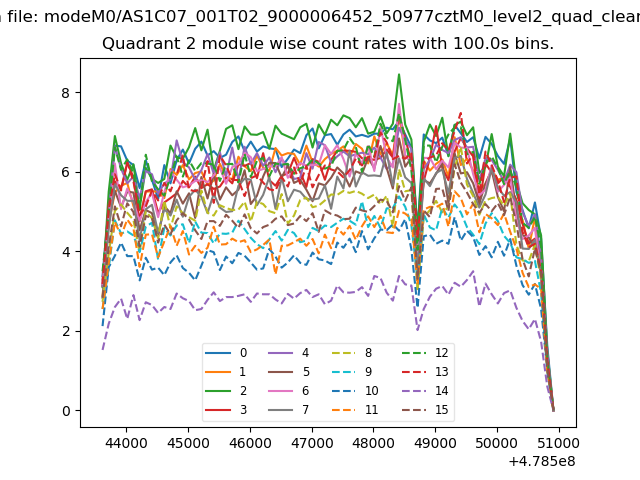
| Module-wise count rates for Quadrant B Data is divided into 100 sec bins |
 |
 |
| Module-wise count rates for Quadrant C Data is divided into 100 sec bins |
 |
 |
| Module-wise count rates for Quadrant D Data is divided into 100 sec bins |
 |
 |
| Parameter | Plot |
|---|---|
| CZT HV Monitor | 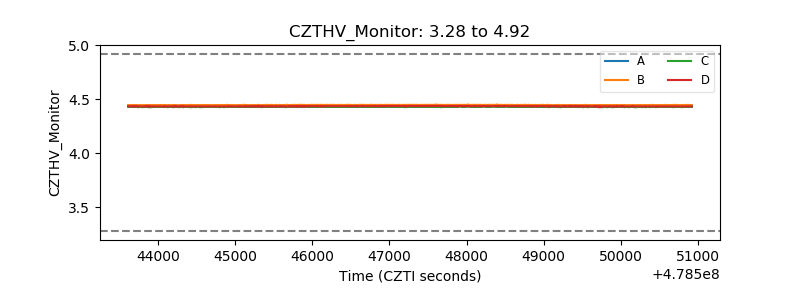 |
| D_VDD | 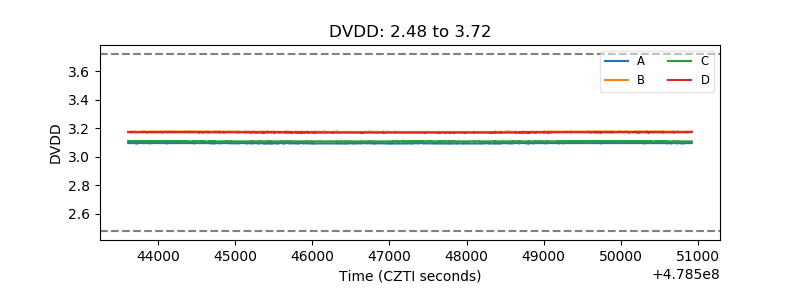 |
| Temperature 1 | 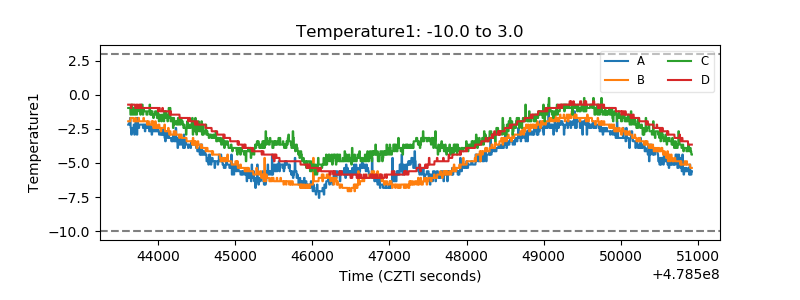 |
| Veto HV Monitor |  |
| Veto LLD | 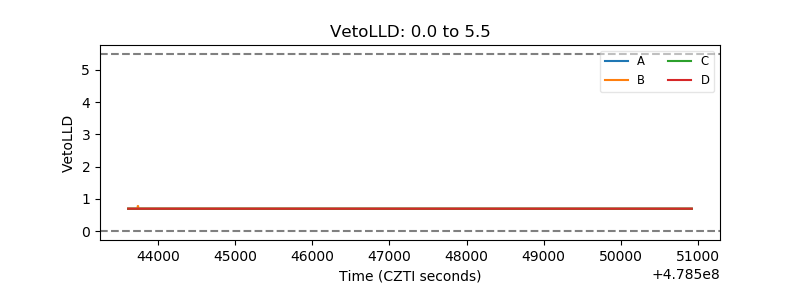 |
| Alpha Counter | 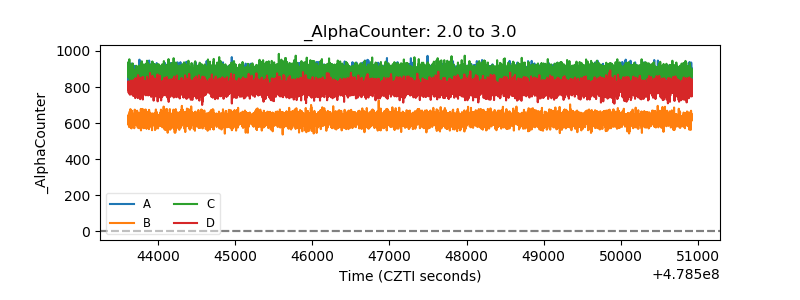 |
| _CPM_Rate | 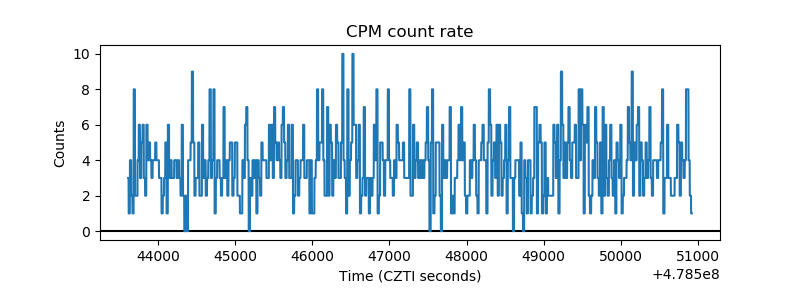 |
| CZT Counter | 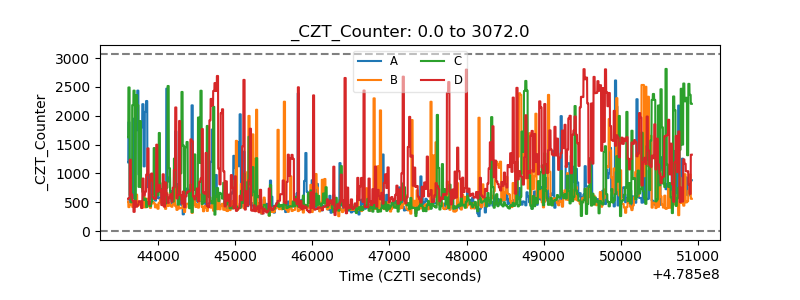 |
| +2.5 Volts monitor | 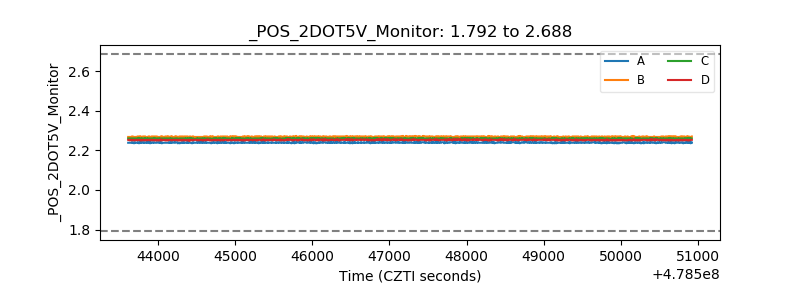 |
| +5 Volts monitor | 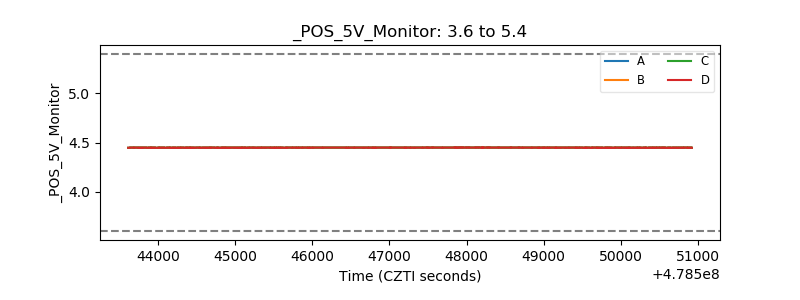 |
| _ROLL_ROT | 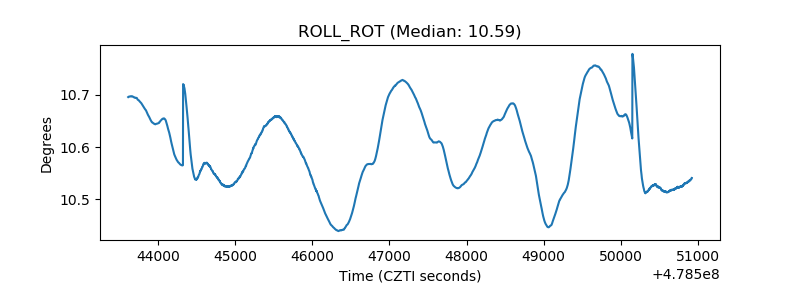 |
| _Roll_DEC | 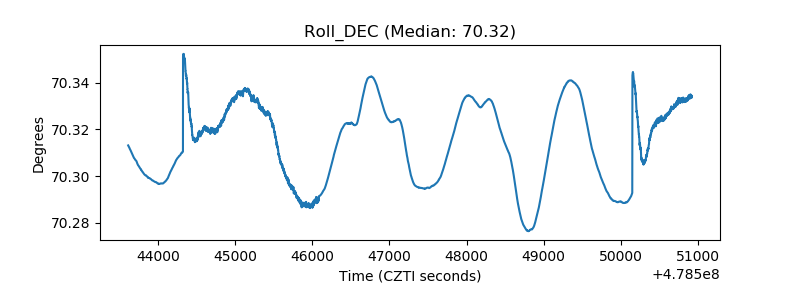 |
| _Roll_RA | 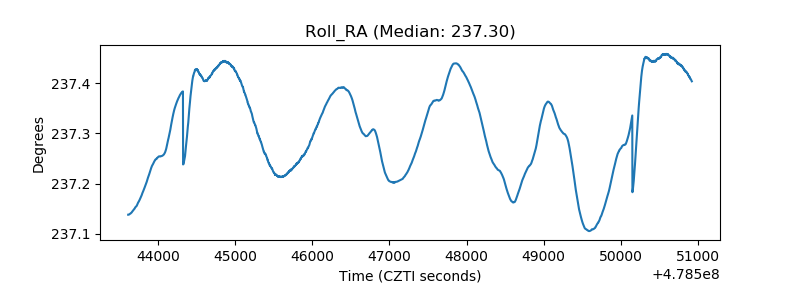 |
| Veto Counter | 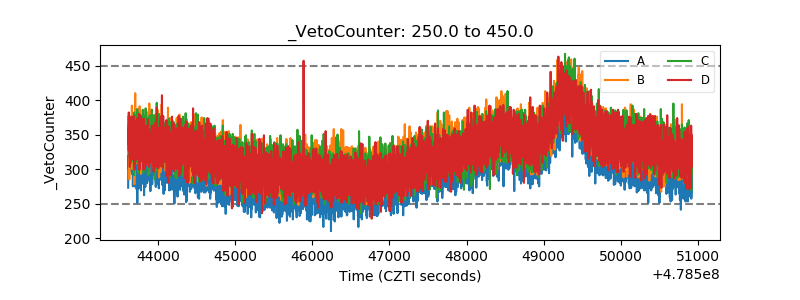 |