| Param | Original file | Final file |
|---|---|---|
| Filename | modeM0/AS1C07_001T02_9000006452_50978cztM0_level2.fits | modeM0/AS1C07_001T02_9000006452_50978cztM0_level2_quad_clean.evt |
| Size (bytes) | 1,079,712,000 | 87,295,680 |
| Size | 1.0 GB | 83.3 MB |
| Events in quadrant A | 5,063,692 | 712,755 |
| Events in quadrant B | 7,425,675 | 656,158 |
| Events in quadrant C | 12,425,620 | 379,423 |
| Events in quadrant D | 14,453,344 | 354,669 |
| Mode SS | |||
|---|---|---|---|
| Quadrant | BADHDUFLAG | Total packets | Discarded packets |
| A | 0 | 156 | 0 |
| B | 0 | 156 | 0 |
| C | 0 | 156 | 0 |
| D | 0 | 156 | 0 |
| Mode M0 | |||
|---|---|---|---|
| Quadrant | BADHDUFLAG | Total packets | Discarded packets |
| A | 0 | 20400 | 0 |
| B | 0 | 27601 | 0 |
| C | 0 | 42212 | 0 |
| D | 0 | 48302 | 0 |
| Quadrant | Total seconds | Saturated seconds | Saturation percentage |
|---|---|---|---|
| A | 7756 | 187 | 2.411037% |
| B | 7757 | 1347 | 17.364961% |
| C | 7757 | 3808 | 49.091143% |
| D | 7757 | 3806 | 49.065360% |
Noise dominated data is calculated using 1-second bins in cleaned event files. If a bin has >2000 counts, and if more than 50% of those come from <1% of pixels, then it is considered to be noise-dominated and hence unusable.
| Quadrant | # 1 sec bins | Bins with >0 counts | Bins with >2000 counts | High rate bins dominated by noise | Noise dominated (total time) | Noise dominated (detector-on time) | Marked lightcurve |
|---|---|---|---|---|---|---|---|
| A | 7756 | 7756 | 155 | 155 | 2.00% | 2.00% | 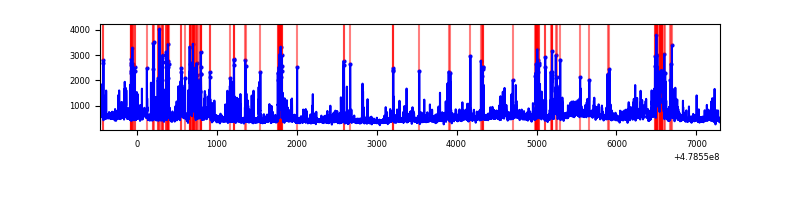 |
| B | 7757 | 7757 | 926 | 926 | 11.94% | 11.94% | 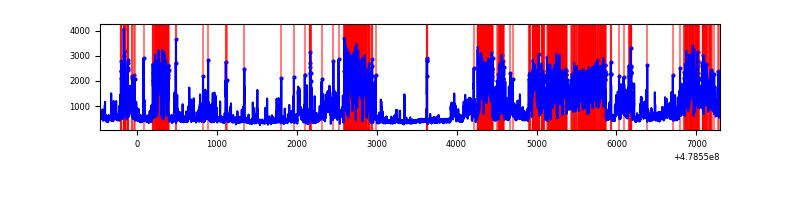 |
| C | 7757 | 7757 | 3162 | 3162 | 40.76% | 40.76% | 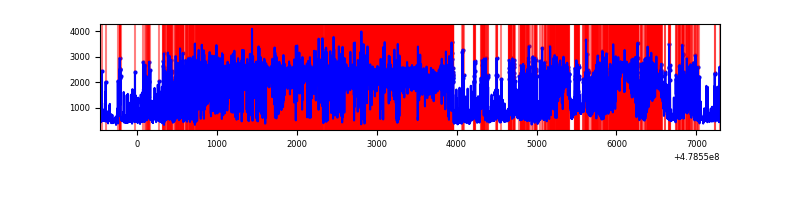 |
| D | 7757 | 7757 | 3460 | 3460 | 44.60% | 44.60% | 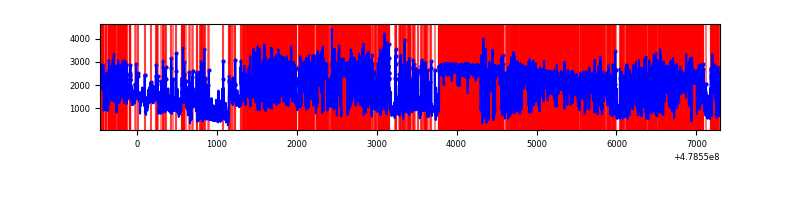 |
Top three noisy pixels from each quadrant. If the there are fewer than three noisy pixels in the level2.evt file, extra rows are filled as -1
| Pixel properties | Quadrant properties | ||||||
|---|---|---|---|---|---|---|---|
| Quadrant | DetID | PixID | Counts | Sigma | Mean | Median | Sigma |
| A | 8 | 43 | 488773 | 2411.45 | 810 | 789 | 202.4 |
| A | 14 | 254 | 258222 | 1272.15 | 810 | 789 | 202.4 |
| A | 4 | 3 | 237819 | 1171.32 | 810 | 789 | 202.4 |
| B | 0 | 172 | 2785184 | 17233.72 | 761 | 736 | 161.6 |
| B | 4 | 81 | 929545 | 5748.66 | 761 | 736 | 161.6 |
| B | 8 | 234 | 122792 | 755.44 | 761 | 736 | 161.6 |
| C | 0 | 177 | 7800479 | 46647.85 | 587 | 582 | 167.2 |
| C | 0 | 193 | 421828 | 2519.29 | 587 | 582 | 167.2 |
| C | 15 | 158 | 318529 | 1901.5 | 587 | 582 | 167.2 |
| D | 8 | 176 | 2781150 | 16838.82 | 589 | 569 | 165.1 |
| D | 7 | 60 | 2776783 | 16812.37 | 589 | 569 | 165.1 |
| D | 7 | 39 | 2673839 | 16188.96 | 589 | 569 | 165.1 |
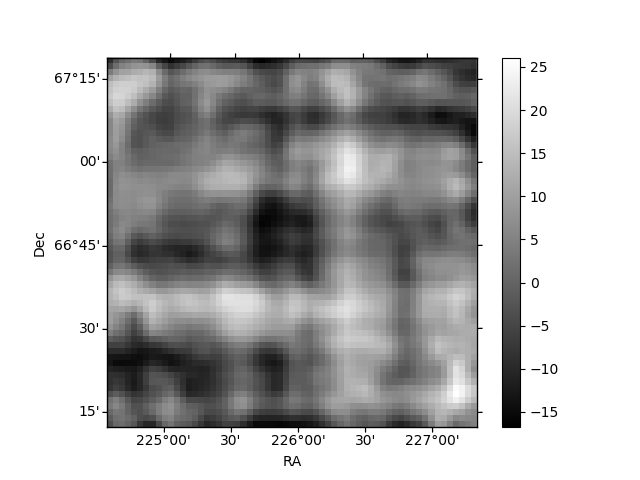
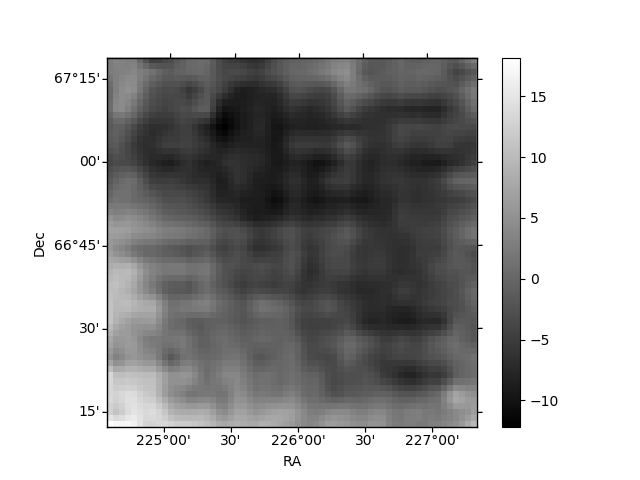
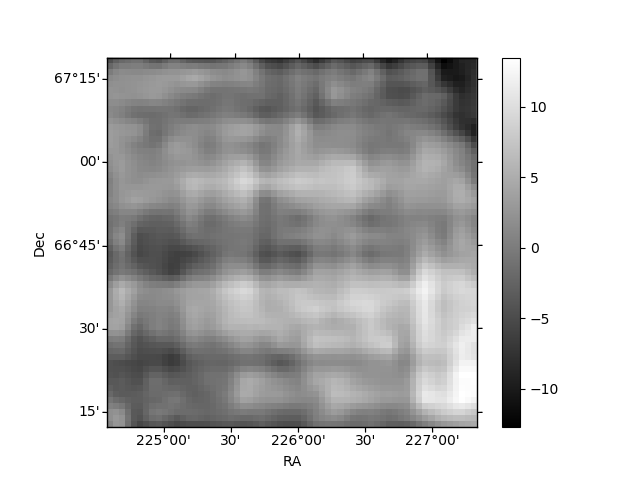
Histogram calculated using DETX and DETY for each event in the final _common_clean file
| Quadrant A | 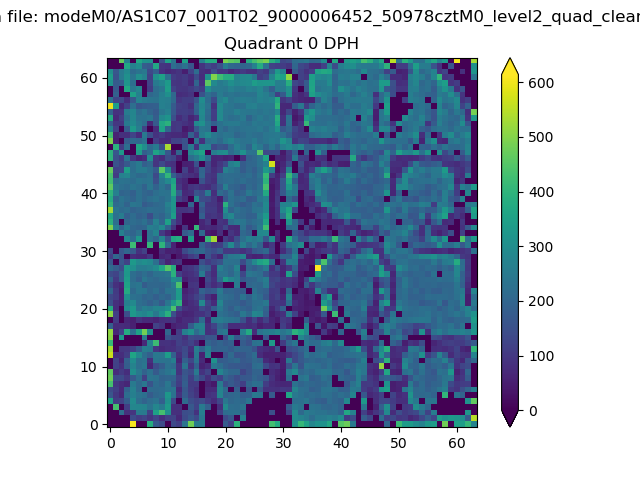 |
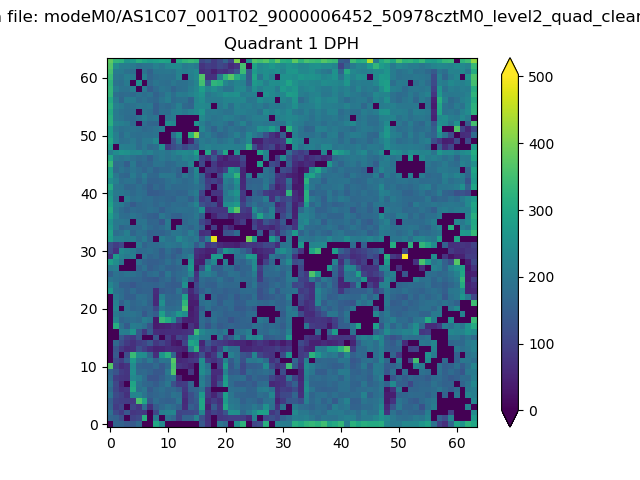 |
Quadrant B |
|---|---|---|---|
| Quadrant D | 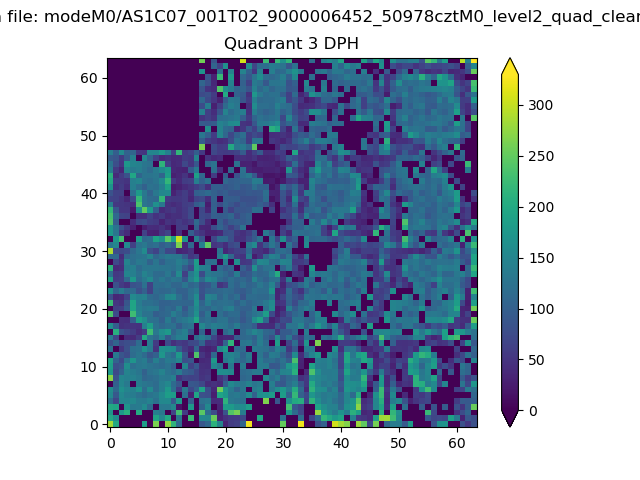 |
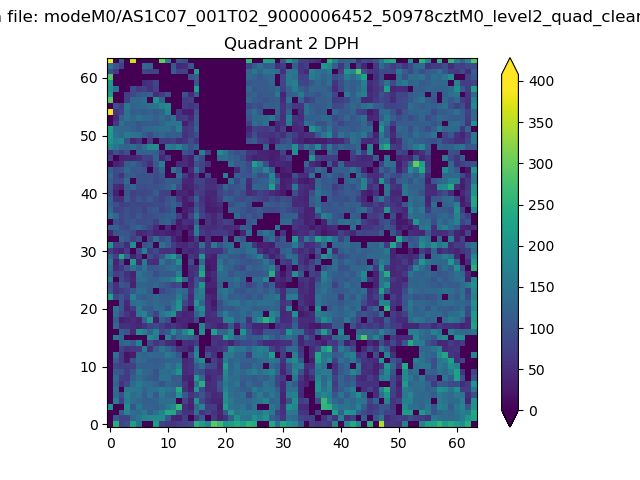 |
Quadrant C |
| Plot type | Count rate plots | Images |
|---|---|---|
| Comparison with Poisson distribution Blue bars denote a histogram of data divided into 1 sec bins. Red curve is a Poisson curve with rate = median count rate of data. |
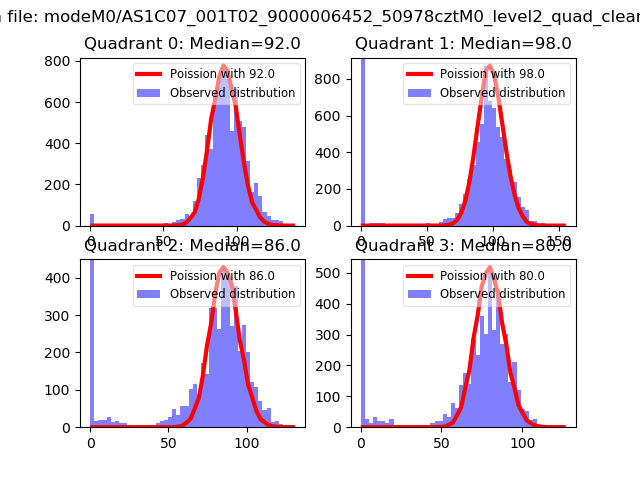 |
 |
| Quadrant-wise count rates Data is divided into 100 sec bins |
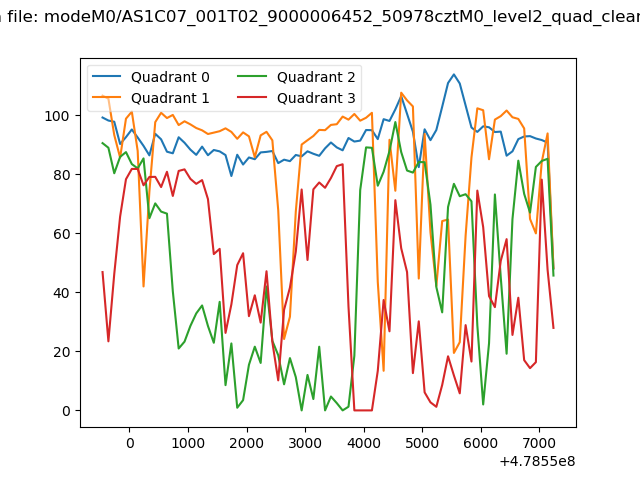 |
|
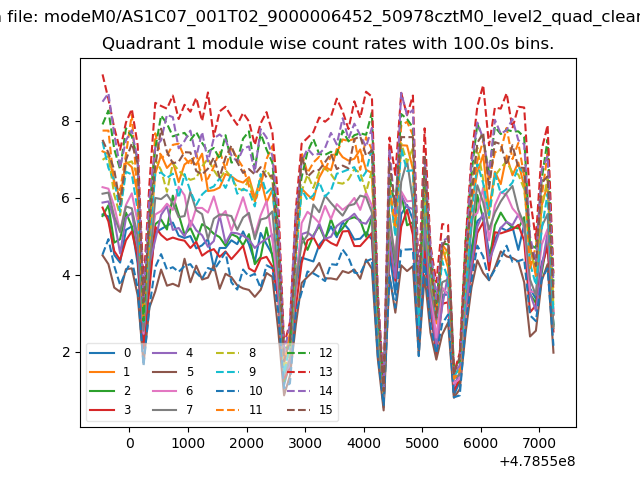
| Module-wise count rates for Quadrant A Data is divided into 100 sec bins |
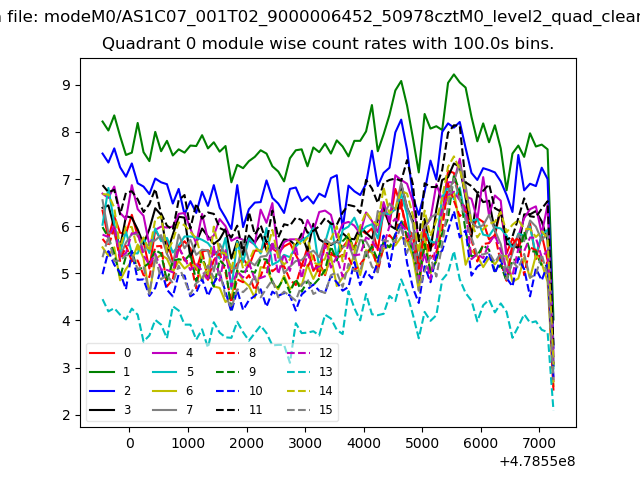 |
 |
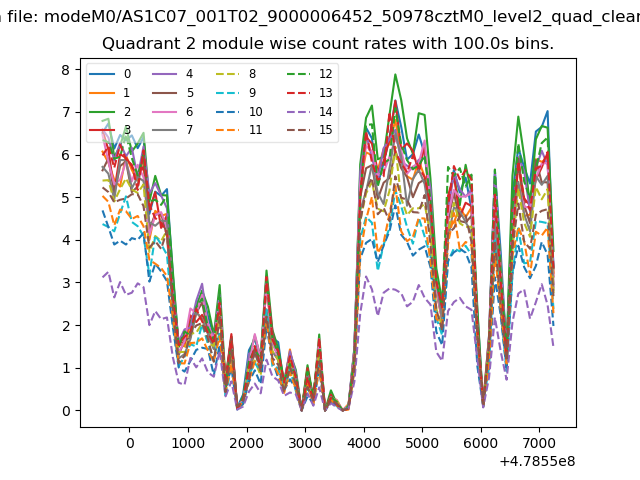
| Module-wise count rates for Quadrant B Data is divided into 100 sec bins |
 |
 |
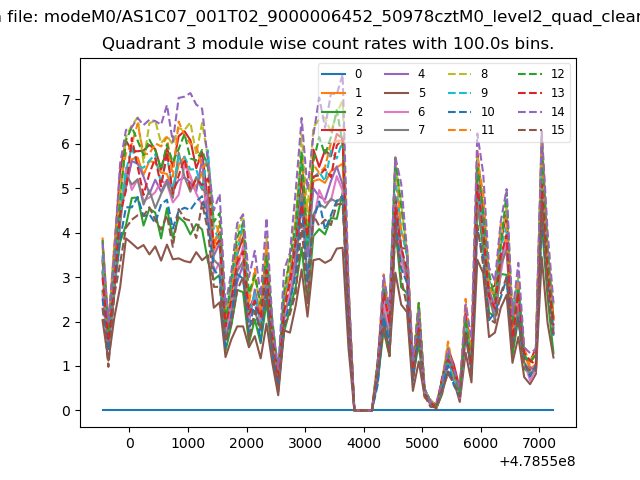
| Module-wise count rates for Quadrant C Data is divided into 100 sec bins |
 |
 |
| Module-wise count rates for Quadrant D Data is divided into 100 sec bins |
 |
 |
| Parameter | Plot |
|---|---|
| CZT HV Monitor | 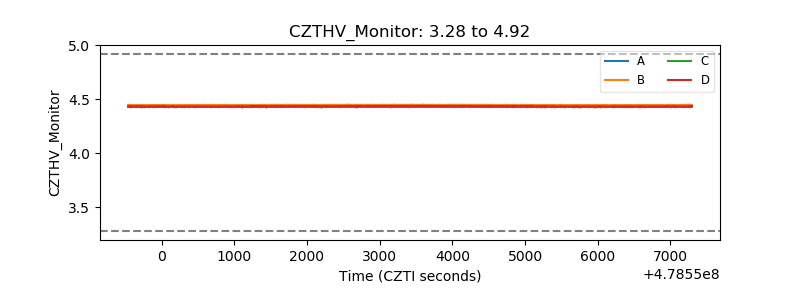 |
| D_VDD | 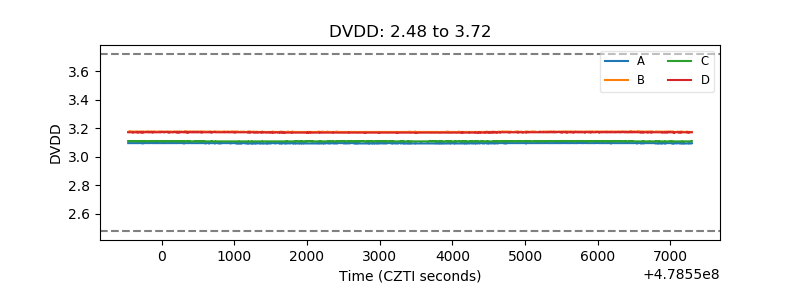 |
| Temperature 1 | 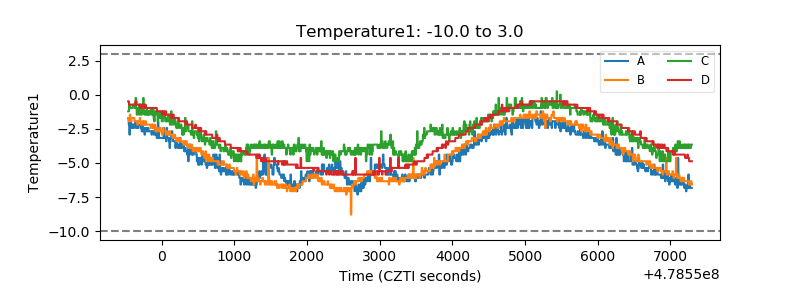 |
| Veto HV Monitor | 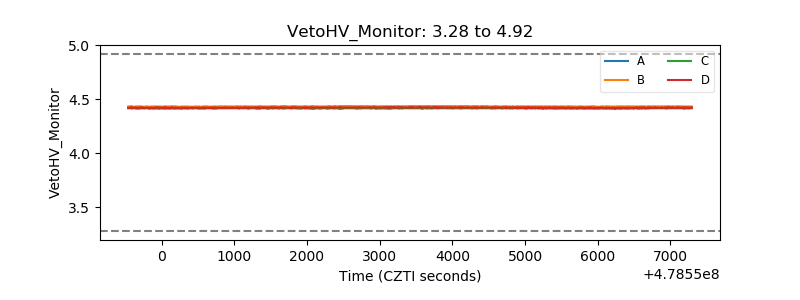 |
| Veto LLD | 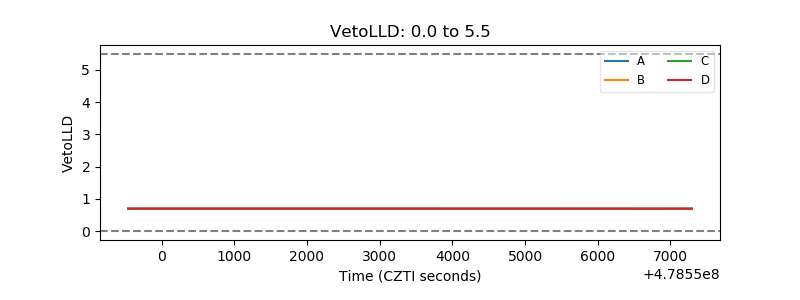 |
| Alpha Counter | 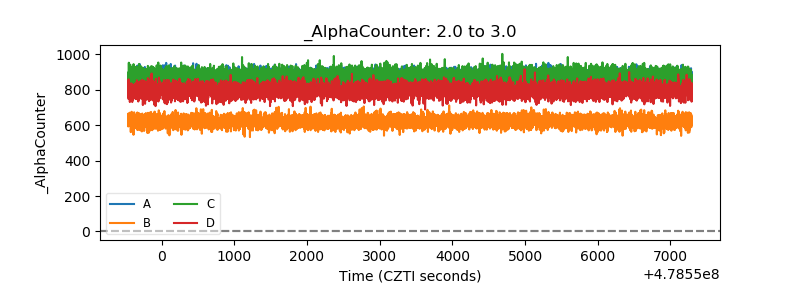 |
| _CPM_Rate | 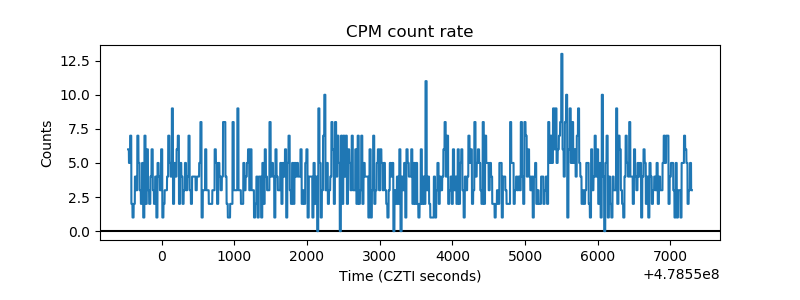 |
| CZT Counter | 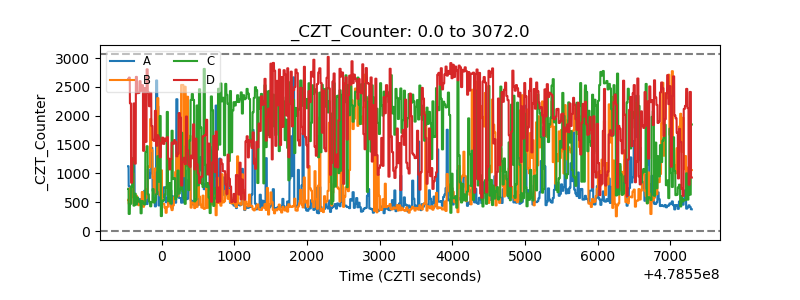 |
| +2.5 Volts monitor | 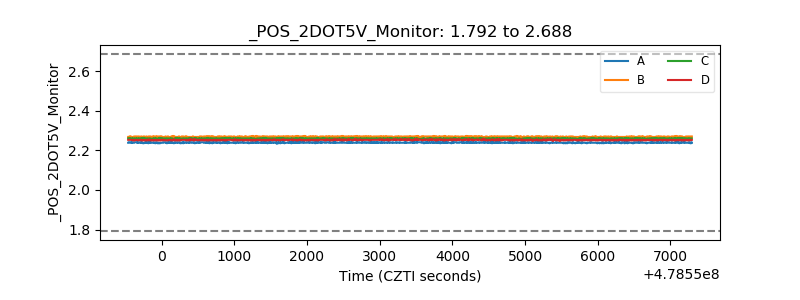 |
| +5 Volts monitor | 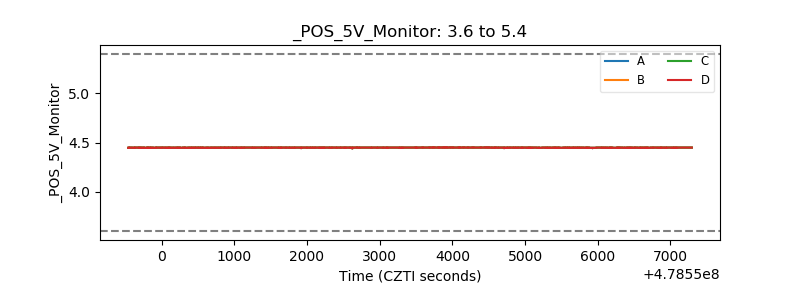 |
| _ROLL_ROT | 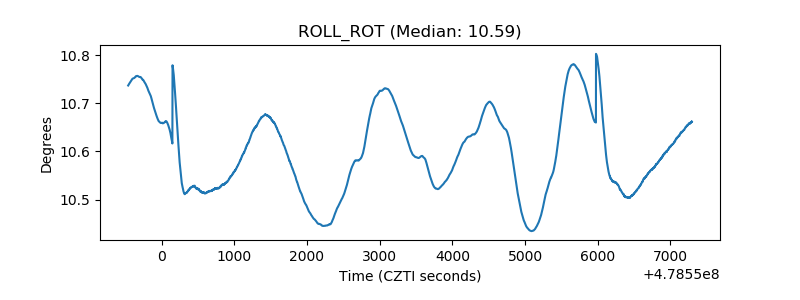 |
| _Roll_DEC | 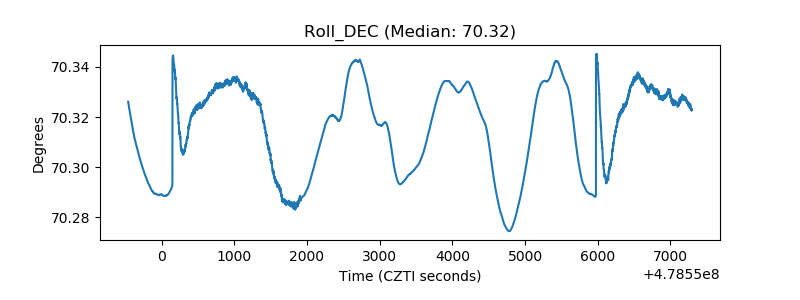 |
| _Roll_RA | 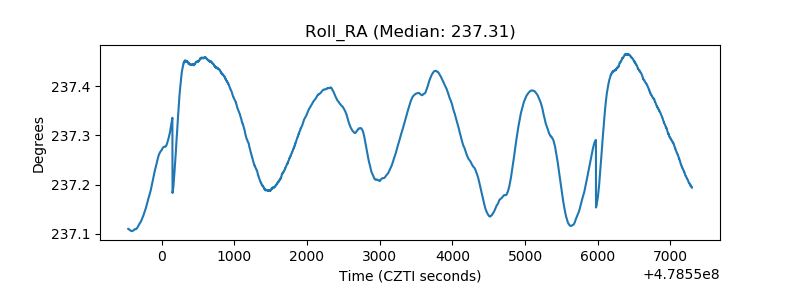 |
| Veto Counter | 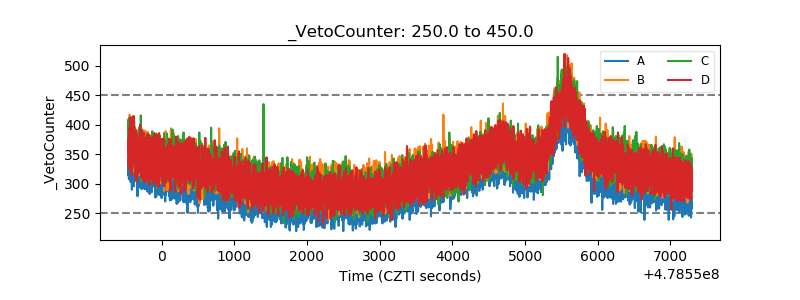 |