| Param | Original file | Final file |
|---|---|---|
| Filename | modeM0/AS1C07_001T02_9000006452_50981cztM0_level2.fits | modeM0/AS1C07_001T02_9000006452_50981cztM0_level2_quad_clean.evt |
| Size (bytes) | 2,264,218,560 | 226,987,200 |
| Size | 2.1 GB | 216.5 MB |
| Events in quadrant A | 12,995,372 | 1,626,978 |
| Events in quadrant B | 19,929,207 | 1,550,394 |
| Events in quadrant C | 20,712,512 | 1,313,481 |
| Events in quadrant D | 28,720,162 | 1,075,247 |
| Mode SS | |||
|---|---|---|---|
| Quadrant | BADHDUFLAG | Total packets | Discarded packets |
| A | 0 | 384 | 0 |
| B | 0 | 384 | 0 |
| C | 0 | 384 | 0 |
| D | 0 | 384 | 0 |
| Mode M9 | |||
|---|---|---|---|
| Quadrant | BADHDUFLAG | Total packets | Discarded packets |
| A | 0 | 13 | 0 |
| B | 0 | 13 | 0 |
| C | 0 | 13 | 0 |
| D | 0 | 13 | 0 |
| Mode M0 | |||
|---|---|---|---|
| Quadrant | BADHDUFLAG | Total packets | Discarded packets |
| A | 0 | 51638 | 4 |
| B | 0 | 72732 | 4 |
| C | 0 | 74887 | 4 |
| D | 0 | 98621 | 4 |
| Quadrant | Total seconds | Saturated seconds | Saturation percentage |
|---|---|---|---|
| A | 18935 | 946 | 4.996039% |
| B | 18935 | 3284 | 17.343544% |
| C | 18935 | 3951 | 20.866121% |
| D | 18936 | 5980 | 31.580059% |
Noise dominated data is calculated using 1-second bins in cleaned event files. If a bin has >2000 counts, and if more than 50% of those come from <1% of pixels, then it is considered to be noise-dominated and hence unusable.
| Quadrant | # 1 sec bins | Bins with >0 counts | Bins with >2000 counts | High rate bins dominated by noise | Noise dominated (total time) | Noise dominated (detector-on time) | Marked lightcurve |
|---|---|---|---|---|---|---|---|
| A | 20230 | 18939 | 793 | 793 | 3.92% | 4.19% | 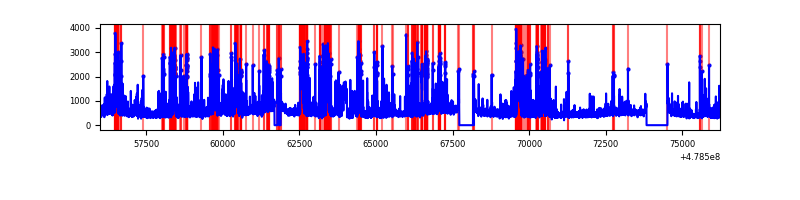 |
| B | 20230 | 18937 | 2159 | 2159 | 10.67% | 11.40% | 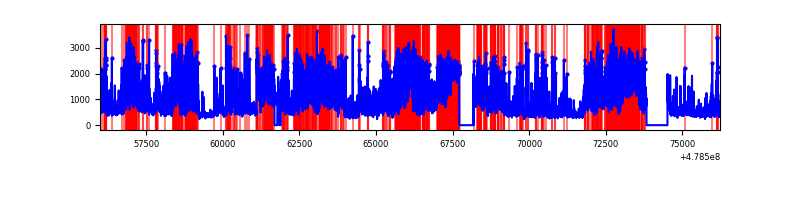 |
| C | 20230 | 18938 | 3193 | 3193 | 15.78% | 16.86% | 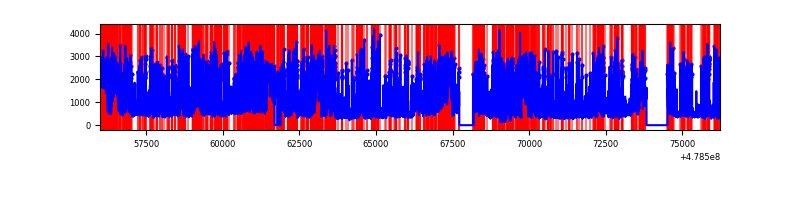 |
| D | 20231 | 18940 | 5735 | 5735 | 28.35% | 30.28% | 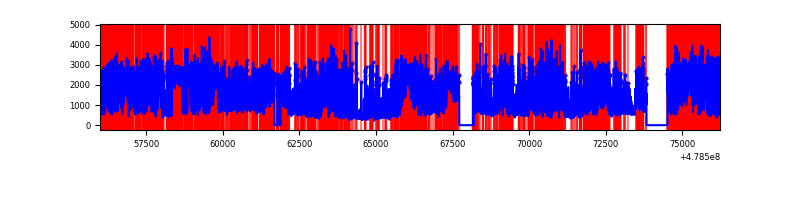 |
Top three noisy pixels from each quadrant. If the there are fewer than three noisy pixels in the level2.evt file, extra rows are filled as -1
| Pixel properties | Quadrant properties | ||||||
|---|---|---|---|---|---|---|---|
| Quadrant | DetID | PixID | Counts | Sigma | Mean | Median | Sigma |
| A | 8 | 43 | 2213270 | 4553.29 | 1940 | 1889 | 485.7 |
| A | 4 | 3 | 714628 | 1467.55 | 1940 | 1889 | 485.7 |
| A | 3 | 130 | 432812 | 887.28 | 1940 | 1889 | 485.7 |
| B | 0 | 172 | 4698401 | 12120.93 | 1831 | 1762 | 387.5 |
| B | 12 | 32 | 4419518 | 11401.2 | 1831 | 1762 | 387.5 |
| B | 4 | 81 | 1810924 | 4669.03 | 1831 | 1762 | 387.5 |
| C | 0 | 177 | 2076450 | 4331.13 | 1715 | 1703 | 479.0 |
| C | 1 | 44 | 1899584 | 3961.91 | 1715 | 1703 | 479.0 |
| C | 13 | 3 | 1558593 | 3250.08 | 1715 | 1703 | 479.0 |
| D | 8 | 176 | 9133520 | 19752.85 | 1640 | 1588 | 462.3 |
| D | 7 | 39 | 2200605 | 4756.59 | 1640 | 1588 | 462.3 |
| D | 15 | 184 | 1837299 | 3970.74 | 1640 | 1588 | 462.3 |
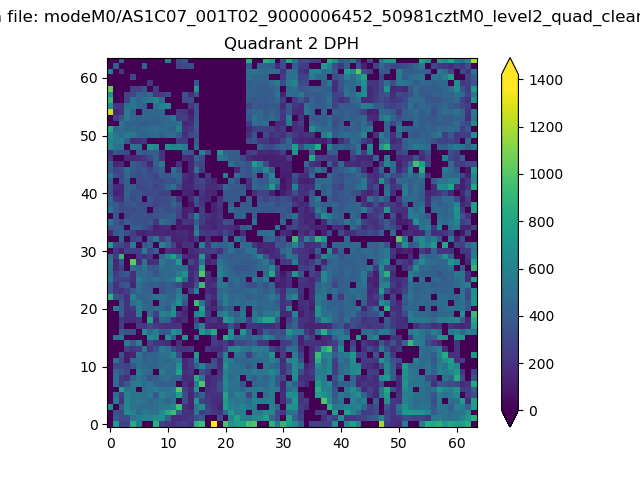
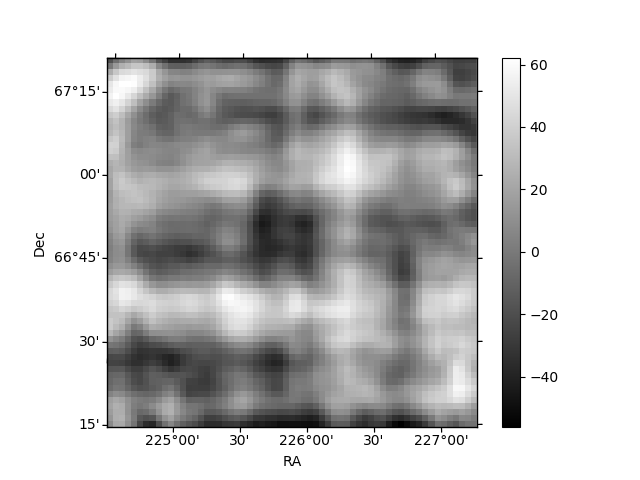
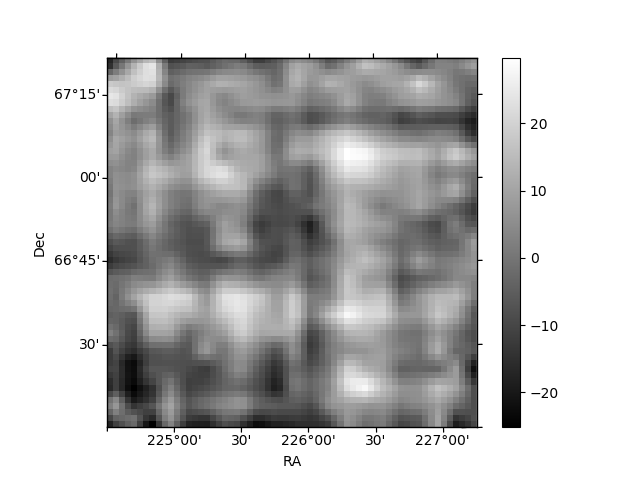
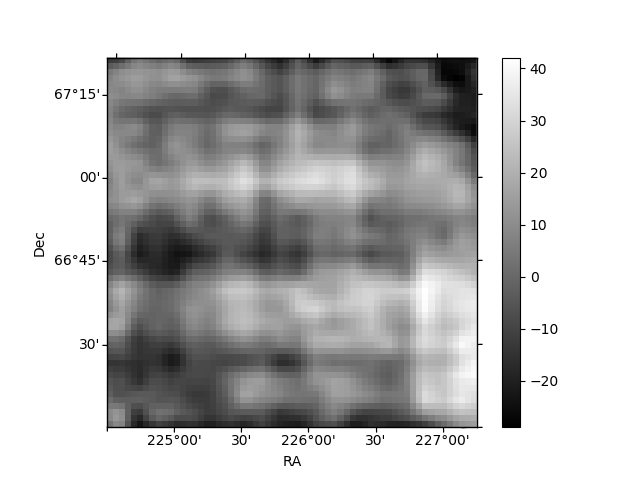
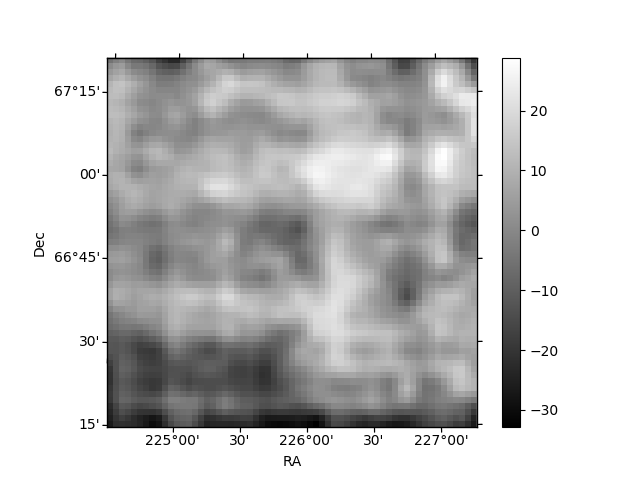
Histogram calculated using DETX and DETY for each event in the final _common_clean file
| Quadrant A | 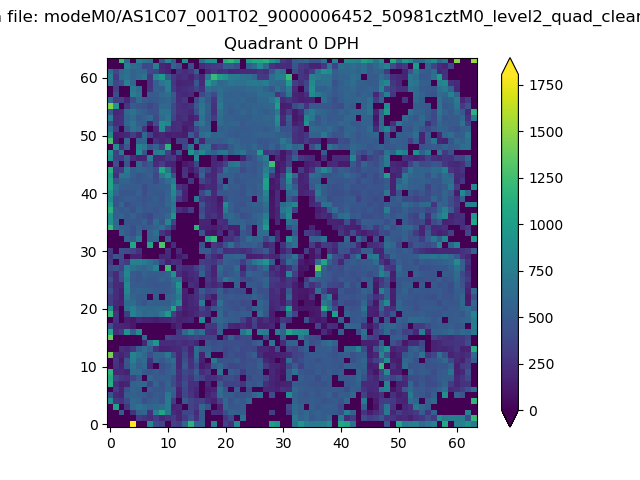 |
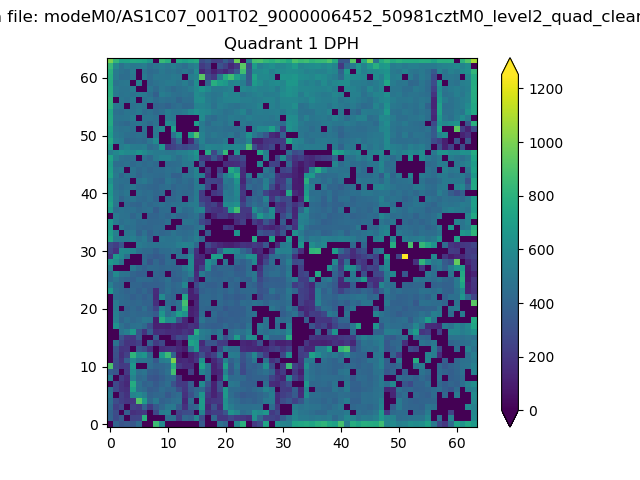 |
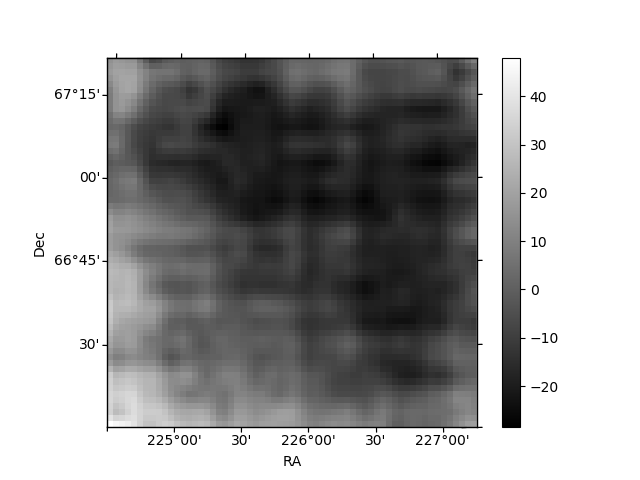
Quadrant B |
|---|---|---|---|
| Quadrant D | 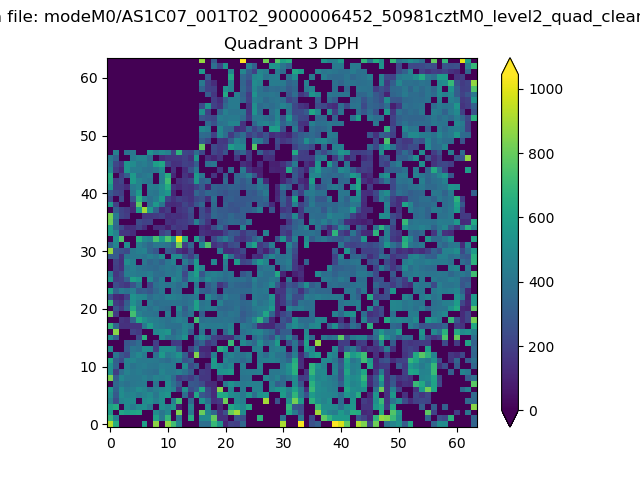 |
 |
Quadrant C |
| Plot type | Count rate plots | Images |
|---|---|---|
| Comparison with Poisson distribution Blue bars denote a histogram of data divided into 1 sec bins. Red curve is a Poisson curve with rate = median count rate of data. |
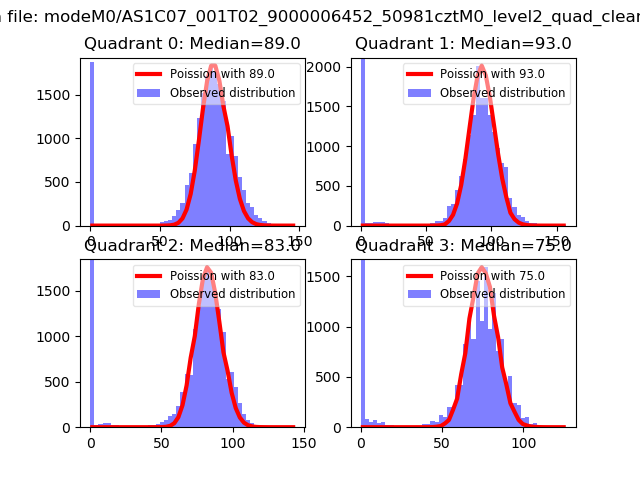 |
 |
| Quadrant-wise count rates Data is divided into 100 sec bins |
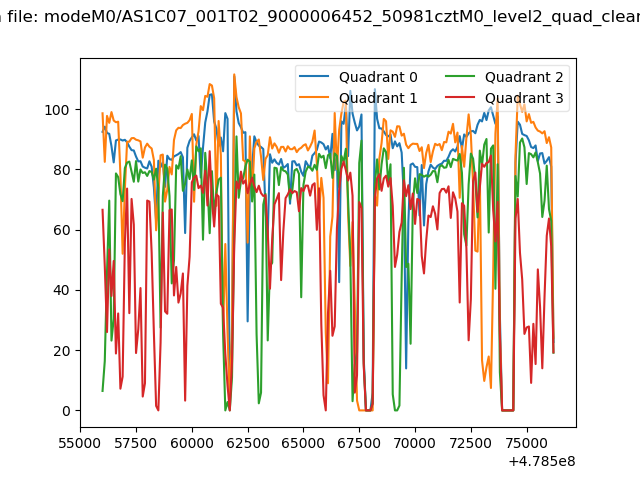 |
|
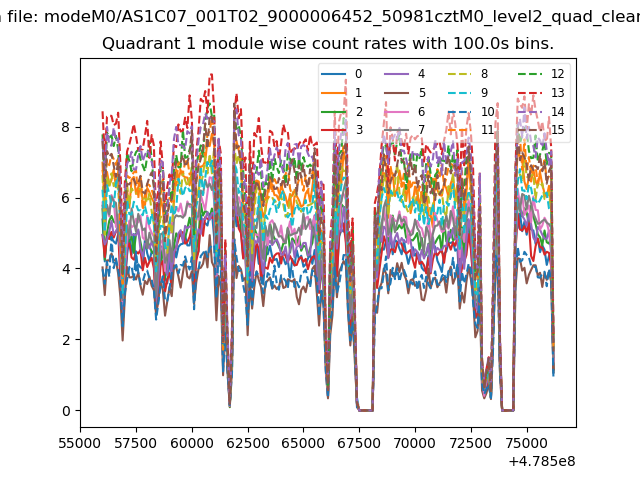
| Module-wise count rates for Quadrant A Data is divided into 100 sec bins |
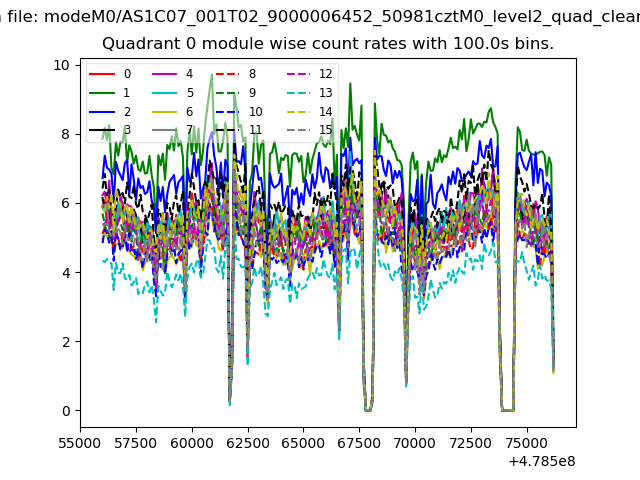 |
 |
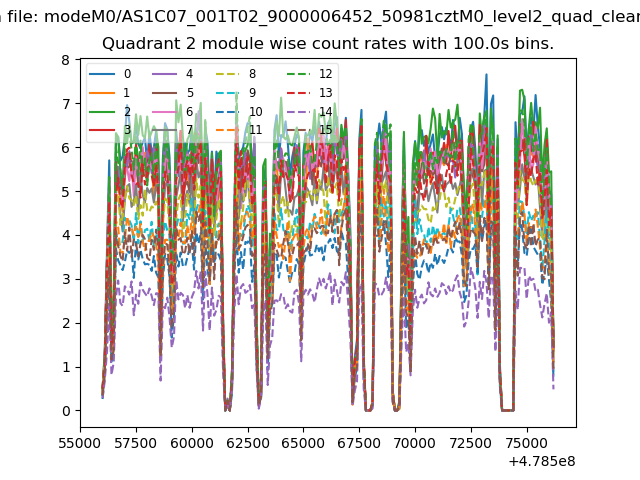
| Module-wise count rates for Quadrant B Data is divided into 100 sec bins |
 |
 |
| Module-wise count rates for Quadrant C Data is divided into 100 sec bins |
 |
 |
| Module-wise count rates for Quadrant D Data is divided into 100 sec bins |
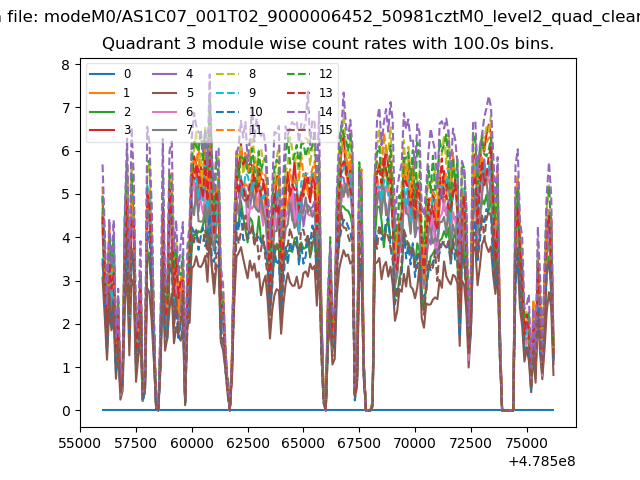 |
 |
| Parameter | Plot |
|---|---|
| CZT HV Monitor | 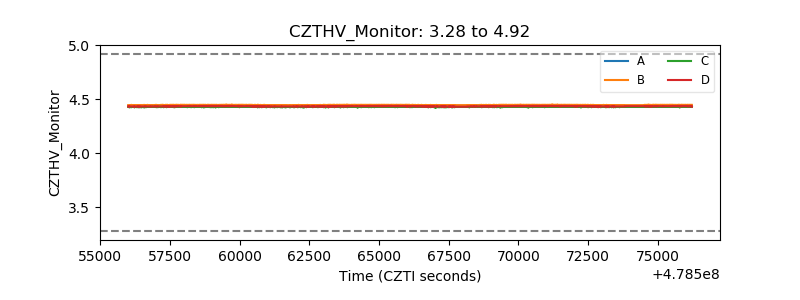 |
| D_VDD | 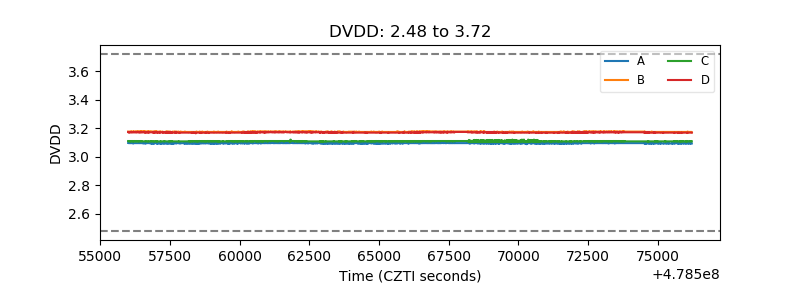 |
| Temperature 1 | 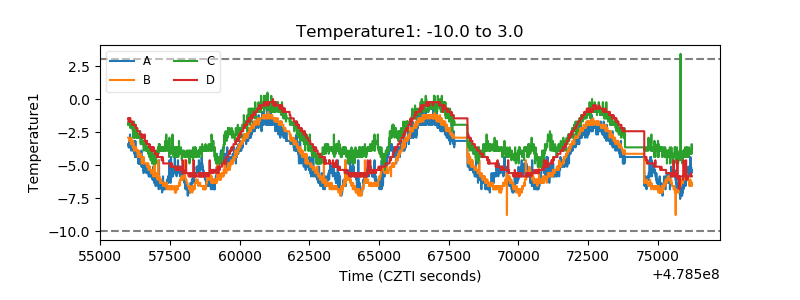 |
| Veto HV Monitor | 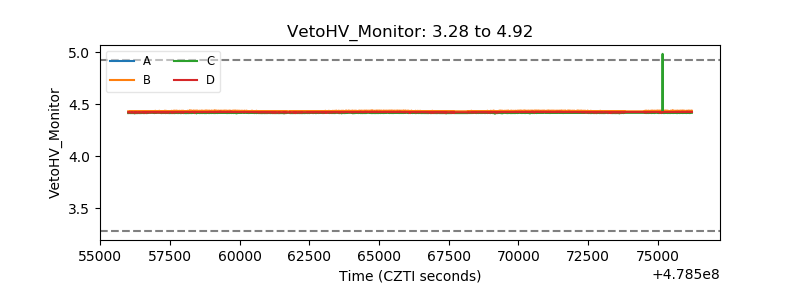 |
| Veto LLD | 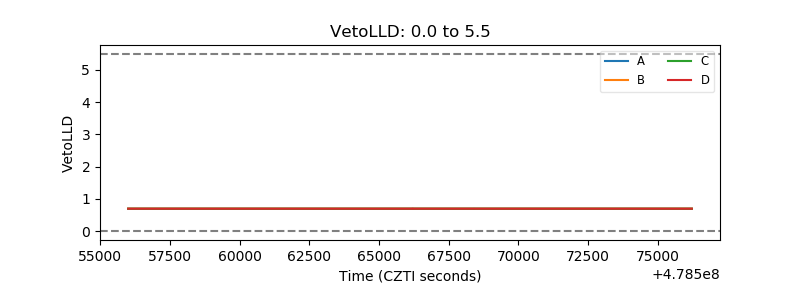 |
| Alpha Counter | 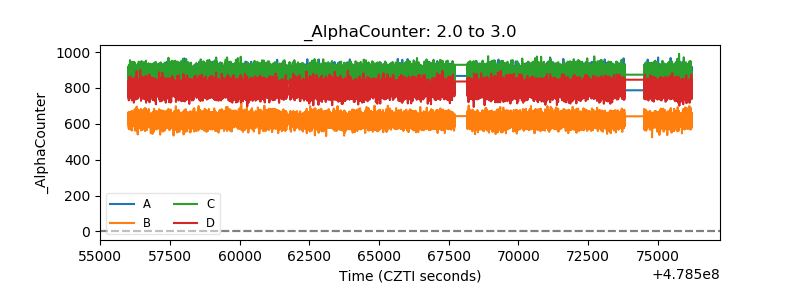 |
| _CPM_Rate | 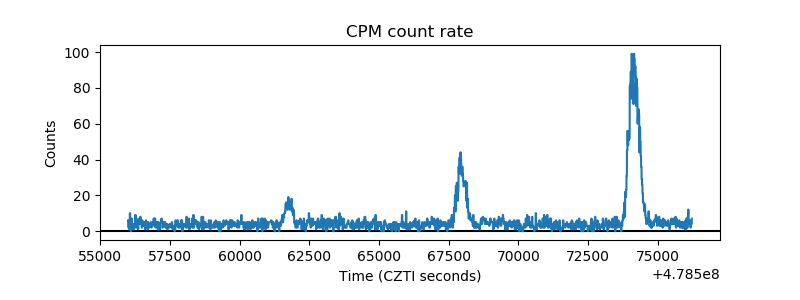 |
| CZT Counter | 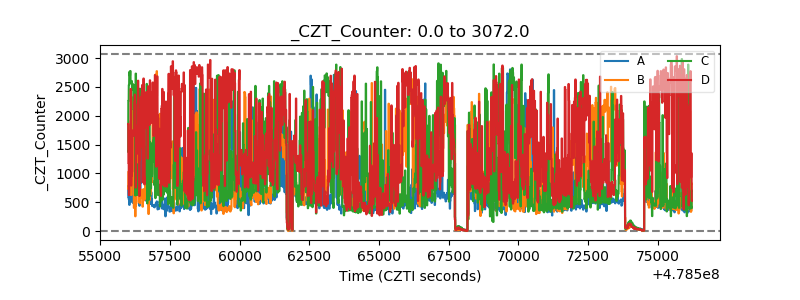 |
| +2.5 Volts monitor | 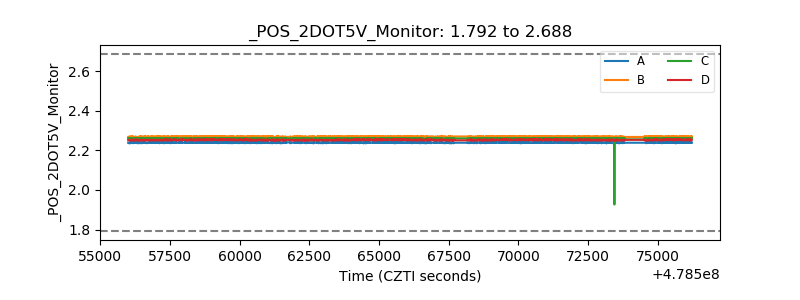 |
| +5 Volts monitor | 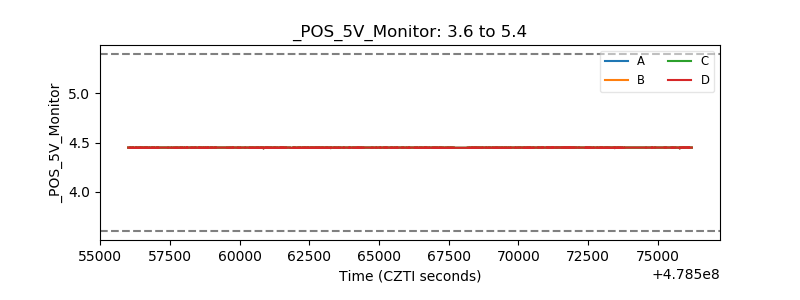 |
| _ROLL_ROT | 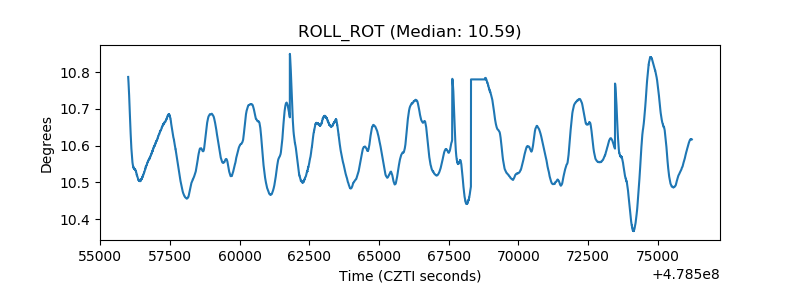 |
| _Roll_DEC | 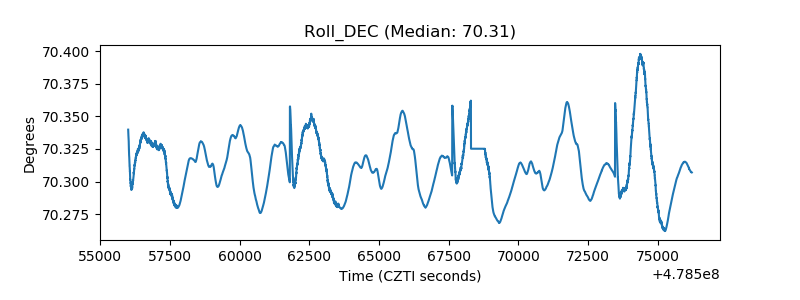 |
| _Roll_RA | 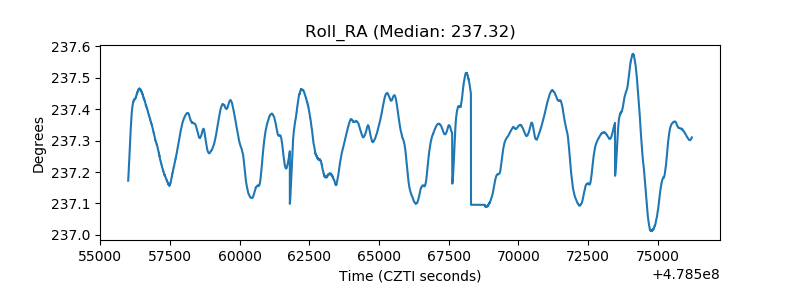 |
| Veto Counter | 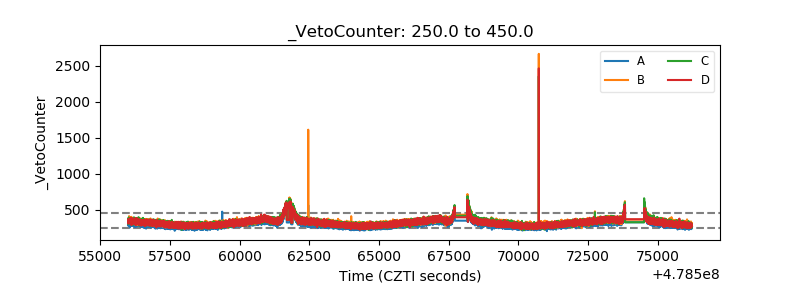 |